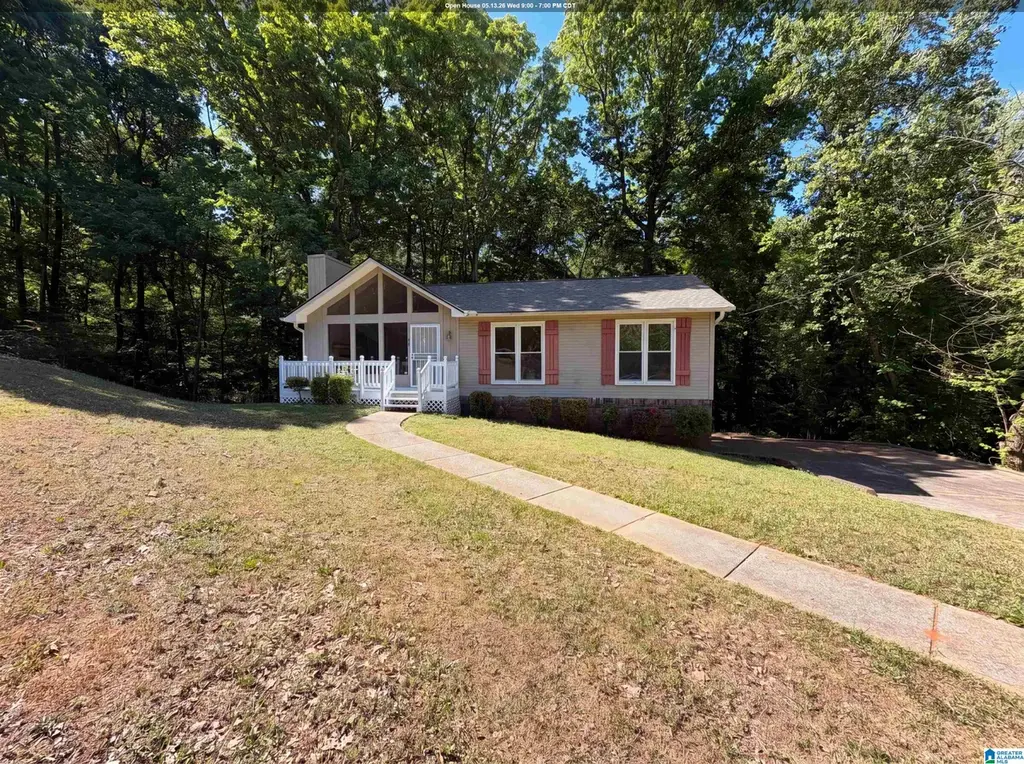
1500 Shady Oak Cir · Birmingham, AL
Flood risk 1/10 · Minimal
- FEMA flood zone
- X (unshaded)
- Chance of flooding over 30 yrs
- 0.0%
- Est. flood insurance / yr
- $473 – $860
Fire risk 3/10 · Minor
- Est. fire insurance / yr
- $916 – $1,700
Heat risk 5/10 · Moderate
- Hot days now (above 105°F)
- 6 days/yr
- Hot days in 30 yrs
- 16 days/yr
Wind risk 6/10 · Moderate
- Chance of severe wind over 30 yrs
- 27.0%
Air-quality risk 5/10 · Moderate
- Unhealthy air days now
- 7 days/yr
- Unhealthy air days in 30 yrs
- 9 days/yr
Risk factors via First Street. Map © Google.
Why this score? — see what drove the C- grade
The composite is a weighted blend of 9 inputs, each scored 0–100. Each bar is that input's sub-score; the figure is the points it added to the 100-point composite (weight × sub-score).
- Cash flow +18.8/30.0
- ARV discount +14.2/15.0
- DSCR +5.9/10.0
- 1% rule +4.0/10.0
- Rent growth +3.8/5.0
- Livability +3.4/5.0
- Condition / age +2.5/5.0
- Schools +0.9/10.0
- Appreciation +0.0/10.0
$174,000
🖨 Deal sheet 📄 Offer letter ✓ Due diligence
Listing remarks MLS
Welcome to 1500 Shady Oak Cir, a well-maintained residence recently updated with a new roof for enhanced durability. The interior contains a comfortable fireplace, providing a focal point for the main living area. Beyond the main structure, an expansive deck extends to a fully fenced in backyard, creating a defined outdoor space for everyday living. This property presents lasting quality and outdoor appeal — make it your own. . Included 100-Day Home Warranty with buyer activation
Key facts
- New roof
- Expansive deck
- 0.38 acre lot
Tags
Neighborhood map
What this means for you Summary
Snapshot
- This is a 3-bed/2.0-bath single-family listed at $174k.
Deal economics
- At list price, monthly cash flow is $175 ($2k/yr) — positive.
- The deal already cash-flows at list — no discount required.
- To meet the 1% rule (rent ≥ 1% of price), the offer needs to be $156k (10.4% below list).
- Recommended offer: $156k (10.4% below list) — sets the bar for 1% rule.
- Cap rate 7.5% vs local median 6.2% in Birmingham — meaningfully above typical; check what's discounted (condition, days-on-market, listing class) to confirm the premium yield is real.
Location & tenants
- Location reads 67/100 on livability (#78 in AL) — a middle-class / working-renter tenant base. Strengths: commute A+, cost of living A+, housing A+; Watch: amenities C-, schools F, crime F.
- Birmingham City (urban): math 4% / reading 20% proficiency, ranked #116 of 129 in AL (top 90%) — low school quality limits family demand, transient renter base, plan for 1-2y turnover; 82% free/reduced lunch — lower-income household profile, screen leases tightly.
- Market conditions: Rents rising fast (+5.4%/yr); 114 active listings in the ZIP; 25 comparable units currently listed for rent nearby; rentals at typical pace (median 24d on market — plan ~3-4 weeks tenant-placement turnaround); 2,114 units permitted in Jefferson County in 2024 (556 in 5+ unit buildings).
Forward outlook
- Local home prices are declining (-3.0%/yr); year-one equity from $1k of loan paydown is wiped out by about $5k of value loss. Plan a longer hold.
- Jefferson County population projected to shrink 4% by 2050 — rents likely to lag national; underwrite the cash flow, not the appreciation.
Negotiation context
- It's been on market 59 days — a 3% lower offer ($169k) is reasonable based on typical stale-listing flexibility.
Risks & watch-outs
- Climate carrying-cost: major wind risk, 27% chance of damaging wind over 30y; extreme-heat days projected 6→16/yr by 2055 (HVAC capex compounding) — expect insurance premiums to compound above CPI over the hold.
Questions for the listing agent
- It's been on market 59 days. Have you received any prior offers? Is the seller open to a 10% concession, seller financing, or rate buy-down credit?
- Is there a deadline driving the sale (1031 exchange, divorce, estate, relocation)? That informs how much negotiation room exists.
- Schools are F-rated, which usually means shorter tenancies and higher turnover. Who's the typical renter profile here, and what's been the actual vacancy rate?
- Crime grade is F in this area — have there been break-ins, vandalism, or insurance claims at this property in the last 3 years? What carrier currently insures it and at what premium?
- What's the average days-on-market for RENTAL listings here right now (not sales)? A rising rental-DOM trend means longer vacancies and softer asking-rent achievability than the comps imply.
- What's the recent tenant-quality profile in this submarket — average credit score on applications, eviction rate, late-payment / NSF rate, and stable-employment percentage? A property-management company in the area should have these aggregated.
- How much new for-sale + rental construction is in the pipeline within 1–3 miles? Heavy new supply typically softens prices + rents 12–24 months out; constrained supply supports both.
Investment metrics
- 1% rule
- 0.90% ✗
- Cap rate
- 7.50%
- Cash-on-cash
- 4.32%
- DSCR
- 1.19
- GRM
- 9.3
CMA / ARV
- ARV (median comp)
- $204,312
- List price
- $174,000
- Delta
- -14.84%
- Verdict
- UNDERPRICED
- Comps
- 20 within 1.0 mi
Show comp detail 12 sales within ~0.75 mi
| Address | Dist | Beds/Ba | Sqft | Sold | Price | $/sf | Match |
|---|---|---|---|---|---|---|---|
| 1641 Azalea Dr | 0.16mi | 4/2.0 (+1) | 1,728 (+0%) | 3mo | $169,000 | $98 | 85 |
| 1416 Brewster Cir | 0.43mi | 3/2.0 | 1,662 (-4%) | 2mo | $155,000 | $93 | 73 |
| 1320 Turncliff Dr | 0.46mi | 3/2.0 | 1,715 (-0%) | 8mo | $263,000 | $153 | 71 |
| 1792 Annendale Dr | 0.39mi | 4/2.5 (+1) | 1,679 (-3%) | 9mo | $245,000 | $146 | 63 |
| 1421 Hickory Ln | 0.73mi | 3/2.0 | 1,692 (-2%) | 5mo | $182,500 | $108 | 58 |
| 1742 Molly Ln | 0.59mi | 4/2.0 (+1) | 1,696 (-2%) | 8mo | $219,900 | $130 | 58 |
| 1586 Wilderness Ln | 0.29mi | 4/3.0 (+1) | 1,908 (+11%) | 3mo | $320,000 | $168 | 58 |
| 1700 Maralyn Dr | 0.71mi | 3/2.0 | 1,692 (-2%) | 10mo | $194,500 | $115 | 55 |
| 1731 Annendale Dr | 0.39mi | 4/2.0 (+1) | 1,922 (+12%) | 6mo | $230,500 | $120 | 53 |
| 1524 Highland Dr | 0.42mi | 3/2.0 | 1,972 (+14%) | 6mo | $240,000 | $122 | 52 |
| 1711 Tudor Dr | 0.57mi | 3/2.5 | 1,933 (+12%) | 0mo | $200,000 | $103 | 51 |
| 1320 Pine Tree Dr | 0.72mi | 3/2.0 | 1,891 (+10%) | 2mo | $210,900 | $112 | 49 |
Match score weights: distance 35% · size 25% · config 20% · recency 20%. Top-matched comps best support the ARV.
Projected returns pro-forma
-3.0% appreciation · 5.39% rent growth · sell at horizon
- IRR
- -7.2%
- Equity multiple
- 0.73×
- Total profit
- $-13,267
- Equity at exit
- $25,944
- IRR
- 4.9%
- Equity multiple
- 1.39×
- Total profit
- $19,078
- Equity at exit
- $15,044
Cash invested: $48,720 (down + closing). Projections, not guarantees.
Landlord ↔ Tenant lean methodology
- Overall (STATE)
- 90 Strongly Landlord-Friendly
- State Alabama
- 90 Strongly Landlord-Friendly · R+15
- County
- — inherits STATE
- City
- — inherits STATE
ZIP-level market 35235
- Home prices YoY
- -21.1%
- Rents YoY
- 5.4%
- Active inventory
- 114
- Price-to-rent
- 9.3×
Monthly cashflow live
- Estimated rent
- $1,558 high interval (Pro) →
- Mortgage (P&I)
- −$912
- Tax from tax record
- −$71 /mo · $849/yr
- Insurance
- −$72
- HOA
- −$0
- Vacancy / Maint / Mgmt
- −$327
- Net cashflow
- $175
Break-even live
UW: 25.0% down · 7.5% · 30yr · 1.5% tax · 5.0% vac · 8.0% maint · 8.0% mgmt
Financing live
Cash to close
- Down payment
- $43,500
- Closing costs
- $5,220
- Reserves months
- —
- Total cash needed
- —
Loan-product check · same deal, 3 products live
Conventional
25% down · 7.5% · 30yr
- Down + closing
- —
- Monthly P&I
- —
- Monthly cashflow
- —
- DSCR
- —
- Eligible?
- —
Personal DTI + credit; lowest rate.
DSCR
20% down · 8.5% · 30yr
- Down + closing
- —
- Monthly P&I
- —
- Monthly cashflow
- —
- DSCR
- —
- Eligible?
- —
No personal income docs; deal must DSCR.
Hard money
10% down · 12.0% · 12mo
- Down + closing
- —
- Monthly P&I
- —
- Monthly cashflow
- —
- DSCR
- —
- Eligible?
- —
Short-term bridge; refi at stabilization.
Rent comps 25 comps
| Address | Beds | Baths | Sqft | Rent | $/sqft | DOM | Units | Dist |
|---|---|---|---|---|---|---|---|---|
| 1753 Tall Oak Cir Birmingham, AL | 3.0 | 2.0 | 1380 | $1,225 | $0.89 | 3d | 1 | 0.09mi |
| 1729 Tall Oak Cir Birmingham, AL | 3.0 | 2.0 | 1403 | $1,630 | $1.16 | 2d | 1 | 0.16mi |
| 1421 Brewster Cir Birmingham, AL | 3.0 | 2.0 | 1439 | $1,525 | $1.06 | 2d | 1 | 0.35mi |
| 1516 Highland Dr Birmingham, AL | 4.0 | 2.0 | 1104 | $1,675 | $1.52 | 15d | 1 | 0.40mi |
| 1733 Molly Dr Birmingham, AL | 4.0 | 1.5 | 1570 | $1,460 | $0.93 | 10d | 1 | 0.46mi |
| 1440 Hickory Ln Birmingham, AL | 3.0 | 2.0 | 1448 | $1,625 | $1.12 | 2d | 1 | 0.63mi |
| 1409 Medina Ln Birmingham, AL | 3.0 | 2.0 | 2113 | $1,600 | $0.76 | 44d | 1 | 0.71mi |
| 1808 Brewster Rd Birmingham, AL | 4.0 | 2.0 | 1548 | $1,515 | $0.98 | 44d | 1 | 0.75mi |
| 940 Pine Hill Rd Birmingham, AL | 3.0 | 2.0 | 1926 | $1,475 | $0.77 | 44d | 1 | 0.78mi |
| 1830 Christian St Birmingham, AL | 3.0 | 2.0 | 1468 | $1,375 | $0.94 | 3d | 1 | 0.85mi |
| 1328 Oak Ter Birmingham, AL | 3.0 | 2.0 | 1772 | $1,581 | $0.89 | 12d | 1 | 0.86mi |
| 1761 Big Mountain Dr Birmingham, AL | 4.0 | 2.0 | 1632 | $1,575 | $0.97 | 44d | 1 | 0.93mi |
| 1748 Sonia Dr Birmingham, AL | 4.0 | 2.0 | 1401 | $1,395 | $1.00 | 44d | 1 | 0.94mi |
| 1235 Little Brook Ln Birmingham, AL | 3.0 | 2.0 | 1787 | $2,400 | $1.34 | 44d | 1 | 0.95mi |
| 1760 Sonia Dr Birmingham, AL | 3.0 | 2.0 | 1550 | $1,635 | $1.05 | 2d | 1 | 0.95mi |
| 744 Vaughn Cir Birmingham, AL | 4.0 | 2.0 | 1516 | $1,561 | $1.03 | 24d | 1 | 0.95mi |
| 1868 Carraway St Birmingham, AL | 3.0 | 2.0 | 1819 | $1,500 | $0.82 | 24d | 1 | 1.05mi |
| 1700 Serene Dr Birmingham, AL | 4.0 | 1.5 | 1543 | $1,630 | $1.06 | 2d | 1 | 1.16mi |
| 1360 Orlando Cir NE Birmingham, AL | 3.0 | 2.0 | 1489 | $1,455 | $0.98 | 24d | 1 | 1.20mi |
| 1935 Springlake Ct Unit 1 Birmingham, AL | 2.0 | 1.5 | 1152 | $1,095 | $0.95 | 44d | 1 | 1.21mi |
| 1819 Valley Run Cir Birmingham, AL | 4.0 | 2.5 | 1694 | $1,761 | $1.04 | 44d | 1 | 1.22mi |
| 1845 Stonehenge Dr Birmingham, AL | 3.0 | 2.0 | 1358 | $1,323 | $0.97 | 15d | 1 | 1.23mi |
| 1817 Lyle Dr Birmingham, AL | 4.0 | 2.0 | 1361 | $1,605 | $1.18 | 24d | 1 | 1.24mi |
| 1340 Orlando Cir NE Birmingham, AL | 3.0 | 2.0 | 1329 | $1,166 | $0.88 | 24d | 1 | 1.27mi |
| 2025 Brewster Rd Birmingham, AL | 3.0 | 2.0 | 1369 | $1,450 | $1.06 | 24d | 1 | 1.44mi |
Listing history 20 events
-
2026-06-18days on market $174,000 Active 59 DOM
-
2026-06-17days on market $174,000 Active 58 DOM
-
2026-06-16days on market $174,000 Active 57 DOM
-
2026-06-15days on market $174,000 Active 56 DOM
-
2026-06-13pricedays on market $174,000 Active 54 DOM
-
2026-06-10days on market $182,000 Active 51 DOM
-
2026-06-09days on market $182,000 Active 50 DOM
-
2026-06-08days on market $182,000 Active 49 DOM
-
2026-06-07days on market $182,000 Active 48 DOM
-
2026-06-03days on market $182,000 Active 44 DOM
-
2026-06-02days on market $182,000 Active 43 DOM
-
2026-06-01days on market $182,000 Active 42 DOM
-
2026-05-31days on market $182,000 Active 41 DOM
-
2026-05-07price $186,000 490-char remark
Show marketing remark (490 chars)
Welcome to 1500 Shady Oak Cir, a well-maintained residence recently updated with a new roof for enhanced durability. The interior contains a comfortable fireplace, providing a focal point for the main living area. Beyond the main structure, an expansive deck extends to a fully fenced in backyard, creating a defined outdoor space for everyday living. This property presents lasting quality and outdoor appeal — make it your own. . Included 100-Day Home Warranty with buyer activation
-
2026-04-20$188,000 Active 490-char remark
Show marketing remark (490 chars)
Welcome to 1500 Shady Oak Cir, a well-maintained residence recently updated with a new roof for enhanced durability. The interior contains a comfortable fireplace, providing a focal point for the main living area. Beyond the main structure, an expansive deck extends to a fully fenced in backyard, creating a defined outdoor space for everyday living. This property presents lasting quality and outdoor appeal — make it your own. . Included 100-Day Home Warranty with buyer activation
-
2026-04-02soldstatus $186,000
-
2020-12-23soldstatus $122,000
-
2002-06-20soldstatus $96,000
-
1992-04-30soldstatus $74,900
-
1983-05-01soldstatus $60,425
ⓘ Source: listings_history table (triggers on properties + properties_extension) + one-shot
backfill from property_details.listing_events for pre-trigger history.
Tax reassessment forecast AL · Resets to sale price
- Current annual tax
- $849 · $71/mo
- Projected year-2 tax
- $849 · $71/mo
- Expected delta
- $0/yr ($0/mo · 0.0%)
ⓘ Screening estimate from a state-policy table — verify with the county assessor before closing.
Climate risk First Street
- Flood 1/10 Low FEMA zone X (unshaded) · 0% chance over 30 yrs
- Wildfire 3/10 Moderate
- Heat 5/10 Major 6 d/yr ≥105°F today · 16 d/yr by 30 yrs out
- Wind 6/10 Major 27% chance of damaging wind over 30 yrs
- Air quality 5/10 Major 7 unhealthy d/yr today · 9 by 30 yrs out
Nearby sold comps map
Loading sold comps map…
Walkable amenities ~0.75 mi
Loading nearby amenities…
Taxation est. · year 1
- Rental income
- $18,698
- − Mortgage interest
- −$9,747
- − Property taxes
- −$849
- − Insurance
- −$870
- − Repairs & maintenance
- −$1,496
- − Management
- −$1,496
- − Depreciation
- −$5,062
- Taxable loss
- −$821
- Est. tax savings @ 24.0%
- +$197
- After-tax cash flow
- $2,300/yr
For passive investors: Depreciation is non-cash, so a rental often shows a tax loss while cash-flowing — sheltering income. Rental losses are passive: they offset passive income freely, and up to $25,000/yr can offset ordinary (W-2) income if you actively participate and your MAGI is under $100k (phasing out to $0 by $150k); unused losses carry forward. On sale, claimed depreciation is recaptured at up to 25%, and gains may owe capital-gains tax (a 1031 exchange can defer both). Figures are a year-1 estimate at your 24.0% rate — not tax advice; consult a CPA.
Schools (NCES district)
- District
- Birmingham City
- NCES district ID
- 0100390
- Math proficiency
- 4% ▼ -17.00%
- Reading proficiency
- 20% ▼ -4.00%
- Median HH income
- $31,988
- Composite
- 9.49/100
- National rank
- #9850
- State rank
- #116 of 129 in AL
Livability — Birmingham
- Score
- 67/100
- State rank
- #78
- US rank
- #10412
Category grades
Schools grade is shown separately in the Schools card above.
Census & demographics
- Census place
- Birmingham, AL
- County
- Jefferson County · 527,445 people
- City population
- 210,422
- Metro
- Birmingham-Hoover, AL
- Population (ZIP)
- 20,526
- Household income
- $63,295
- Rent vs Own
- Severe rent burden
- 941.0
Population outlook (Jefferson County) Hauer SSP2
- Today (2025)
- 669,185 people
- By 2030
- 669,694 · +0.1%
- By 2040
- 661,388 · -1.2%
- By 2050
- 643,086 · -3.9%
- By 2075
- 577,267 · -13.7%
- By 2100
- 474,758 · -29.1%
Race, ethnicity, and origin ACS 2023
- Neighborhood character
- Majority Black (63%)
- Race & ethnicity
- Black 63% White 30% Two or more races 3% Asian 2% Hispanic / Latino 2%
- Common ancestry
- Slovak 2% Serbian 1% Italian 1%
- Foreign-born
- 3% · Canada
- Languages at home
- 96% English-only · Spanish 2% Other Asian/Pacific 1%
Political lean MEDSL · Jefferson
- 2024 margin
- D (+10.4) · D 54.6% · R 44.2% · Other 1.2%
- 2008→2024 swing
- +5.4pp toward D · 2008: 5.1pp · 2024: 10.4pp
- All cycles
- 2024: D+10.4 2020: D+13.2 2016: D+7.2 2012: D+6.0 2008: D+5.1
Not yet ingested
- Civics
- —
Market trends
- HPI YoY
- ▼ -54.62%
- Current HPI
- 204.6532
- Rent YoY
- ▲ 5.39%
- Metro
- Birmingham-Hoover, AL
- State GDP YoY
- ▲ 2.94%
- F500 in state
- 4
Industry mix (Fortune 500 HQ in AL)
| Industry | F500 HQs | Revenue |
|---|---|---|
| Financial Services | 1 | $8B |
|
||
| Healthcare | 1 | $5B |
|
||
Price history
+207.8% since first listed7 events — show timeline
- 2026-05-07 Price Changed $186,000 Greater Alabama MLS
- 2026-04-20 Listed $188,000 Greater Alabama MLS
- 2026-04-02 Sold (Public Records) $186,000 Public Records
- 2020-12-23 Sold (Public Records) $122,000 Public Records
- 2002-06-20 Sold (Public Records) $96,000 Public Records
- 1992-04-30 Sold (Public Records) $74,900 Public Records
- 1983-05-01 Sold (Public Records) $60,425 Public Records
Property tax history
+3.7%/yrLatest (2022): $849 · -50.7% YoY. Source: county tax records.
Cash-flow waterfall
monthlySold comps — $/sqft
last 12 mo · ≤1 miLoading sold comps…