4625 Bardstown Rd · Chaplin, KY
Flood risk 1/10 · Minimal
- FEMA flood zone
- X (unshaded)
- Chance of flooding over 30 yrs
- 0.0%
- Est. flood insurance / yr
- $507 – $1,088
Fire risk 4/10 · Minor
- Est. fire insurance / yr
- $839 – $1,559
Heat risk 4/10 · Minor
- Hot days now (above 103°F)
- 7 days/yr
- Hot days in 30 yrs
- 19 days/yr
Wind risk 2/10 · Minimal
- Chance of severe wind over 30 yrs
- 2.0%
Air-quality risk 2/10 · Minimal
- Unhealthy air days now
- 0 days/yr
- Unhealthy air days in 30 yrs
- 1 days/yr
Risk factors via First Street. Map © Google.
Why this score? — see what drove the C grade
The composite is a weighted blend of 9 inputs, each scored 0–100. Each bar is that input's sub-score; the figure is the points it added to the 100-point composite (weight × sub-score).
- Cash flow +26.1/30.0
- DSCR +8.8/10.0
- ARV discount +7.5/15.0
- 1% rule +5.8/10.0
- Schools +3.2/10.0
- Livability +2.8/5.0
- Rent growth +2.5/5.0
- Condition / age +2.5/5.0
- Appreciation +0.0/10.0
$135,000
🖨 Deal sheet 📄 Offer letter ✓ Due diligence
Listing remarks
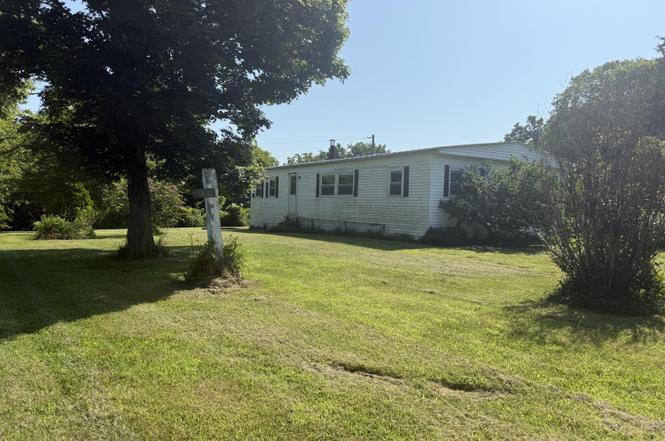
Excellent investment and Fixer Upper Opportunity! Right on the Bourbon Trail could make a great VRBO. This manufactured home needs a little TLC but sits perfectly on almost 2 picturesque acres in Anderson County only minutes from Taylorsville Lake, Willisburg Lake & Beaver Lake. The home offers 3BR, 2BA with a large living room, kitchen, washer/dryer hookup and 1.5 car garage with concrete flooring and electricity. Utilities available are electric and city water but not currently on. Home is heated by wood stove and sellers used window units. Please be cautionary on the deck and around the above ground pool!! Selling 'AS IS'. Buyer would need to install a septic tank. No sewer system
Key facts
- Beaver lake
- Wood stove
- Above ground pool
Tags
Property features AI
Finance
- Other: Property sits on about 1.99 acres (public records)
Exterior
- Parking: Detached garage; Driveway
- Utilities: Public water source; No sewer service listed
- Home design: Single-story home
- Construction: Aluminum siding; Block foundation; Metal roof; Built area approximately 1,232 (building area total)
- Exterior features: Rural view; Public water
Interior
- Kitchen: Refrigerator; Range
- Bedrooms: 2 total rooms (includes bedrooms and other rooms)
- Flooring: Wood floors
- Bathrooms: 2 full bathrooms
- Heating & cooling: Wood stove heating
- Interior features: Primary bedroom on the first floor; Ceiling fans; Fireplace; Blinds on the windows
- Laundry & utility: Washer hookup; Electric dryer hookup
Neighborhood map
What this means for you Summary
Snapshot
- This is a 3-bed/2.0-bath single-family listed at $135k.
Deal economics
- At list price, monthly cash flow is $341 ($4k/yr) — positive.
- The deal already cash-flows at list — no discount required.
- Meets the 1% rule at list price ($1k rent vs $135k).
- Recommended offer: $119k (12.0% below list) — sets the bar for market timing.
Location & tenants
- Location reads 56/100 on livability (#455 in KY) — a working-class tenant base; expect higher turnover. Strengths: cost of living A+, housing A+; Watch: amenities F, commute F, health & safety F.
- Anderson County (town): math 32% / reading 41% proficiency, ranked #46 of 165 in KY (top 28%) — families likely to look elsewhere, expect single-tenant / working-renter base with shorter leases.
- Zoned schools: Robert B. Turner Elementary School (math 46% / reading 43%, grade F, #148 of 676 statewide, top 24%, 534 students, 40% FRL); Anderson County Middle School (math 28% / reading 45%, grade F, #90 of 217 statewide, top 41%, 818 students, 46% FRL); Anderson County High School (math 37% / reading 42%, grade F, #40 of 254 statewide, top 19%, 1,189 students, 40% FRL) — zoned schools at 42% FRL track the district average.
- Market conditions: 222 active listings in the ZIP; 72 units permitted in Anderson County in 2024 (0 in 5+ unit buildings).
Forward outlook
- Local home prices are declining (-3.0%/yr); year-one equity from $933 of loan paydown is wiped out by about $4k of value loss. Plan a longer hold.
Negotiation context
- It's been on market 353 days — a 12% lower offer ($119k) is reasonable based on typical stale-listing flexibility.
- 2 sale attempts with the ask held roughly flat each time — persistent listings suggest the price (not the market) is what's stuck; bring a comps-based counter.
- Current owner paid $42k; list at $135k implies a 221% gain — meaningful room to come down on a strong offer.
Questions for the listing agent
- It's been on market 353 days. Have you received any prior offers? Is the seller open to a 12% concession, seller financing, or rate buy-down credit?
- Built in 1974 — when were the roof, HVAC, electrical panel, plumbing, and water heater last replaced?
- Why hasn't it sold? Are there any deal-killer items the seller is aware of (foundation, flood, title, zoning, code violations)?
- Is there a deadline driving the sale (1031 exchange, divorce, estate, relocation)? That informs how much negotiation room exists.
- Schools are F-rated, which usually means shorter tenancies and higher turnover. Who's the typical renter profile here, and what's been the actual vacancy rate?
- What's the average days-on-market for RENTAL listings here right now (not sales)? A rising rental-DOM trend means longer vacancies and softer asking-rent achievability than the comps imply.
- What's the recent tenant-quality profile in this submarket — average credit score on applications, eviction rate, late-payment / NSF rate, and stable-employment percentage? A property-management company in the area should have these aggregated.
- How much new for-sale + rental construction is in the pipeline within 1–3 miles? Heavy new supply typically softens prices + rents 12–24 months out; constrained supply supports both.
Investment metrics
- 1% rule
- 1.08% ✓
- Cap rate
- 9.32%
- Cash-on-cash
- 10.82%
- DSCR
- 1.48
- GRM
- 7.7
CMA / ARV
No comps found within radius.
Projected returns pro-forma
-3.0% appreciation · 3.0% rent growth · sell at horizon
- IRR
- -0.1%
- Equity multiple
- 0.99×
- Total profit
- $-214
- Equity at exit
- $20,129
- IRR
- 9.5%
- Equity multiple
- 1.73×
- Total profit
- $27,560
- Equity at exit
- $11,672
Cash invested: $37,800 (down + closing). Projections, not guarantees.
Landlord ↔ Tenant lean methodology
- Overall (STATE)
- 83 Strongly Landlord-Friendly
- State Kentucky
- 83 Strongly Landlord-Friendly · R+16
- County
- — inherits STATE
- City
- — inherits STATE
ZIP-level market 40342
- Home prices YoY
- -14.5%
- Active inventory
- 222
- Price-to-rent
- 7.7×
Monthly cashflow live
- Estimated rent
- $1,459 medium interval (Pro) →
- Mortgage (P&I)
- −$708
- Tax from tax record
- −$47 /mo · $568/yr
- Insurance
- −$56
- HOA
- −$0
- Vacancy / Maint / Mgmt
- −$306
- Net cashflow
- $341
Break-even live
UW: 25.0% down · 7.5% · 30yr · 1.5% tax · 5.0% vac · 8.0% maint · 8.0% mgmt
Financing live
Cash to close
- Down payment
- $33,750
- Closing costs
- $4,050
- Reserves months
- —
- Total cash needed
- —
Loan-product check · same deal, 3 products live
Conventional
25% down · 7.5% · 30yr
- Down + closing
- —
- Monthly P&I
- —
- Monthly cashflow
- —
- DSCR
- —
- Eligible?
- —
Personal DTI + credit; lowest rate.
DSCR
20% down · 8.5% · 30yr
- Down + closing
- —
- Monthly P&I
- —
- Monthly cashflow
- —
- DSCR
- —
- Eligible?
- —
No personal income docs; deal must DSCR.
Hard money
10% down · 12.0% · 12mo
- Down + closing
- —
- Monthly P&I
- —
- Monthly cashflow
- —
- DSCR
- —
- Eligible?
- —
Short-term bridge; refi at stabilization.
Listing history 21 events
-
2026-06-19days on market $135,000 Active 353 DOM
-
2026-06-18days on market $135,000 Active 352 DOM
-
2026-06-17days on market $135,000 Active 351 DOM
-
2026-06-16days on market $135,000 Active 350 DOM
-
2026-06-15days on market $135,000 Active 349 DOM
-
2026-06-14days on market $135,000 Active 347 DOM
-
2026-06-12days on market $135,000 Active 346 DOM
-
2026-06-09days on market $135,000 Active 343 DOM
-
2026-06-08days on market $135,000 Active 342 DOM
-
2026-06-07days on market $135,000 Active 341 DOM
-
2026-06-05days on market $135,000 Active 338 DOM
-
2026-06-03days on market $135,000 Active 337 DOM
-
2026-06-02days on market $135,000 Active 336 DOM
-
2026-06-01days on market $135,000 Active 335 DOM
-
2026-05-31days on market $135,000 Active 334 DOM
-
2026-05-30days on market $135,000 Active 333 DOM
-
2025-12-28status Active
-
2025-12-21historical
-
2025-11-20price $135,000
-
2025-06-24$140,000 Active
-
1995-04-01soldstatus $42,000
ⓘ Source: listings_history table (triggers on properties + properties_extension) + one-shot
backfill from property_details.listing_events for pre-trigger history.
Tax reassessment forecast KY · Resets to sale price
- Current annual tax
- $568 · $47/mo
- Projected year-2 tax
- $1,161 · $97/mo
- Expected delta
- +$593/yr (+$49/mo · 104.5%)
ⓘ Screening estimate from a state-policy table — verify with the county assessor before closing.
Climate risk First Street
- Flood 1/10 Low FEMA zone X (unshaded) · 0% chance over 30 yrs
- Wildfire 4/10 Moderate
- Heat 4/10 Moderate 7 d/yr ≥103°F today · 19 d/yr by 30 yrs out
- Wind 2/10 Low 2% chance of damaging wind over 30 yrs
- Air quality 2/10 Low 0 unhealthy d/yr today · 1 by 30 yrs out
Nearby sold comps map
Loading sold comps map…
Walkable amenities ~0.75 mi
Loading nearby amenities…
Taxation est. · year 1
- Rental income
- $17,505
- − Mortgage interest
- −$7,562
- − Property taxes
- −$568
- − Insurance
- −$675
- − Repairs & maintenance
- −$1,400
- − Management
- −$1,400
- − Depreciation
- −$3,927
- Taxable income
- $1,973
- Est. tax owed @ 24.0%
- −$473
- After-tax cash flow
- $3,618/yr
For passive investors: Depreciation is non-cash, so a rental often shows a tax loss while cash-flowing — sheltering income. Rental losses are passive: they offset passive income freely, and up to $25,000/yr can offset ordinary (W-2) income if you actively participate and your MAGI is under $100k (phasing out to $0 by $150k); unused losses carry forward. On sale, claimed depreciation is recaptured at up to 25%, and gains may owe capital-gains tax (a 1031 exchange can defer both). Figures are a year-1 estimate at your 24.0% rate — not tax advice; consult a CPA.
Schools (NCES district)
- District
- Anderson County
- NCES district ID
- 2100120
- Math proficiency
- 32% ▼ -12.00%
- Reading proficiency
- 41% ▼ -13.00%
- Median HH income
- $52,090
- Composite
- 31.76/100
- National rank
- #5898
- State rank
- #46 of 165 in KY
Livability — Chaplin
- Score
- 56/100
- State rank
- #455
- US rank
- #22519
Category grades
Schools grade is shown separately in the Schools card above.
Census & demographics
- Population (ZIP)
- 23,739
Population outlook (Anderson County) Hauer SSP2
- Today (2025)
- 23,016 people
- By 2030
- 23,318 · +1.3%
- By 2040
- 23,533 · +2.2%
- By 2050
- 23,119 · +0.4%
- By 2075
- 21,631 · -6.0%
- By 2100
- 19,180 · -16.7%
Race, ethnicity, and origin ACS 2023
- Neighborhood character
- Predominantly White (92%)
- Race & ethnicity
- White 92% Two or more races 3% Black 3% Hispanic / Latino 2%
- Common ancestry
- Lithuanian 3% Slovak 2% Serbian 2%
- Foreign-born
- 1% · Canada, Jamaica
- Languages at home
- 98% English-only · Spanish 1%
Political lean MEDSL · Anderson
- 2024 margin
- Solid R (+49.1) · D 24.6% · R 73.7% · Other 1.6%
- 2008→2024 swing
- -16.6pp toward R · 2008: -32.4pp · 2024: -49.1pp
- All cycles
- 2024: R+49.1 2020: R+47.6 2016: R+49.1 2012: R+34.0 2008: R+32.4
Not yet ingested
- Civics
- —
Market trends
- HPI YoY
- ▼ -45.14%
- Current HPI
- 265.9883
- Rent YoY
- —
- Metro
- —
- State GDP YoY
- ▲ 1.81%
- F500 in state
- 4
Industry mix (Fortune 500 HQ in KY)
| Industry | F500 HQs | Revenue |
|---|---|---|
| Healthcare | 1 | $118B |
|
||
| Food / Beverage | 1 | $7B |
|
||
Price history
+221.4% since first listed5 events — show timeline
- 2025-12-28 Relisted — ImagineMLS
- 2025-12-21 Listing Removed — ImagineMLS
- 2025-11-20 Price Changed $135,000 ImagineMLS
- 2025-06-24 Listed $140,000 ImagineMLS
- 1995-04-01 Sold (Public Records) $42,000 Public Records
Property tax history
+0.3%/yrLatest (2025): $568 · +0.3% YoY. Source: county tax records.
Cash-flow waterfall
monthlySold comps — $/sqft
last 12 mo · ≤1 miLoading sold comps…