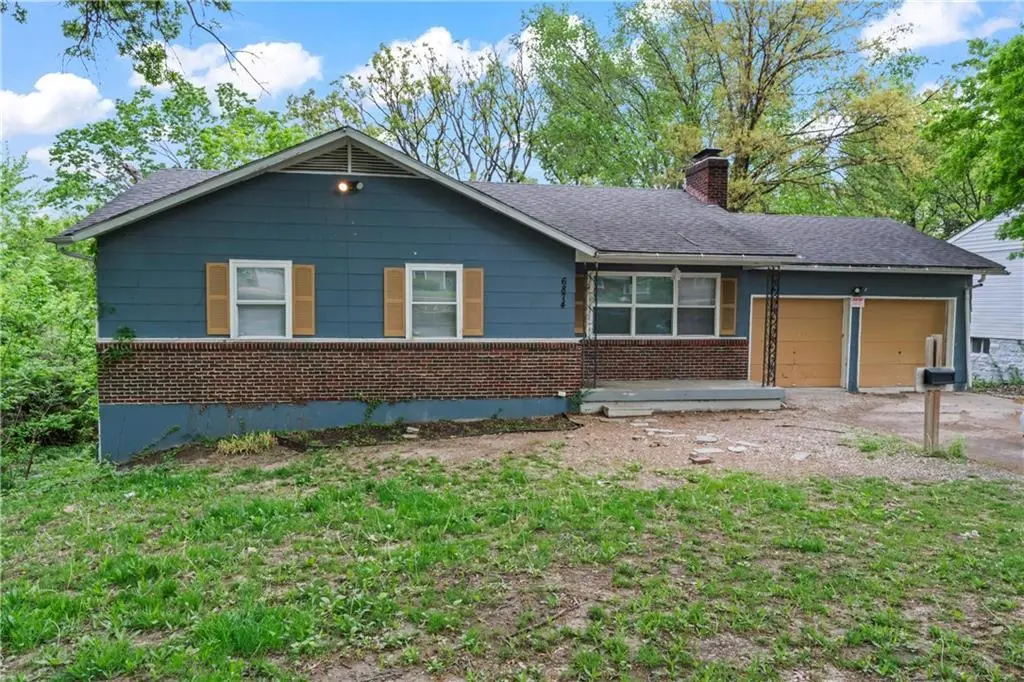
6874 Sni A Bar Rd · Kansas City, MO
Flood risk 1/10 · Minimal
- FEMA flood zone
- X (unshaded)
- Chance of flooding over 30 yrs
- 0.0%
- Est. flood insurance / yr
- $473 – $860
Fire risk 1/10 · Minimal
- Est. fire insurance / yr
- $1,054 – $1,958
Heat risk 4/10 · Minor
- Hot days now (above 107°F)
- 7 days/yr
- Hot days in 30 yrs
- 15 days/yr
Wind risk 2/10 · Minimal
- Chance of severe wind over 30 yrs
- —
Air-quality risk 3/10 · Minor
- Unhealthy air days now
- 3 days/yr
- Unhealthy air days in 30 yrs
- 5 days/yr
Risk factors via First Street. Map © Google.
Why this score? — see what drove the F grade
The composite is a weighted blend of 9 inputs, each scored 0–100. Each bar is that input's sub-score; the figure is the points it added to the 100-point composite (weight × sub-score).
- Cash flow +7.4/30.0
- Livability +3.9/5.0
- Rent growth +2.5/5.0
- Condition / age +2.5/5.0
- Schools +1.8/10.0
- 1% rule +1.5/10.0
- DSCR +1.5/10.0
- ARV discount +0.0/15.0
- Appreciation +0.0/10.0
$195,950
🖨 Deal sheet 📄 Offer letter ✓ Due diligence
Listing remarks MLS
Check out this KCMO walkout, main level has 3 bedroom, 2 bath plus a 2 car garage, with a massive partial finished basement, situated on an oversized lot. The kitchen features tile floor, painted cabinets, granite countertops, and a tile backsplash. Both bathrooms offer solid surface vanities and tile showers. The basement provides a rec room, and additional non-conforming bedrooms. Fresh interior paint throughout!
Key facts
- Tile floor
- Painted cabinets
- Unfinished basement
Tags
Neighborhood map
What this means for you Summary
Snapshot
- This is a 2-bed/1.0-bath single-family listed at $196k.
Deal economics
- At list price, monthly cash flow is $-254 ($-3k/yr) — negative.
- To cash-flow at today's rent, offer at most $151k (22.9% below list).
- To meet the 1% rule (rent ≥ 1% of price), the offer needs to be $128k (34.8% below list).
- Recommended offer: $128k (34.8% below list) — sets the bar for 1% rule.
- Cap rate 4.7% vs local median 3.9% in Kansas City — meaningfully above typical; check what's discounted (condition, days-on-market, listing class) to confirm the premium yield is real.
Location & tenants
- Location reads 78/100 on livability (#28 in MO, #2,671 nationally) — a middle-class / working-renter tenant base. Strengths: amenities A+, commute A+, cost of living A+; Watch: schools C-, crime F.
- Raytown C-2 (suburban): math 12% / reading 28% proficiency, ranked #302 of 324 in MO (top 93%) — low school quality limits family demand, transient renter base, plan for 1-2y turnover.
- Market conditions: 52 active listings in the ZIP; 11 comparable units currently listed for rent nearby; rentals leasing fast (median 12d on market — plan ~1-2 weeks tenant-placement turnaround); 4,002 units permitted in Jackson County in 2024 (2,271 in 5+ unit buildings).
Forward outlook
- Local home prices are declining (-3.0%/yr); year-one equity from $1k of loan paydown is wiped out by about $6k of value loss. Plan a longer hold.
- Jackson County population projected at +4% by 2050 — modest demand growth; plan on rents tracking national, not racing it.
Negotiation context
- It's been on market 102 days — a 9% lower offer ($178k) is reasonable based on typical stale-listing flexibility.
- 5 sale attempts since 20y ago; this cycle's ask has dropped $14k (7%) from the opening price — seller is motivated, your offer sets the floor, not the list.
Questions for the listing agent
- What do current leases actually rent for vs. the listed asking? Can we see a recent rent roll and the last 12 months of T-12 income?
- It's been on market 102 days. Have you received any prior offers? Is the seller open to a 35% concession, seller financing, or rate buy-down credit?
- Built in 1962 — when were the roof, HVAC, electrical panel, plumbing, and water heater last replaced?
- Why hasn't it sold? Are there any deal-killer items the seller is aware of (foundation, flood, title, zoning, code violations)?
- Is there a deadline driving the sale (1031 exchange, divorce, estate, relocation)? That informs how much negotiation room exists.
- Crime grade is F in this area — have there been break-ins, vandalism, or insurance claims at this property in the last 3 years? What carrier currently insures it and at what premium?
- The area grade is low — what's the realistic commute time and amenity access for the typical tenant pool here? Any planned neighborhood developments (good or bad) we should know about?
- What's the average days-on-market for RENTAL listings here right now (not sales)? A rising rental-DOM trend means longer vacancies and softer asking-rent achievability than the comps imply.
- What's the recent tenant-quality profile in this submarket — average credit score on applications, eviction rate, late-payment / NSF rate, and stable-employment percentage? A property-management company in the area should have these aggregated.
- How much new for-sale + rental construction is in the pipeline within 1–3 miles? Heavy new supply typically softens prices + rents 12–24 months out; constrained supply supports both.
Investment metrics
- 1% rule
- 0.65% ✗
- Cap rate
- 4.74%
- Cash-on-cash
- -5.55%
- DSCR
- 0.75
- GRM
- 12.8
CMA / ARV
- ARV (median comp)
- $155,594
- List price
- $195,950
- Delta
- 25.94%
- Verdict
- OVERPRICED
- Comps
- 10 within 1.0 mi
Show comp detail 12 sales within ~0.75 mi
| Address | Dist | Beds/Ba | Sqft | Sold | Price | $/sf | Match |
|---|---|---|---|---|---|---|---|
| 6876 Sni A Bar Rd | 0.01mi | 3/1.5 (+1) | 1,160 (+1%) | 1mo | $145,000 | $125 | 90 |
| 4748 Eastern Ave | 0.36mi | 2/1.0 | 1,204 (+5%) | 8mo | $79,000 | $66 | 68 |
| 5024 Glenside Dr | 0.30mi | 3/1.0 (+1) | 1,207 (+5%) | 11mo | $140,000 | $116 | 64 |
| 7504 E 49th St | 0.42mi | 3/2.0 (+1) | 1,152 (+0%) | 12mo | $110,000 | $95 | 60 |
| 7500 E 49th St | 0.40mi | 3/2.0 (+1) | 1,152 (+0%) | 14mo | $190,000 | $165 | 60 |
| 7605 Sni A Bar Ter | 0.62mi | 3/1.0 (+1) | 1,112 (-3%) | 7mo | $180,000 | $162 | 56 |
| 7725 E 51st St | 0.63mi | 3/1.0 (+1) | 1,128 (-2%) | 10mo | $134,900 | $120 | 54 |
| 5086 Glenside Dr | 0.37mi | 3/2.0 (+1) | 1,185 (+3%) | 19mo | $160,000 | $135 | 53 |
| 7723 Sni-a-bar Rd | 0.74mi | 3/1.0 (+1) | 1,262 (+10%) | 1mo | $125,000 | $99 | 43 |
| 7622 Sni a Bar Rd | 0.66mi | 3/1.0 (+1) | 1,008 (-12%) | 6mo | $130,000 | $129 | 39 |
| 7802 E 49th St | 0.66mi | 3/3.0 (+1) | 1,199 (+4%) | 13mo | $142,000 | $118 | 38 |
| 7815 Ozark Rd | 0.68mi | 2/3.0 | 1,041 (-9%) | 15mo | $99,000 | $95 | 33 |
Match score weights: distance 35% · size 25% · config 20% · recency 20%. Top-matched comps best support the ARV.
Projected returns pro-forma
-3.0% appreciation · 3.0% rent growth · sell at horizon
- IRR
- -25.8%
- Equity multiple
- 0.13×
- Total profit
- $-47,962
- Equity at exit
- $29,217
- IRR
- -22.5%
- Equity multiple
- -0.14×
- Total profit
- $-62,738
- Equity at exit
- $16,942
Cash invested: $54,866 (down + closing). Projections, not guarantees.
Landlord ↔ Tenant lean methodology
- Overall (STATE)
- 81 Strongly Landlord-Friendly
- State Missouri
- 81 Strongly Landlord-Friendly · R+10
- County
- — inherits STATE
- City
- — inherits STATE
ZIP-level market 64129
- Home prices YoY
- -9.8%
- Active inventory
- 52
- Price-to-rent
- 12.8×
Monthly cashflow live
- Estimated rent
- $1,277 high interval (Pro) →
- Mortgage (P&I)
- −$1,028
- Tax from tax record
- −$154 /mo · $1,846/yr
- Insurance
- −$82
- HOA
- −$0
- Vacancy / Maint / Mgmt
- −$268
- Net cashflow
- $-254
Break-even live
UW: 25.0% down · 7.5% · 30yr · 1.5% tax · 5.0% vac · 8.0% maint · 8.0% mgmt
Financing live
Cash to close
- Down payment
- $48,988
- Closing costs
- $5,878
- Reserves months
- —
- Total cash needed
- —
Loan-product check · same deal, 3 products live
Conventional
25% down · 7.5% · 30yr
- Down + closing
- —
- Monthly P&I
- —
- Monthly cashflow
- —
- DSCR
- —
- Eligible?
- —
Personal DTI + credit; lowest rate.
DSCR
20% down · 8.5% · 30yr
- Down + closing
- —
- Monthly P&I
- —
- Monthly cashflow
- —
- DSCR
- —
- Eligible?
- —
No personal income docs; deal must DSCR.
Hard money
10% down · 12.0% · 12mo
- Down + closing
- —
- Monthly P&I
- —
- Monthly cashflow
- —
- DSCR
- —
- Eligible?
- —
Short-term bridge; refi at stabilization.
Rent comps 11 comps
| Address | Beds | Baths | Sqft | Rent | $/sqft | DOM | Units | Dist |
|---|---|---|---|---|---|---|---|---|
| 4730 Richmond Ave Kansas City, MO | 3.0 | 1.0 | 821 | $1,395 | $1.70 | 43d | 1 | 0.47mi |
| 7611 E 47th Ter Kansas City, MO | 3.0 | 1.0 | 840 | $1,276 | $1.52 | 7d | 1 | 0.52mi |
| 7615 E 49th St Kansas City, MO | 2.0 | 1.0 | 888 | $1,095 | $1.23 | 43d | 1 | 0.57mi |
| 7601 Sni a Bar Ter Kansas City, MO | 2.0 | 1.0 | 827 | $1,099 | $1.33 | 43d | 1 | 0.58mi |
| 5126 Booth Ave Kansas City, MO | 2.0 | 1.0 | 950 | $1,149 | $1.21 | 12d | 1 | 1.09mi |
| 8648 E 52nd Ter Kansas City, MO | 3.0 | 1.5 | 1224 | $1,395 | $1.14 | 23d | 1 | 1.30mi |
| 5707 E 40th St Kansas City, MO | 3.0 | 1.0 | 816 | $1,295 | $1.59 | 11d | 1 | 1.36mi |
| 5636 E 40th St Kansas City, MO | 3.0 | 1.0 | 816 | $1,225 | $1.50 | 2d | 1 | 1.38mi |
| 5700 E 40th St Kansas City, MO | 3.0 | 1.0 | 816 | $1,245 | $1.53 | 21d | 1 | 1.38mi |
| 5601 E 39th Ter Kansas City, MO | 3.0 | 1.0 | 816 | $1,225 | $1.50 | 2d | 1 | 1.42mi |
| 3911 Oakley Ave Kansas City, MO | 2.0 | 1.0 | 816 | $1,195 | $1.46 | 12d | 1 | 1.49mi |
Listing history 27 events
-
2026-06-18days on market $195,950 Active 102 DOM
-
2026-06-17days on market $195,950 Active 101 DOM
-
2026-06-16days on market $195,950 Active 100 DOM
-
2026-06-15days on market $195,950 Active 99 DOM
-
2026-06-13days on market $195,950 Active 97 DOM
-
2026-06-13days on market $195,950 Active 96 DOM
-
2026-06-09days on market $195,950 Active 93 DOM
-
2026-06-08days on market $195,950 Active 92 DOM
-
2026-06-07days on market $195,950 Active 91 DOM
-
2026-06-03days on market $195,950 Active 87 DOM
-
2026-06-02days on market $195,950 Active 86 DOM
-
2026-06-01days on market $195,950 Active 85 DOM
-
2026-05-31days on market $195,950 Active 84 DOM
-
2026-03-02$210,000 Active 418-char remark
Show marketing remark (418 chars)
Check out this KCMO walkout, main level has 3 bedroom, 2 bath plus a 2 car garage, with a massive partial finished basement, situated on an oversized lot. The kitchen features tile floor, painted cabinets, granite countertops, and a tile backsplash. Both bathrooms offer solid surface vanities and tile showers. The basement provides a rec room, and additional non-conforming bedrooms. Fresh interior paint throughout!
-
2022-02-25price $1,345
-
2021-12-17soldstatus
-
2021-10-30historical
-
2021-10-20status Active
-
2021-09-24status Pending
-
2021-09-21price $169,900
-
2021-09-15$174,900 Active
-
2021-04-08soldstatus
-
2020-02-03soldstatus
-
2014-05-05soldstatus
-
2014-03-17$16,900
-
2006-07-15$122,900
-
1989-08-30soldstatus
ⓘ Source: listings_history table (triggers on properties + properties_extension) + one-shot
backfill from property_details.listing_events for pre-trigger history.
Tax reassessment forecast MO · Resets to sale price
- Current annual tax
- $1,846 · $154/mo
- Projected year-2 tax
- $1,901 · $158/mo
- Expected delta
- +$54/yr (+$5/mo · 2.9%)
ⓘ Screening estimate from a state-policy table — verify with the county assessor before closing.
Climate risk First Street
- Flood 1/10 Low FEMA zone X (unshaded) · 0% chance over 30 yrs
- Wildfire 1/10 Low
- Heat 4/10 Moderate 7 d/yr ≥107°F today · 15 d/yr by 30 yrs out
- Wind 2/10 Low
- Air quality 3/10 Moderate 3 unhealthy d/yr today · 5 by 30 yrs out
Nearby sold comps map
Loading sold comps map…
Walkable amenities ~0.75 mi
Loading nearby amenities…
Taxation est. · year 1
- Rental income
- $15,329
- − Mortgage interest
- −$10,976
- − Property taxes
- −$1,846
- − Insurance
- −$980
- − Repairs & maintenance
- −$1,226
- − Management
- −$1,226
- − Depreciation
- −$5,700
- Taxable loss
- −$6,626
- Est. tax savings @ 24.0%
- +$1,590
- After-tax cash flow
- $-1,457/yr
For passive investors: Depreciation is non-cash, so a rental often shows a tax loss while cash-flowing — sheltering income. Rental losses are passive: they offset passive income freely, and up to $25,000/yr can offset ordinary (W-2) income if you actively participate and your MAGI is under $100k (phasing out to $0 by $150k); unused losses carry forward. On sale, claimed depreciation is recaptured at up to 25%, and gains may owe capital-gains tax (a 1031 exchange can defer both). Figures are a year-1 estimate at your 24.0% rate — not tax advice; consult a CPA.
Schools (NCES district)
- District
- Raytown C-2
- NCES district ID
- 2926070
- Math proficiency
- 12% ▼ -11.00%
- Reading proficiency
- 28% ▼ -9.00%
- Median HH income
- $47,215
- Composite
- 17.59/100
- National rank
- #9039
- State rank
- #302 of 324 in MO
Livability — Kansas City
- Score
- 78/100
- State rank
- #28
- US rank
- #2671
Category grades
Schools grade is shown separately in the Schools card above.
Census & demographics
- Census place
- Kansas City, MO
- County
- Jackson County · 687,798 people
- City population
- 439,467
- Metro
- Kansas City, MO-KS
- Population (ZIP)
- 9,267
- Household income
- $51,310
- Rent vs Own
- Severe rent burden
- 349.0
Population outlook (Jackson County) Hauer SSP2
- Today (2025)
- 719,589 people
- By 2030
- 731,456 · +1.6%
- By 2040
- 746,689 · +3.8%
- By 2050
- 749,289 · +4.1%
- By 2075
- 736,227 · +2.3%
- By 2100
- 668,210 · -7.1%
Race, ethnicity, and origin ACS 2023
- Neighborhood character
- Diverse neighborhood (Simpson 0.65)
- Race & ethnicity
- Black 45% White 37% Hispanic / Latino 11% Two or more races 9%
- Hispanic origin (detail)
- Mexican 6%
- Common ancestry
- Lithuanian 4% Italian 2% Armenian 1%
- Foreign-born
- 8% · Canada
- Languages at home
- 87% English-only · Spanish 8% Arabic 1%
Political lean MEDSL · Jackson
- 2024 margin
- D (+19.3) · D 58.9% · R 39.5% · Other 1.6%
- 2008→2024 swing
- -6.1pp toward R · 2008: 25.4pp · 2024: 19.3pp
- All cycles
- 2024: D+19.3 2020: D+22.0 2016: D+16.6 2012: D+19.0 2008: D+25.4
Not yet ingested
- Civics
- —
Market trends
- HPI YoY
- ▼ -32.25%
- Current HPI
- 297.5233
- Rent YoY
- —
- Metro
- Kansas City, MO-KS
- State GDP YoY
- ▲ 1.84%
- F500 in state
- 20
Industry mix (Fortune 500 HQ in MO)
| Industry | F500 HQs | Revenue |
|---|---|---|
| Healthcare | 1 | $163B |
|
||
| Insurance | 1 | $21B |
|
||
| Industrial Technology | 1 | $17B |
|
||
| Retail | 1 | $16B |
|
||
| Industrial Distribution | 1 | $10B |
|
||
| Utilities | 1 | $9B |
|
||
Price history
+70.9% since first listed14 events — show timeline
- 2026-03-02 Listed $210,000 Heartland MLS as Distributed by MLS Grid
- 2022-02-25 Price Changed $1,345 RENT.
- 2021-12-17 Sold (Public Records) — Public Records
- 2021-10-30 Listing Removed — Heartland MLS as Distributed by MLS Grid
- 2021-10-20 Relisted — Heartland MLS as Distributed by MLS Grid
- 2021-09-24 Pending — Heartland MLS as Distributed by MLS Grid
- 2021-09-21 Price Changed $169,900 Heartland MLS as Distributed by MLS Grid
- 2021-09-15 Listed $174,900 Heartland MLS as Distributed by MLS Grid
- 2021-04-08 Sold (Public Records) — Public Records
- 2020-02-03 Sold (Public Records) — Public Records
- 2014-05-05 Sold (MLS) — Heartland MLS as Distributed by MLS Grid
- 2014-03-17 Listed $16,900 Heartland MLS as Distributed by MLS Grid
- 2006-07-15 Listed $122,900 Heartland MLS as Distributed by MLS Grid
- 1989-08-30 Sold (Public Records) — Public Records
Property tax history
+1.3%/yrLatest (2025): $1,846 · -42.3% YoY. Source: county tax records.
Cash-flow waterfall
monthlySold comps — $/sqft
last 12 mo · ≤1 miLoading sold comps…