 Duplex
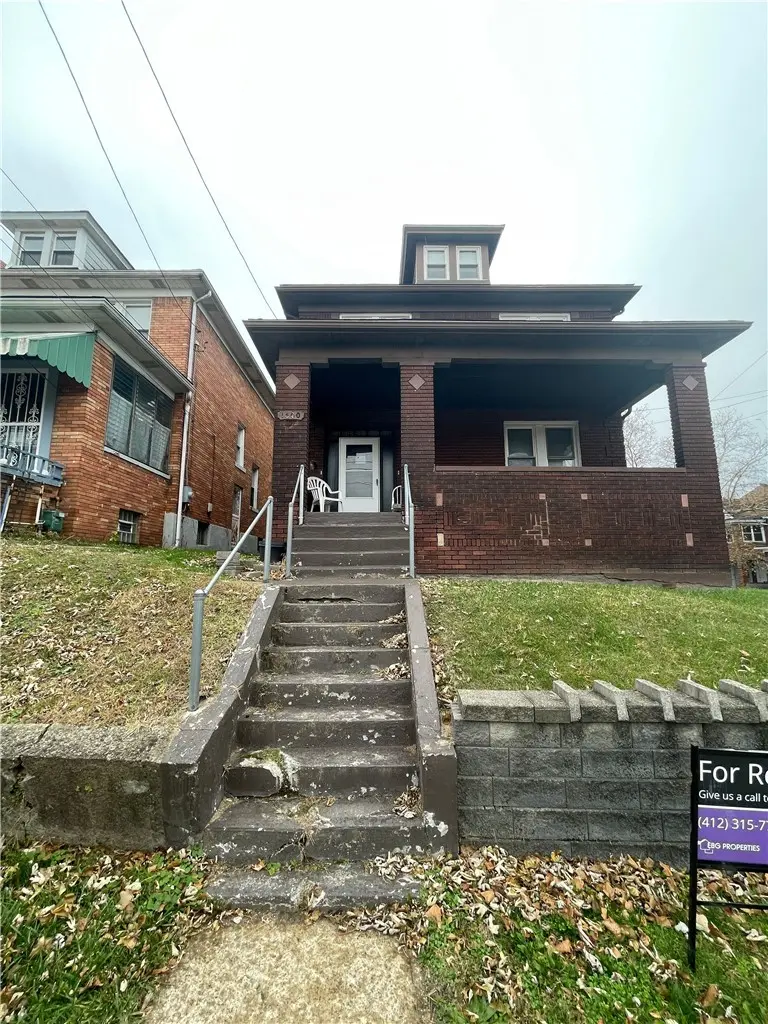
1600 Mcclure St · Homestead, PA
Flood risk 1/10 · Minimal
- FEMA flood zone
- X (unshaded)
- Chance of flooding over 30 yrs
- 0.0%
- Est. flood insurance / yr
- $473 – $860
Fire risk 1/10 · Minimal
- Est. fire insurance / yr
- $511 – $949
Heat risk 4/10 · Minor
- Hot days now (above 97°F)
- 7 days/yr
- Hot days in 30 yrs
- 18 days/yr
Wind risk 2/10 · Minimal
- Chance of severe wind over 30 yrs
- 0.0%
Air-quality risk 4/10 · Minor
- Unhealthy air days now
- 4 days/yr
- Unhealthy air days in 30 yrs
- 5 days/yr
Risk factors via First Street. Map © Google.
Why this score? — see what drove the B- grade
The composite is a weighted blend of 9 inputs, each scored 0–100. Each bar is that input's sub-score; the figure is the points it added to the 100-point composite (weight × sub-score).
- Cash flow +30.0/30.0
- 1% rule +10.0/10.0
- DSCR +10.0/10.0
- ARV discount +5.2/15.0
- Livability +3.9/5.0
- Rent growth +3.5/5.0
- Schools +3.1/10.0
- Condition / age +2.5/5.0
- Appreciation +0.0/10.0
$130,000
🖨 Deal sheet 📄 Offer letter ✓ Due diligence
Multi-family units
County records classify this as Multi-Family (2-4 Unit). Listing-text estimate: 2 units. confirmed
Listing remarks MLS
Welcome to 1600 McClure. This fully occupied duplex in Homestead is ready for a new investor to add to or expand their portfolio. This property is 2 - 1 bed 1 bath units and is fully occupied. Both units are in mid/low grade rental status but could be updated for higher rents.
Key facts
- 2,278 sq ft lot
- 2 parking spots
- Built 1930
Neighborhood map
What this means for you Summary
Snapshot
- This is a 2 × 1-bed/1-bath units multifamily listed at $130k.
Deal economics
- At list price, monthly cash flow is $835 ($10k/yr) — positive. Per door: $418/mo.
- The deal already cash-flows at list — no discount required.
- Meets the 1% rule at list price ($2k rent vs $130k).
- Recommended offer: $122k (6.0% below list) — sets the bar for market timing.
Location & tenants
- Location reads 77/100 on livability (#366 in PA, #3,204 nationally) — a middle-class / working-renter tenant base. Strengths: amenities A+, commute A+, cost of living A+; Watch: schools F, crime F, employment F.
- Steel Valley SD (suburban): math 29% / reading 45% proficiency, ranked #403 of 539 in PA (top 75%) — families likely to look elsewhere, expect single-tenant / working-renter base with shorter leases.
- Market conditions: Rents rising fast (+4.1%/yr); 92 active listings in the ZIP; 11 comparable units currently listed for rent nearby; rentals at typical pace (median 24d on market — plan ~3-4 weeks tenant-placement turnaround); 2,996 units permitted in Allegheny County in 2024 (1,588 in 5+ unit buildings).
- At $2,185/mo this rent would consume 47% of the median local household income ($56k/yr) (locally 669% of renters already pay >50% of income on rent) — very limited rent-growth headroom before tenants either downsize or default.
Forward outlook
- Local home prices are declining (-3.0%/yr); year-one equity from $899 of loan paydown is wiped out by about $4k of value loss. Plan a longer hold.
- At projected returns (-3.0% appreciation + 4.1% rent growth), your $36k cash investment doubles in ~5 years — after that, you're playing with house money.
Negotiation context
- It's been on market 86 days — a 6% lower offer ($122k) is reasonable based on typical stale-listing flexibility.
- 6 sale attempts since 4y ago with the ask held roughly flat each time — persistent listings suggest the price (not the market) is what's stuck; bring a comps-based counter.
- Current owner paid $110k; 18% above their basis — modest negotiation headroom, anchor on the comps not their cost.
Risks & watch-outs
- Watch-outs: built in 1930 — expect roof / HVAC / electrical / plumbing capex.
Questions for the listing agent
- It's been on market 86 days. Have you received any prior offers? Is the seller open to a 6% concession, seller financing, or rate buy-down credit?
- Can we see the unit-by-unit rent roll, current vacancy, and any below-market leases? What's the average tenancy length?
- What capital expenditures (roof, boiler, parking lot, exteriors) have been made in the last 5 years, and what's planned in the next 2?
- Built in 1930 — when were the roof, HVAC, electrical panel, plumbing, and water heater last replaced?
- Why hasn't it sold? Are there any deal-killer items the seller is aware of (foundation, flood, title, zoning, code violations)?
- Is there a deadline driving the sale (1031 exchange, divorce, estate, relocation)? That informs how much negotiation room exists.
- Schools are F-rated, which usually means shorter tenancies and higher turnover. Who's the typical renter profile here, and what's been the actual vacancy rate?
- Crime grade is F in this area — have there been break-ins, vandalism, or insurance claims at this property in the last 3 years? What carrier currently insures it and at what premium?
- What's the average days-on-market for RENTAL listings here right now (not sales)? A rising rental-DOM trend means longer vacancies and softer asking-rent achievability than the comps imply.
- What's the recent tenant-quality profile in this submarket — average credit score on applications, eviction rate, late-payment / NSF rate, and stable-employment percentage? A property-management company in the area should have these aggregated.
- How much new apartment / multifamily construction is in the pipeline within 1–3 miles? Heavy new supply (>2% of stock underway) typically softens rents 12–24 months out; light construction supports rent growth.
Investment metrics
- 1% rule
- 1.68% ✓
- Cap rate
- 14.00%
- Cash-on-cash
- 27.54%
- DSCR
- 2.23
- GRM
- 5.0
CMA / ARV
- ARV (median comp)
- $123,572
- List price
- $130,000
- Delta
- 5.20%
- Verdict
- FAIR
- Comps
- 2 within 1.0 mi
Projected returns pro-forma
-3.0% appreciation · 4.06% rent growth · sell at horizon
- IRR
- 22.8%
- Equity multiple
- 1.95×
- Total profit
- $34,520
- Equity at exit
- $19,383
- IRR
- 31.5%
- Equity multiple
- 3.98×
- Total profit
- $108,556
- Equity at exit
- $11,240
Cash invested: $36,400 (down + closing). Projections, not guarantees.
Landlord ↔ Tenant lean methodology
- Overall (STATE)
- 62 Landlord-Friendly
- State Pennsylvania
- 62 Landlord-Friendly · EVEN
- County
- — inherits STATE
- City
- — inherits STATE
ZIP-level market 15120
- Home prices YoY
- -16.9%
- Rents YoY
- 4.1%
- Active inventory
- 92
- Price-to-rent
- 9.9×
Monthly cashflow live
- Estimated rent
- $2,185 high interval (Pro) →
- Mortgage (P&I)
- −$682
- Tax from tax record
- −$155 /mo · $1,859/yr
- Insurance
- −$54
- HOA
- −$0
- Vacancy / Maint / Mgmt
- −$459
- Net cashflow
- $835
Break-even live
2-unit breakdown (identical units grouped — click to expand)
| Units | Beds | Baths | Est. rent |
|---|---|---|---|
| 2× units | 1 | 1 | $2,184 |
| #1 | 1 | 1 | $1,092 |
| #2 | 1 | 1 | $1,092 |
| Total (2 units) | $2,185 | ||
UW: 25.0% down · 7.5% · 30yr · 1.5% tax · 5.0% vac · 8.0% maint · 8.0% mgmt
Financing live
Cash to close
- Down payment
- $32,500
- Closing costs
- $3,900
- Reserves months
- —
- Total cash needed
- —
Loan-product check · same deal, 3 products live
Conventional
25% down · 7.5% · 30yr
- Down + closing
- —
- Monthly P&I
- —
- Monthly cashflow
- —
- DSCR
- —
- Eligible?
- —
Personal DTI + credit; lowest rate.
DSCR
20% down · 8.5% · 30yr
- Down + closing
- —
- Monthly P&I
- —
- Monthly cashflow
- —
- DSCR
- —
- Eligible?
- —
No personal income docs; deal must DSCR.
Hard money
10% down · 12.0% · 12mo
- Down + closing
- —
- Monthly P&I
- —
- Monthly cashflow
- —
- DSCR
- —
- Eligible?
- —
Short-term bridge; refi at stabilization.
Rent comps 11 comps
| Address | Beds | Baths | Sqft | Rent | $/sqft | DOM | Units | Dist |
|---|---|---|---|---|---|---|---|---|
| 623 E 18th Ave Homestead, PA | 2.0 | 1.0 | 1156 | $1,600 | $1.38 | 43d | 1 | 0.15mi |
| 1900 Maple St Unit 4 Homestead, PA | 1.0 | 1.0 | 1200 | $1,400 | $1.17 | 23d | 1 | 0.20mi |
| 621 E 9th Ave Homestead, PA | 2.0 | 2.0 | 1400 | $1,425 | $1.02 | 23d | 1 | 0.38mi |
| 300 W 13th Ave Unit 302 Homestead, PA | 2.0 | 1.0 | 1088 | $1,150 | $1.06 | 16d | 1 | 0.39mi |
| 300 W 13th Ave Homestead, PA | 2.0 | 1.0 | 1088 | $1,125 | $1.03 | 16d | 1 | 0.39mi |
| 931 Hilltop St Homestead, PA | 3.0 | 1.5 | 1312 | $1,500 | $1.14 | 14d | 1 | 0.60mi |
| 218 Mary St Homestead, PA | 3.0 | 1.0 | 1776 | $1,400 | $0.79 | 21d | 1 | 0.77mi |
| 1254 Edgewood Dr Homestead, PA | 3.0 | 1.0 | 1144 | $1,725 | $1.51 | 43d | 1 | 0.81mi |
| 3305 W Run Rd Munhall, PA | 2.0 | 1.0 | 1100 | $1,365 | $1.24 | 23d | 1 | 1.02mi |
| 7009 Church St Pittsburgh, PA | 3.0 | 2.0 | 1800 | $1,550 | $0.86 | 43d | 1 | 1.23mi |
| 212 Kenmawr Ave Braddock, PA | 2.0 | 1.5 | 1417 | $1,300 | $0.92 | 43d | 1 | 1.46mi |
Listing history 28 events
-
2026-06-18days on market $130,000 Active 86 DOM
-
2026-06-17days on market $130,000 Active 85 DOM
-
2026-06-16days on market $130,000 Active 84 DOM
-
2026-06-15days on market $130,000 Active 83 DOM
-
2026-06-13days on market $130,000 Active 81 DOM
-
2026-06-09days on market $130,000 Active 77 DOM
-
2026-06-08days on market $130,000 Active 76 DOM
-
2026-06-07days on market $130,000 Active 75 DOM
-
2026-06-05days on market $130,000 Active 72 DOM
-
2026-06-03days on market $130,000 Active 71 DOM
-
2026-06-02days on market $130,000 Active 70 DOM
-
2026-06-01days on market $130,000 Active 69 DOM
-
2026-05-31days on market $130,000 Active 68 DOM
-
2026-05-06price $130,000 277-char remark
Show marketing remark (275 chars)
12 unit scattered site portfolio cash flowing with great value add opportunities. Units are varying conditions from turn key recently renovated to older units in need of some love. Great opportunity to pick up a handful of units and start (or grow) your investment portfolio.
-
2026-05-06price $825,000 275-char remark
Show marketing remark (275 chars)
12 unit scattered site portfolio cash flowing with great value add opportunities. Units are varying conditions from turn key recently renovated to older units in need of some love. Great opportunity to pick up a handful of units and start (or grow) your investment portfolio.
-
2026-03-24$135,000 Active 277-char remark
Show marketing remark (277 chars)
Welcome to 1600 McClure. This fully occupied duplex in Homestead is ready for a new investor to add to or expand their portfolio. This property is 2 - 1 bed 1 bath units and is fully occupied. Both units are in mid/low grade rental status but could be updated for higher rents.
-
2026-02-24$850,000 Active 275-char remark
Show marketing remark (275 chars)
12 unit scattered site portfolio cash flowing with great value add opportunities. Units are varying conditions from turn key recently renovated to older units in need of some love. Great opportunity to pick up a handful of units and start (or grow) your investment portfolio.
-
2026-02-09historical $750
-
2025-12-02$750
-
2025-12-02historical $750
-
2025-11-27$750
-
2024-07-26soldstatus $110,000 Closed
-
2024-06-01status Pending
-
2023-11-30$130,000 Active
-
2022-07-27price $160,000
-
2022-07-26$80,000 Active
-
2019-09-10soldstatus $241,500
-
1982-12-16soldstatus $18,000
ⓘ Source: listings_history table (triggers on properties + properties_extension) + one-shot
backfill from property_details.listing_events for pre-trigger history.
Tax reassessment forecast PA · Partial reset (capped growth)
- Current annual tax
- $1,859 · $155/mo
- Projected year-2 tax
- $1,957 · $163/mo
- Expected delta
- +$97/yr (+$8/mo · 5.2%)
ⓘ Screening estimate from a state-policy table — verify with the county assessor before closing.
Climate risk First Street
- Flood 1/10 Low FEMA zone X (unshaded) · 0% chance over 30 yrs
- Wildfire 1/10 Low
- Heat 4/10 Moderate 7 d/yr ≥97°F today · 18 d/yr by 30 yrs out
- Wind 2/10 Low 0% chance of damaging wind over 30 yrs
- Air quality 4/10 Moderate 4 unhealthy d/yr today · 5 by 30 yrs out
Nearby sold comps map
Loading sold comps map…
Walkable amenities ~0.75 mi
Loading nearby amenities…
Taxation est. · year 1
- Rental income
- $26,220
- − Mortgage interest
- −$7,282
- − Property taxes
- −$1,859
- − Insurance
- −$650
- − Repairs & maintenance
- −$2,098
- − Management
- −$2,098
- − Depreciation
- −$3,782
- Taxable income
- $8,452
- Est. tax owed @ 24.0%
- −$2,028
- After-tax cash flow
- $7,996/yr
For passive investors: Depreciation is non-cash, so a rental often shows a tax loss while cash-flowing — sheltering income. Rental losses are passive: they offset passive income freely, and up to $25,000/yr can offset ordinary (W-2) income if you actively participate and your MAGI is under $100k (phasing out to $0 by $150k); unused losses carry forward. On sale, claimed depreciation is recaptured at up to 25%, and gains may owe capital-gains tax (a 1031 exchange can defer both). Figures are a year-1 estimate at your 24.0% rate — not tax advice; consult a CPA.
Schools (NCES district)
- District
- Steel Valley SD
- NCES district ID
- 4222790
- Math proficiency
- 29% ▼ -1.00%
- Reading proficiency
- 45% ▼ -4.00%
- Median HH income
- $39,505
- Composite
- 30.94/100
- National rank
- #6111
- State rank
- #403 of 539 in PA
Livability — Homestead
- Score
- 77/100
- State rank
- #366
- US rank
- #3204
Category grades
Schools grade is shown separately in the Schools card above.
Census & demographics
- Census place
- Homestead, PA
- County
- Allegheny County · 1,022,028 people
- Metro
- Pittsburgh, PA
- Population (ZIP)
- 18,029
- Household income
- $55,714
- Rent vs Own
- Severe rent burden
- 669.0
Population outlook (Allegheny County) Hauer SSP2
- Today (2025)
- 1,250,282 people
- By 2030
- 1,256,482 · +0.5%
- By 2040
- 1,256,318 · +0.5%
- By 2050
- 1,244,169 · -0.5%
- By 2075
- 1,197,693 · -4.2%
- By 2100
- 1,093,187 · -12.6%
Race, ethnicity, and origin ACS 2023
- Neighborhood character
- Predominantly White (74%)
- Race & ethnicity
- White 74% Black 20% Two or more races 4% Hispanic / Latino 2%
- Common ancestry
- Romanian 6% Lithuanian 1% Scotch-Irish 1%
- Foreign-born
- 3% · South Korea, Canada
- Languages at home
- 95% English-only · Spanish 3% Russian/Polish/Slavic 1%
Political lean MEDSL · Allegheny
- 2024 margin
- Strong D (+20.3) · D 59.7% · R 39.4%
- 2008→2024 swing
- +4.8pp toward D · 2008: 15.5pp · 2024: 20.3pp
- All cycles
- 2024: D+20.3 2020: D+20.4 2016: D+16.4 2012: D+14.4 2008: D+15.5
Not yet ingested
- Civics
- —
Market trends
- HPI YoY
- ▼ -59.52%
- Current HPI
- 292.5607
- Rent YoY
- ▲ 4.06%
- Metro
- Pittsburgh, PA
- State GDP YoY
- ▲ 1.68%
- F500 in state
- 34
Industry mix (Fortune 500 HQ in PA)
| Industry | F500 HQs | Revenue |
|---|---|---|
| Healthcare | 2 | $309B |
|
||
| Insurance | 2 | $27B |
|
||
| Telecommunications / Media | 1 | $124B |
|
||
| Industrial Distribution | 1 | $22B |
|
||
| Financial Services | 1 | $20B |
|
||
| Chemicals / Materials | 1 | $18B |
|
||
Price history
+622.2% since first listed15 events — show timeline
- 2026-05-06 Price Changed $130,000 West Penn MLS
- 2026-05-06 Price Changed $825,000 West Penn MLS
- 2026-03-24 Listed $135,000 West Penn MLS
- 2026-02-24 Listed $850,000 West Penn MLS
- 2026-02-09 Rental Removed $750 Avail
- 2025-12-02 Listed for Rent $750 Avail
- 2025-12-02 Rental Removed $750 APPFOLIO
- 2025-11-27 Listed for Rent $750 APPFOLIO
- 2024-07-26 Sold (MLS) $110,000 West Penn MLS
- 2024-06-01 Pending — West Penn MLS
- 2023-11-30 Listed $130,000 West Penn MLS
- 2022-07-27 Price Changed $160,000 West Penn MLS
- 2022-07-26 Listed $80,000 West Penn MLS
- 2019-09-10 Sold (Public Records) $241,500 Public Records
- 1982-12-16 Sold (Public Records) $18,000 Public Records
Property tax history
+2.8%/yrLatest (2026): $1,859 · +3.2% YoY. Source: county tax records.
Cash-flow waterfall
monthlySold comps — $/sqft
last 12 mo · ≤1 miLoading sold comps…