135 CR 2254 · Saltillo, MS
Flood risk 1/10 · Minimal
- FEMA flood zone
- X (unshaded)
- Chance of flooding over 30 yrs
- 0.0%
- Est. flood insurance / yr
- $507 – $1,088
Fire risk 4/10 · Minor
- Est. fire insurance / yr
- $1,241 – $2,305
Heat risk 6/10 · Moderate
- Hot days now (above 110°F)
- 7 days/yr
- Hot days in 30 yrs
- 20 days/yr
Wind risk 6/10 · Moderate
- Chance of severe wind over 30 yrs
- 27.0%
Air-quality risk 1/10 · Minimal
- Unhealthy air days now
- 0 days/yr
- Unhealthy air days in 30 yrs
- 0 days/yr
Risk factors via First Street. Map © Google.
Why this score? — see what drove the C+ grade
The composite is a weighted blend of 9 inputs, each scored 0–100. Each bar is that input's sub-score; the figure is the points it added to the 100-point composite (weight × sub-score).
- Cash flow +29.1/30.0
- DSCR +10.0/10.0
- ARV discount +7.5/15.0
- 1% rule +6.8/10.0
- Livability +3.5/5.0
- Schools +3.0/10.0
- Rent growth +2.5/5.0
- Condition / age +2.5/5.0
- Appreciation +0.0/10.0
$115,000
🖨 Deal sheet 📄 Offer letter ✓ Due diligence
Listing remarks
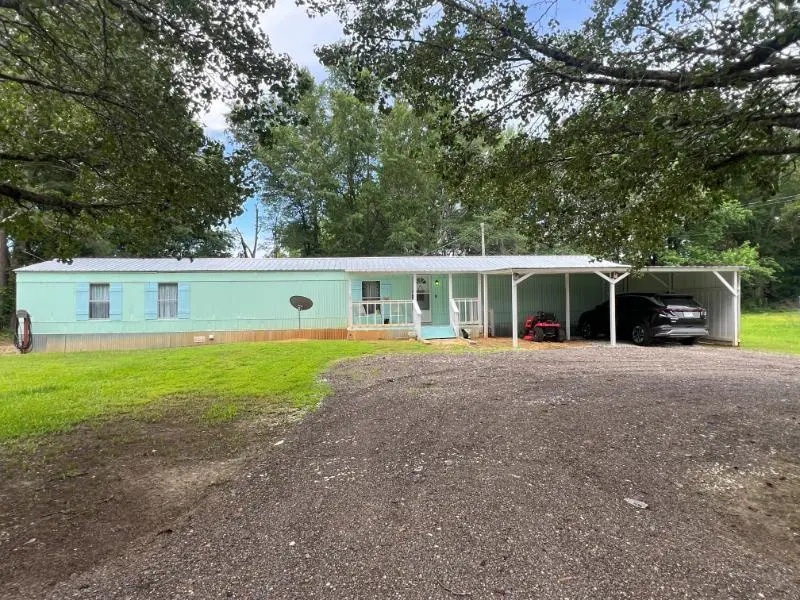
Affordable and move in ready! This 1997 Legend 3 bedroom, 2 bath single-wide mobile home is situated on a spacious 1/2 acre lot in the Saltillo School District. Recent updates include a new roof, new LVP flooring, fresh interior paint, and stylish new kitchen backsplash. The kitchen features a new stainless steel gas range, and the refrigerator, washer, dryer and chest freezer will remain with the home. The washer and dryer are approximately 2.5 years old. Additional amenities include a new gas heater, whole house water filtration system, a double attached carport, and a functional floor plan making this property a great opportunity for first-time buyers, downsizers, or investors. All info
Key facts
- New lvp flooring
- Fresh interior paint
- New roof
Tags
Property features AI
Exterior
- Home design: Manufactured home (Residential)
- Exterior features: Lot dimensions approximately 229 x 387; Directions: Go north on 45 to Euclatubba Rd, around loop, continue onto CR 251, left on CR 599, left on CR 2254; home is on the right
Interior
- Bathrooms: 2 full bathrooms
- Interior features: Total of 5 rooms
Neighborhood map
What this means for you Summary
Snapshot
- This is a 3-bed/2.0-bath manufactured listed at $115k.
Deal economics
- At list price, monthly cash flow is $396 ($5k/yr) — positive.
- The deal already cash-flows at list — no discount required.
- Meets the 1% rule at list price ($1k rent vs $115k).
Location & tenants
- Location reads 69/100 on livability (#48 in MS) — a middle-class / working-renter tenant base. Strengths: crime A+, cost of living A+, housing A+; Watch: schools D+, amenities F, commute F.
- Lee County School District (rural): math 37% / reading 35% proficiency, ranked #51 of 130 in MS (top 39%) — families likely to look elsewhere, expect single-tenant / working-renter base with shorter leases.
- Market conditions: 150 active listings in the ZIP; 154 units permitted in Lee County in 2024 (24 in 5+ unit buildings).
Forward outlook
- Local home prices are declining (-3.0%/yr); year-one equity from $795 of loan paydown is wiped out by about $3k of value loss. Plan a longer hold.
- Lee County population projected at +6% by 2050 — modest demand growth; plan on rents tracking national, not racing it.
- At projected returns (-3.0% appreciation + 3.0% rent growth), your $32k cash investment doubles in ~8 years — after that, you're playing with house money.
Negotiation context
- Only 10 days on market — expect competitive offers; lowballing is unlikely to land.
- 4 sale attempts since 3y ago; this cycle's ask has dropped $25k (18%) from the opening price — seller is motivated, your offer sets the floor, not the list.
- Current owner paid $85k; 35% above their basis — modest negotiation headroom, anchor on the comps not their cost.
Risks & watch-outs
- Climate carrying-cost: major wind risk, 27% chance of damaging wind over 30y; extreme-heat days projected 7→20/yr by 2055 (HVAC capex compounding) — expect insurance premiums to compound above CPI over the hold.
Questions for the listing agent
- Is there a deadline driving the sale (1031 exchange, divorce, estate, relocation)? That informs how much negotiation room exists.
- Schools are D-rated, which usually means shorter tenancies and higher turnover. Who's the typical renter profile here, and what's been the actual vacancy rate?
- What's the average days-on-market for RENTAL listings here right now (not sales)? A rising rental-DOM trend means longer vacancies and softer asking-rent achievability than the comps imply.
- What's the recent tenant-quality profile in this submarket — average credit score on applications, eviction rate, late-payment / NSF rate, and stable-employment percentage? A property-management company in the area should have these aggregated.
- How much new for-sale + rental construction is in the pipeline within 1–3 miles? Heavy new supply typically softens prices + rents 12–24 months out; constrained supply supports both.
Investment metrics
- 1% rule
- 1.18% ✓
- Cap rate
- 10.43%
- Cash-on-cash
- 14.76%
- DSCR
- 1.66
- GRM
- 7.0
CMA / ARV
- ARV (on-the-fly)
- $56,320
- Comps found
- 1
Show comp detail 1 sale within ~0.75 mi
| Address | Dist | Beds/Ba | Sqft | Sold | Price | $/sf | Match |
|---|---|---|---|---|---|---|---|
| 225 CR 599 | 0.22mi | 2/2.0 (-1) | 1,216 (-5%) | 23mo | $54,000 | $44 | 57 |
Match score weights: distance 35% · size 25% · config 20% · recency 20%. Top-matched comps best support the ARV.
Projected returns pro-forma
-3.0% appreciation · 3.0% rent growth · sell at horizon
- IRR
- 5.2%
- Equity multiple
- 1.20×
- Total profit
- $6,536
- Equity at exit
- $17,147
- IRR
- 14.6%
- Equity multiple
- 2.18×
- Total profit
- $37,963
- Equity at exit
- $9,943
Cash invested: $32,200 (down + closing). Projections, not guarantees.
Landlord ↔ Tenant lean methodology
- Overall (STATE)
- 90 Strongly Landlord-Friendly
- State Mississippi
- 90 Strongly Landlord-Friendly · R+11
- County
- — inherits STATE
- City
- — inherits STATE
ZIP-level market 38866
- Home prices YoY
- -18.5%
- Active inventory
- 150
- Price-to-rent
- 7.0×
Monthly cashflow live
- Estimated rent
- $1,360 medium interval (Pro) →
- Mortgage (P&I)
- −$603
- Tax from tax record
- −$28 /mo · $331/yr
- Insurance
- −$48
- HOA
- −$0
- Vacancy / Maint / Mgmt
- −$286
- Net cashflow
- $396
Break-even live
UW: 25.0% down · 7.5% · 30yr · 1.5% tax · 5.0% vac · 8.0% maint · 8.0% mgmt
Financing live
Cash to close
- Down payment
- $28,750
- Closing costs
- $3,450
- Reserves months
- —
- Total cash needed
- —
Loan-product check · same deal, 3 products live
Conventional
25% down · 7.5% · 30yr
- Down + closing
- —
- Monthly P&I
- —
- Monthly cashflow
- —
- DSCR
- —
- Eligible?
- —
Personal DTI + credit; lowest rate.
DSCR
20% down · 8.5% · 30yr
- Down + closing
- —
- Monthly P&I
- —
- Monthly cashflow
- —
- DSCR
- —
- Eligible?
- —
No personal income docs; deal must DSCR.
Hard money
10% down · 12.0% · 12mo
- Down + closing
- —
- Monthly P&I
- —
- Monthly cashflow
- —
- DSCR
- —
- Eligible?
- —
Short-term bridge; refi at stabilization.
Listing history 9 events
-
2026-06-18days on market $115,000 Active 10 DOM
-
2026-06-17days on market $115,000 Active 9 DOM
-
2026-06-17price $115,000 Active 8 DOM
-
2026-06-16days on market $139,900 Active 8 DOM
-
2026-06-15days on market $139,900 Active 7 DOM
-
2026-06-14days on market $139,900 Active 5 DOM
-
2026-06-12days on market $139,900 Active 4 DOM
-
2026-06-09remarks 699-char remark
-
2026-06-09$139,900 Active 1 DOM
ⓘ Source: listings_history table (triggers on properties + properties_extension) + one-shot
backfill from property_details.listing_events for pre-trigger history.
Tax reassessment forecast MS · Resets to sale price
- Current annual tax
- $331 · $28/mo
- Projected year-2 tax
- $909 · $76/mo
- Expected delta
- +$578/yr (+$48/mo · 174.5%)
ⓘ Screening estimate from a state-policy table — verify with the county assessor before closing.
Climate risk First Street
- Flood 1/10 Low FEMA zone X (unshaded) · 0% chance over 30 yrs
- Wildfire 4/10 Moderate
- Heat 6/10 Major 7 d/yr ≥110°F today · 20 d/yr by 30 yrs out
- Wind 6/10 Major 27% chance of damaging wind over 30 yrs
- Air quality 1/10 Low 0 unhealthy d/yr today · 0 by 30 yrs out
Nearby sold comps map
Loading sold comps map…
Walkable amenities ~0.75 mi
Loading nearby amenities…
Taxation est. · year 1
- Rental income
- $16,323
- − Mortgage interest
- −$6,442
- − Property taxes
- −$331
- − Insurance
- −$575
- − Repairs & maintenance
- −$1,306
- − Management
- −$1,306
- − Depreciation
- −$3,345
- Taxable income
- $3,018
- Est. tax owed @ 24.0%
- −$724
- After-tax cash flow
- $4,028/yr
For passive investors: Depreciation is non-cash, so a rental often shows a tax loss while cash-flowing — sheltering income. Rental losses are passive: they offset passive income freely, and up to $25,000/yr can offset ordinary (W-2) income if you actively participate and your MAGI is under $100k (phasing out to $0 by $150k); unused losses carry forward. On sale, claimed depreciation is recaptured at up to 25%, and gains may owe capital-gains tax (a 1031 exchange can defer both). Figures are a year-1 estimate at your 24.0% rate — not tax advice; consult a CPA.
Schools (NCES district)
- District
- Lee County School District
- NCES district ID
- 2802550
- Math proficiency
- 37% ▼ -11.00%
- Reading proficiency
- 35% ▼ -6.00%
- Median HH income
- $41,435
- Composite
- 30.38/100
- National rank
- #6253
- State rank
- #51 of 130 in MS
Livability — Saltillo
- Score
- 69/100
- State rank
- #48
- US rank
- #8244
Category grades
Schools grade is shown separately in the Schools card above.
Census & demographics
- City population
- 11,714
- Population (ZIP)
- 11,714
Population outlook (Lee County) Hauer SSP2
- Today (2025)
- 90,253 people
- By 2030
- 92,125 · +2.1%
- By 2040
- 94,914 · +5.2%
- By 2050
- 95,841 · +6.2%
- By 2075
- 94,189 · +4.4%
- By 2100
- 83,736 · -7.2%
Race, ethnicity, and origin ACS 2023
- Neighborhood character
- Predominantly White (86%)
- Race & ethnicity
- White 86% Black 9% Asian 2% Hispanic / Latino 1% Two or more races 1%
- Common ancestry
- Lithuanian 3% Slovak 1% Italian 1%
- Foreign-born
- 2% · Vietnam, Canada
- Languages at home
- 96% English-only · Vietnamese 2% Spanish 1%
Political lean MEDSL · Lee
- 2024 margin
- Solid R (+38.8) · D 30.0% · R 68.9% · Other 1.1%
- 2008→2024 swing
- -8.3pp toward R · 2008: -30.5pp · 2024: -38.8pp
- All cycles
- 2024: R+38.8 2020: R+32.5 2016: R+37.7 2012: R+29.0 2008: R+30.5
Not yet ingested
- Civics
- —
Market trends
- HPI YoY
- ▼ -39.48%
- Current HPI
- 173.8036
- Rent YoY
- —
- Metro
- —
- State GDP YoY
- —
- F500 in state
- 0
Price history
+1264.7% since first listed10 events — show timeline
- 2026-06-08 Listed $139,900 NEMSBD
- 2025-01-03 Price Changed $105,000 NEMSBD
- 2024-12-07 Price Changed $115,000 NEMSBD
- 2024-10-21 Listed $122,000 NEMSBD
- 2024-09-23 Price Changed $110,000 NEMSBD
- 2024-09-06 Listed $120,000 NEMSBD
- 2023-09-01 Sold (Public Records) $85,000 Public Records
- 2023-09-01 Sold (MLS) — NEMSBD
- 2023-06-14 Listed $85,900 NEMSBD
- 2019-01-25 Sold (Public Records) $10,251 Public Records
Property tax history
-0.4%/yrLatest (2023): $331 · +42.3% YoY. Source: county tax records.
Cash-flow waterfall
monthlySold comps — $/sqft
last 12 mo · ≤1 miLoading sold comps…