 Duplex
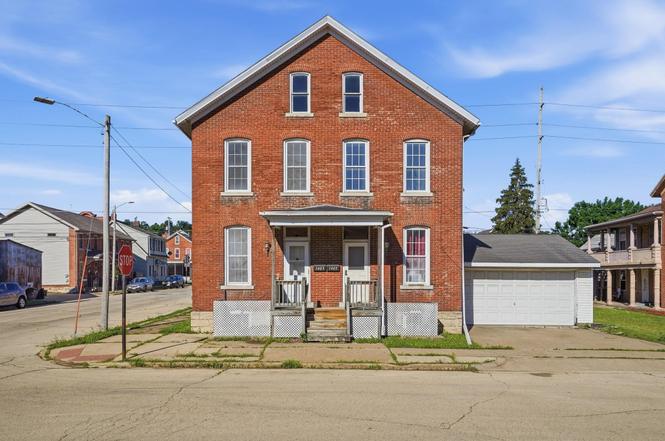
1403-1405 Washington St · Dubuque, IA
Flood risk 4/10 · Minor
- FEMA flood zone
- X
- Chance of flooding over 30 yrs
- 0.22%
- Est. flood insurance / yr
- $473 – $860
Fire risk 1/10 · Minimal
- Est. fire insurance / yr
- $902 – $1,676
Heat risk 3/10 · Minor
- Hot days now (above 102°F)
- 7 days/yr
- Hot days in 30 yrs
- 15 days/yr
Wind risk 2/10 · Minimal
- Chance of severe wind over 30 yrs
- —
Air-quality risk 2/10 · Minimal
- Unhealthy air days now
- 1 days/yr
- Unhealthy air days in 30 yrs
- 2 days/yr
Risk factors via First Street. Map © Google.
Why this score? — see what drove the B+ grade
The composite is a weighted blend of 9 inputs, each scored 0–100. Each bar is that input's sub-score; the figure is the points it added to the 100-point composite (weight × sub-score).
- Cash flow +30.0/30.0
- ARV discount +13.6/15.0
- 1% rule +10.0/10.0
- DSCR +10.0/10.0
- Schools +5.5/10.0
- Livability +4.5/5.0
- Rent growth +3.9/5.0
- Condition / age +2.5/5.0
- Appreciation +0.0/10.0
$170,000
🖨 Deal sheet (PDF) 📄 Offer letter ✓ Due diligence
Multi-family units
County records classify this as Multi-Family (2-4 Unit). Listing-text estimate: 2 units. confirmed
Listing remarks
Excellent investment opportunity! This side-by-side duplex offers separate utilities for each unit, making management simple and efficient. The property features a two-car garage and a fenced-in yard, providing added value for tenants or owner-occupants alike. Conveniently located and offering strong rental potential, this duplex is a great addition to an investment portfolio or an opportunity to offset your mortgage by living in one unit and renting the other. Don't miss your chance to own this versatile property!
Key facts
- Two-car garage
- Fenced-in yard
- Garage
Tags
Property features AI
Finance
- Financial info: Actual rent: $1,100 for the 3-bedroom unit; Actual rent: $800 for the 2-bedroom unit
Exterior
- Parking: Attached garage; Off-street parking for 2 vehicles
- Utilities: Natural gas heating
- Home design: Duplex (residential income); Two levels
- Construction: Brick construction; Stone foundation; Built above grade finished area
- Exterior features: Shingle roof; Zoned R
Interior
- Kitchen: Refrigerator; Range
- Bedrooms: One unit with 3 bedrooms; One unit with 2 bedrooms
- Bathrooms: One bathroom in the 3-bedroom unit; One bathroom in the 2-bedroom unit
- Heating & cooling: Forced air heating (natural gas); Window air conditioning units
- Interior features: Refrigerator; Range; Washer; Dryer; Partial basement
- Laundry & utility: Washer; Dryer
Neighborhood map
What this means for you Summary
Snapshot
- This is a 2 × 2-bed/1.0-bath units multifamily listed at $170k.
Deal economics
- At list price, monthly cash flow is $960 ($12k/yr) — positive. Per door: $480/mo.
- The deal already cash-flows at list — no discount required.
- Meets the 1% rule at list price ($3k rent vs $170k).
- Cap rate 13.1% vs local median 3.5% in Dubuque — top-decile yield for the area; either an underpriced asset or a hidden risk that comps aren't pricing in. Stress-test before assuming the spread holds.
Location & tenants
- Location reads 89/100 on livability (#7 in IA, #119 nationally) — a professional / high-income tenant draw. Strengths: amenities A+, commute A+, cost of living A+; Watch: crime C-.
- Dubuque Community School District (urban): math 63% / reading 65% proficiency, ranked #205 of 289 in IA (top 71%) — acceptable for families but not a draw, mixed tenant base, ~2y average lease.
- Zoned schools: Prescott Elementary School (math 27% / reading 27%, grade F, #607 of 616 statewide, top 99%, 370 students, 76% FRL); George Washington Middle School (math 63% / reading 65%, grade B+, #166 of 246 statewide, top 68%, 624 students, 50% FRL); Hempstead High School (math 64% / reading 71%, grade B, #186 of 336 statewide, top 57%, 1,584 students, 38% FRL) — zoned schools average 55% FRL vs 32% district-wide (23 pts higher); higher-poverty schools than district average — tighter screening recommended.
- Market conditions: Rents rising fast (+5.6%/yr); 234 active listings in the ZIP; 2 comparable units currently listed for rent nearby; 473 units permitted in Dubuque County in 2024 (319 in 5+ unit buildings).
- At $2,542/mo this rent would consume 49% of the median local household income ($62k/yr) (locally 1940% of renters already pay >50% of income on rent) — very limited rent-growth headroom before tenants either downsize or default.
Forward outlook
- Local home prices are declining (-3.0%/yr); year-one equity from $1k of loan paydown is wiped out by about $5k of value loss. Plan a longer hold.
- Dubuque County population projected at +13% by 2050 — modest demand growth; plan on rents tracking national, not racing it.
- At projected returns (-3.0% appreciation + 5.6% rent growth), your $48k cash investment doubles in ~5 years — after that, you're playing with house money.
Negotiation context
- Only 7 days on market — expect competitive offers; lowballing is unlikely to land.
Risks & watch-outs
- Watch-outs: built in 1890 — expect roof / HVAC / electrical / plumbing capex.
Questions for the listing agent
- Can we see the unit-by-unit rent roll, current vacancy, and any below-market leases? What's the average tenancy length?
- What capital expenditures (roof, boiler, parking lot, exteriors) have been made in the last 5 years, and what's planned in the next 2?
- Built in 1890 — when were the roof, HVAC, electrical panel, plumbing, and water heater last replaced?
- Is there a deadline driving the sale (1031 exchange, divorce, estate, relocation)? That informs how much negotiation room exists.
- Schools are B-rated — typically a magnet for longer-tenancy family renters. What's the average tenant stay here, and is there a school-zone premium baked into asking?
- What's the average days-on-market for RENTAL listings here right now (not sales)? A rising rental-DOM trend means longer vacancies and softer asking-rent achievability than the comps imply.
- What's the recent tenant-quality profile in this submarket — average credit score on applications, eviction rate, late-payment / NSF rate, and stable-employment percentage? A property-management company in the area should have these aggregated.
- How much new apartment / multifamily construction is in the pipeline within 1–3 miles? Heavy new supply (>2% of stock underway) typically softens rents 12–24 months out; light construction supports rent growth.
Investment metrics
- 1% rule
- 1.50% ✓
- Cap rate
- 13.07%
- Cash-on-cash
- 24.20%
- DSCR
- 2.08
- GRM
- 5.6
CMA / ARV
- ARV (on-the-fly)
- $196,560
- Comps found
- 10
Show comp detail 10 sales within ~0.75 mi
| Address | Dist | Beds/Ba | Sqft | Sold | Price | $/sf | Match |
|---|---|---|---|---|---|---|---|
| 25-27 W 15th St | 0.18mi | 6/2.0 (+1) | 2,636 (+5%) | 2mo | $205,000 | $78 | 69 |
| 2123 Central Ave | 0.47mi | 5/4.0 | 2,496 (-1%) | 15mo | $195,000 | $78 | 64 |
| 506 W Locust St Unit 508 W Locust | 0.53mi | 4/2.0 (-1) | 2,520 (0%) | 9mo | $100,000 | $40 | 55 |
| 1636 Jackson St | 0.14mi | 5/2.0 | 2,156 (-14%) | 17mo | $160,000 | $74 | 48 |
| 2138 White St | 0.48mi | 5/2.0 | 2,304 (-9%) | 15mo | $184,000 | $80 | 43 |
| 2164 Jackson St | 0.51mi | 5/2.0 | 2,158 (-14%) | 4mo | $155,000 | $72 | 41 |
| 721 Rose St Unit 721-723 Rose Street | 0.69mi | 4/4.0 (-1) | 2,780 (+10%) | 7mo | $250,000 | $90 | 40 |
| 2072 N Main St | 0.48mi | 5/2.0 | 2,216 (-12%) | 23mo | $175,000 | $79 | 31 |
| 535 W 17th St | 0.56mi | 4/2.0 (-1) | 2,308 (-8%) | 19mo | $175,000 | $76 | 30 |
| 571 Wilbur St | 0.59mi | 4/3.0 (-1) | 2,245 (-11%) | 21mo | $100,000 | $45 | 28 |
Match score weights: distance 35% · size 25% · config 20% · recency 20%. Top-matched comps best support the ARV.
Projected returns pro-forma
-3.0% appreciation · 5.63% rent growth · sell at horizon
- IRR
- 20.2%
- Equity multiple
- 1.85×
- Total profit
- $40,450
- Equity at exit
- $25,348
- IRR
- 30.1%
- Equity multiple
- 4.02×
- Total profit
- $143,680
- Equity at exit
- $14,698
Cash invested: $47,600 (down + closing). Projections, not guarantees.
Landlord ↔ Tenant lean methodology
- Overall (STATE)
- 83 Strongly Landlord-Friendly
- State Iowa
- 83 Strongly Landlord-Friendly · R+6
- County
- — inherits STATE
- City
- — inherits STATE
ZIP-level market 52001
- Rents YoY
- 5.6%
- Active inventory
- 234
- Price-to-rent
- 11.1×
Monthly cashflow live
- Estimated rent
- $2,542 high interval (Pro) →
- Mortgage (P&I)
- −$891
- Tax from tax record
- −$86 /mo · $1,032/yr
- Insurance
- −$71
- HOA
- −$0
- Vacancy / Maint / Mgmt
- −$534
- Net cashflow
- $960
Break-even live
Sensitivity live
| Price | -10% $1,056 | -5% $1,008 | +0% $960 | +5% $912 | +10% $864 |
|---|---|---|---|---|---|
| Rent | -10% $759 | -5% $859 | +0% $960 | +5% $1,060 | +10% $1,161 |
| Rate | -1.0pp $1,045 | -0.5pp $1,003 | base $960 | +0.5pp $916 | +1.0pp $871 |
2-unit breakdown (identical units grouped — click to expand)
| Units | Beds | Baths | Est. rent |
|---|---|---|---|
| 2× units | 2 | 1 | $2,542 |
| #1 | 2 | 1 | $1,271 |
| #2 | 2 | 1 | $1,271 |
| Total (2 units) | $2,542 | ||
UW: 25.0% down · 7.5% · 30yr · 1.5% tax · 5.0% vac · 8.0% maint · 8.0% mgmt
Financing live
Cash to close
- Down payment
- $42,500
- Closing costs
- $5,100
- Reserves months
- —
- Total cash needed
- —
Loan-product check · same deal, 3 products live
Conventional
25% down · 7.5% · 30yr
- Down + closing
- —
- Monthly P&I
- —
- Monthly cashflow
- —
- DSCR
- —
- Eligible?
- —
Personal DTI + credit; lowest rate.
DSCR
20% down · 8.5% · 30yr
- Down + closing
- —
- Monthly P&I
- —
- Monthly cashflow
- —
- DSCR
- —
- Eligible?
- —
No personal income docs; deal must DSCR.
Hard money
10% down · 12.0% · 12mo
- Down + closing
- —
- Monthly P&I
- —
- Monthly cashflow
- —
- DSCR
- —
- Eligible?
- —
Short-term bridge; refi at stabilization.
Rent comps 2 comps
| Address | Beds | Baths | Sqft | Rent | $/sqft | DOM | Units | Dist |
|---|---|---|---|---|---|---|---|---|
| 1199 Central Ave Unit 302 Dubuque, IA | 4.0 | 3.0 | 2339 | $2,850 | $1.22 | 46d | 1 | 0.20mi |
| 597 Jefferson St Rm 3 Dubuque, IA | 5.0 | 2.0 | 1800 | $550 | $0.31 | 46d | 1 | 0.60mi |
Listing history 7 events
-
2026-06-22days on market $170,000 Active 7 DOM
-
2026-06-21days on market $170,000 Active 6 DOM
-
2026-06-19days on market $170,000 Active 4 DOM
-
2026-06-18days on market $170,000 Active 3 DOM
-
2026-06-17days on market $170,000 Active 2 DOM
-
2026-06-15remarks 520-char remark
-
2026-06-15$170,000 Active 1 DOM
ⓘ Source: listings_history table (triggers on properties + properties_extension) + one-shot
backfill from property_details.listing_events for pre-trigger history.
Tax reassessment forecast IA · Partial reset (capped growth)
- Current annual tax
- $1,032 · $86/mo
- Projected year-2 tax
- $1,850 · $154/mo
- Expected delta
- +$818/yr (+$68/mo · 79.3%)
ⓘ Screening estimate from a state-policy table — verify with the county assessor before closing.
Climate risk First Street
- Flood 4/10 Moderate FEMA zone X · 22% chance over 30 yrs
- Wildfire 1/10 Low
- Heat 3/10 Moderate 7 d/yr ≥102°F today · 15 d/yr by 30 yrs out
- Wind 2/10 Low
- Air quality 2/10 Low 1 unhealthy d/yr today · 2 by 30 yrs out
Nearby sold comps map
Loading sold comps map…
Walkable amenities ~0.75 mi
Loading nearby amenities…
Taxation est. · year 1
- Rental income
- $30,504
- − Mortgage interest
- −$9,523
- − Property taxes
- −$1,032
- − Insurance
- −$850
- − Repairs & maintenance
- −$2,440
- − Management
- −$2,440
- − Depreciation
- −$4,945
- Taxable income
- $9,273
- Est. tax owed @ 24.0%
- −$2,226
- After-tax cash flow
- $9,293/yr
For passive investors: Depreciation is non-cash, so a rental often shows a tax loss while cash-flowing — sheltering income. Rental losses are passive: they offset passive income freely, and up to $25,000/yr can offset ordinary (W-2) income if you actively participate and your MAGI is under $100k (phasing out to $0 by $150k); unused losses carry forward. On sale, claimed depreciation is recaptured at up to 25%, and gains may owe capital-gains tax (a 1031 exchange can defer both). Figures are a year-1 estimate at your 24.0% rate — not tax advice; consult a CPA.
Schools (NCES district)
- District
- Dubuque Community School District
- NCES district ID
- 1909480
- Math proficiency
- 63% ▼ -7.00%
- Reading proficiency
- 65% ▼ -1.00%
- Median HH income
- $51,237
- Composite
- 54.51/100
- National rank
- #1345
- State rank
- #205 of 289 in IA
Livability — Dubuque
- Score
- 89/100
- State rank
- #7
- US rank
- #119
Category grades
Schools grade is shown separately in the Schools card above.
Census & demographics
- Census place
- Dubuque, IA
- County
- Dubuque County · 60,106 people
- City population
- 60,106
- Metro
- Dubuque, IA
- Population (ZIP)
- 43,101
- Household income
- $61,643
- Rent vs Own
- Severe rent burden
- 1940.0
Population outlook (Dubuque County) Hauer SSP2
- Today (2025)
- 103,359 people
- By 2030
- 106,472 · +3.0%
- By 2040
- 112,043 · +8.4%
- By 2050
- 116,553 · +12.8%
- By 2075
- 128,014 · +23.9%
- By 2100
- 132,892 · +28.6%
Race, ethnicity, and origin ACS 2023
- Neighborhood character
- Predominantly White (84%)
- Race & ethnicity
- White 84% Two or more races 6% Black 5% Hispanic / Latino 4% Asian 1% Pacific Islander 1%
- Common ancestry
- Portuguese 3% Italian 2% Lithuanian 2%
- Foreign-born
- 4% · Canada, China
- Languages at home
- 95% English-only · Spanish 3% Tagalog/Filipino 1% Other Asian/Pacific 1%
Political lean MEDSL · Dubuque
- 2024 margin
- Lean R (+8.6) · D 45.1% · R 53.7% · Other 1.2%
- 2008→2024 swing
- -29.4pp toward R · 2008: 20.8pp · 2024: -8.6pp
- All cycles
- 2024: R+8.6 2020: R+2.9 2016: R+1.2 2012: D+14.5 2008: D+20.8
Not yet ingested
- Civics
- —
Market trends
- HPI YoY
- ▼ -156.36%
- Current HPI
- 173.5536
- Rent YoY
- ▲ 5.63%
- Metro
- Dubuque, IA
- State GDP YoY
- ▲ 2.48%
- F500 in state
- 4
Industry mix (Fortune 500 HQ in IA)
| Industry | F500 HQs | Revenue |
|---|---|---|
| Financial Services | 1 | $16B |
|
||
| Retail / Convenience | 1 | $15B |
|
||
Price history
1 event — show timeline
- 2026-06-15 Listed $170,000 ECIMLS
Property tax history
-1.2%/yrLatest (2025): $1,032 · +3.0% YoY. Source: county tax records.
Cash-flow waterfall
monthlySold comps — $/sqft
last 12 mo · ≤1 miLoading sold comps…