2217 E 67th Ter · Kansas City, MO
Flood risk 1/10 · Minimal
- FEMA flood zone
- X (unshaded)
- Chance of flooding over 30 yrs
- 0.0%
- Est. flood insurance / yr
- $507 – $1,088
Fire risk 1/10 · Minimal
- Est. fire insurance / yr
- $1,054 – $1,958
Heat risk 4/10 · Minor
- Hot days now (above 106°F)
- 7 days/yr
- Hot days in 30 yrs
- 17 days/yr
Wind risk 2/10 · Minimal
- Chance of severe wind over 30 yrs
- —
Air-quality risk 3/10 · Minor
- Unhealthy air days now
- 2 days/yr
- Unhealthy air days in 30 yrs
- 4 days/yr
Risk factors via First Street. Map © Google.
Why this score? — see what drove the A grade
The composite is a weighted blend of 9 inputs, each scored 0–100. Each bar is that input's sub-score; the figure is the points it added to the 100-point composite (weight × sub-score).
- Cash flow +30.0/30.0
- ARV discount +15.0/15.0
- 1% rule +10.0/10.0
- DSCR +10.0/10.0
- Appreciation +10.0/10.0
- Livability +3.9/5.0
- Rent growth +3.2/5.0
- Condition / age +2.5/5.0
- Schools +1.5/10.0
$99,950
🖨 Deal sheet (PDF) 📄 Offer letter ✓ Due diligence
Listing remarks
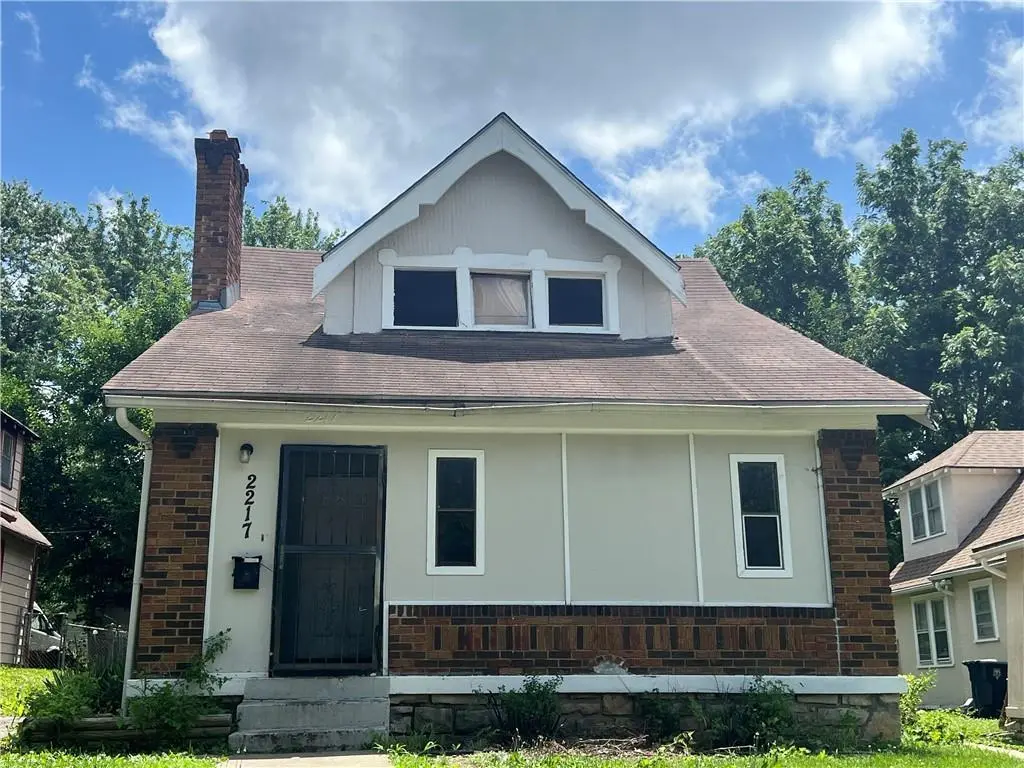
Investor Special! This is your chance to add value with a true fixer-upper. Seller is motivated. Located in an established Kansas City neighborhood, 2217 E 67th Terrace is being sold AS-IS and is ideal for experienced investors, flippers, or buy-and-hold buyers looking for their next project. Home is priced to sell. This 3 bedroom 1.5 bath home has an attic space to add additional bedrooms and possibly a bathroom. A home 2 blocks south just sold for $218,500, so there is plenty of meat on the bone. The property is in need of a full renovation and currently * * does not have a water heater or HVAC system * * . All utilities are off and will remain off until its new owner comes along. Brin
Key facts
- Attic space
- Full renovation
- 5,663 sq ft lot
Tags
Property features AI
Finance
- Other: Lot approximately 5,663 square feet
- HOA & community: No association fees
Exterior
- Parking: Off-street parking
- Utilities: Public water; Public sewer
- Home design: Single-family residence; Residential property; 1.5-story floor plan; Property listed as fixer
- Construction: Brick veneer and other construction materials; Composition roof; Age: 76-100 years; Basement present
- Exterior features: Fenced yard (other)
Interior
- Kitchen: Dishwasher; Refrigerator; Free-standing electric oven
- Bedrooms: 3 bedrooms
- Bathrooms: 1 full bath, 1 half bath
- Heating & cooling: No heating specified; No cooling specified
- Interior features: Eat-in kitchen; Unfinished basement; Fireplace (1)
- Laundry & utility: Laundry in basement
Neighborhood map
What this means for you Summary
Snapshot
- This is a 3-bed/1.0-bath single-family listed at $100k.
Deal economics
- At list price, monthly cash flow is $559 ($7k/yr) — positive.
- The deal already cash-flows at list — no discount required.
- Meets the 1% rule at list price ($2k rent vs $100k).
- Cap rate 13.0% vs local median 3.9% in Kansas City — top-decile yield for the area; either an underpriced asset or a hidden risk that comps aren't pricing in. Stress-test before assuming the spread holds.
Location & tenants
- Location reads 78/100 on livability (#28 in MO, #2,671 nationally) — a middle-class / working-renter tenant base. Strengths: amenities A+, commute A+, cost of living A+; Watch: crime F.
- Kansas City 33 (urban): math 12% / reading 24% proficiency, ranked #308 of 324 in MO (top 95%) — low school quality limits family demand, transient renter base, plan for 1-2y turnover; 75% free/reduced lunch — lower-income household profile, screen leases tightly.
- Zoned schools: Ac Prep Elementary (math 12% / reading 27%, grade F, #941 of 1,115 statewide, top 86%, 341 students, 99% FRL); Central Middle School (math 0% / reading 9%, grade F, #388 of 391 statewide, top 99%, 428 students, 99% FRL); Southeast High School (math 2% / reading 12%, grade F, #512 of 521 statewide, top 99%, 487 students, 99% FRL) — zoned schools average 99% FRL vs 75% district-wide (24 pts higher); higher-poverty schools than district average — tighter screening recommended.
- Market conditions: Rents rising (+3.0%/yr); 94 active listings in the ZIP; 31 comparable units currently listed for rent nearby; rentals at typical pace (median 23d on market — plan ~3-4 weeks tenant-placement turnaround); 4,002 units permitted in Jackson County in 2024 (2,271 in 5+ unit buildings).
- This rent runs 40% of the median local income ($46k/yr) — at the standard rent-burdened threshold; future hikes will face affordability resistance.
Forward outlook
- In year one you build about $11k of equity ($692 loan paydown + $10k appreciation (10.0% local appreciation)).
- Jackson County population projected at +4% by 2050 — modest demand growth; plan on rents tracking national, not racing it.
- At projected returns (10.0% appreciation + 3.0% rent growth), your $28k cash investment doubles in ~2 years — after that, you're playing with house money.
- By year 4, paydown + projected appreciation supports a ~$38k cash-out refi (75% LTV) — recoverable capital for the next deal without selling this one.
Negotiation context
- Only 2 days on market — expect competitive offers; lowballing is unlikely to land.
Risks & watch-outs
- Watch-outs: built in 1929 — expect roof / HVAC / electrical / plumbing capex.
Questions for the listing agent
- Built in 1929 — when were the roof, HVAC, electrical panel, plumbing, and water heater last replaced?
- Is there a deadline driving the sale (1031 exchange, divorce, estate, relocation)? That informs how much negotiation room exists.
- Crime grade is F in this area — have there been break-ins, vandalism, or insurance claims at this property in the last 3 years? What carrier currently insures it and at what premium?
- What's the average days-on-market for RENTAL listings here right now (not sales)? A rising rental-DOM trend means longer vacancies and softer asking-rent achievability than the comps imply.
- What's the recent tenant-quality profile in this submarket — average credit score on applications, eviction rate, late-payment / NSF rate, and stable-employment percentage? A property-management company in the area should have these aggregated.
- How much new for-sale + rental construction is in the pipeline within 1–3 miles? Heavy new supply typically softens prices + rents 12–24 months out; constrained supply supports both.
Investment metrics
- 1% rule
- 1.52% ✓
- Cap rate
- 13.00%
- Cash-on-cash
- 23.97%
- DSCR
- 2.07
- GRM
- 5.5
CMA / ARV
- ARV (on-the-fly)
- $160,170
- Comps found
- 12
Show comp detail 12 sales within ~0.75 mi
| Address | Dist | Beds/Ba | Sqft | Sold | Price | $/sf | Match |
|---|---|---|---|---|---|---|---|
| 2801 E 67 St | 0.35mi | 3/2.0 | 1,677 (-0%) | 8mo | $179,000 | $107 | 72 |
| 6632 Brooklyn Ave | 0.10mi | 4/1.5 (+1) | 1,800 (+7%) | 9mo | $85,000 | $47 | 70 |
| 2321 E Meyer Blvd | 0.17mi | 3/2.0 | 1,527 (-9%) | 4mo | $250,000 | $164 | 69 |
| 1835 E 68th Ter | 0.24mi | 4/1.5 (+1) | 1,761 (+4%) | 11mo | $159,000 | $90 | 65 |
| 6832 Paseo Blvd | 0.19mi | 3/2.0 | 1,850 (+10%) | 8mo | $125,000 | $68 | 64 |
| 2232 E 69th St | 0.16mi | 3/1.5 | 1,434 (-15%) | 8mo | $200,000 | $139 | 59 |
| 2235 E 67th St | 0.08mi | 4/2.0 (+1) | 1,893 (+12%) | 9mo | $179,000 | $95 | 59 |
| 6418 S Benton Ave | 0.55mi | 4/2.0 (+1) | 1,735 (+3%) | 7mo | $219,900 | $127 | 54 |
| 6435 Walrond Ave | 0.69mi | 2/2.0 (-1) | 1,624 (-4%) | 4mo | $134,500 | $83 | 49 |
| 7327 Park Ave | 0.74mi | 3/1.5 | 1,596 (-5%) | 7mo | $220,000 | $138 | 49 |
| 7115 Bellefontaine Ave | 0.71mi | 2/2.0 (-1) | 1,875 (+11%) | 3mo | $70,900 | $38 | 36 |
| 1417 E 72nd St | 0.74mi | 3/2.5 | 1,502 (-11%) | 14mo | $109,900 | $73 | 30 |
Match score weights: distance 35% · size 25% · config 20% · recency 20%. Top-matched comps best support the ARV.
Projected returns pro-forma
10.0% appreciation · 2.98% rent growth · sell at horizon
- IRR
- 42.3%
- Equity multiple
- 4.22×
- Total profit
- $89,999
- Equity at exit
- $90,043
- IRR
- 36.5%
- Equity multiple
- 9.47×
- Total profit
- $236,956
- Equity at exit
- $194,181
Cash invested: $27,986 (down + closing). Projections, not guarantees.
Landlord ↔ Tenant lean methodology
- Overall (STATE)
- 81 Strongly Landlord-Friendly
- State Missouri
- 81 Strongly Landlord-Friendly · R+10
- County
- — inherits STATE
- City
- — inherits STATE
ZIP-level market 64132
- Home prices YoY
- 23.6%
- Rents YoY
- 3.0%
- Active inventory
- 94
- Price-to-rent
- 5.5×
Monthly cashflow live
- Estimated rent
- $1,517 high interval (Pro) →
- Mortgage (P&I)
- −$524
- Tax from tax record
- −$74 /mo · $885/yr
- Insurance
- −$42
- HOA
- −$0
- Vacancy / Maint / Mgmt
- −$319
- Net cashflow
- $559
Break-even live
Sensitivity live
| Price | -10% $616 | -5% $587 | +0% $559 | +5% $531 | +10% $502 |
|---|---|---|---|---|---|
| Rent | -10% $439 | -5% $499 | +0% $559 | +5% $619 | +10% $679 |
| Rate | -1.0pp $609 | -0.5pp $584 | base $559 | +0.5pp $533 | +1.0pp $507 |
UW: 25.0% down · 7.5% · 30yr · 1.5% tax · 5.0% vac · 8.0% maint · 8.0% mgmt
Financing live
Cash to close
- Down payment
- $24,988
- Closing costs
- $2,998
- Reserves months
- —
- Total cash needed
- —
Loan-product check · same deal, 3 products live
Conventional
25% down · 7.5% · 30yr
- Down + closing
- —
- Monthly P&I
- —
- Monthly cashflow
- —
- DSCR
- —
- Eligible?
- —
Personal DTI + credit; lowest rate.
DSCR
20% down · 8.5% · 30yr
- Down + closing
- —
- Monthly P&I
- —
- Monthly cashflow
- —
- DSCR
- —
- Eligible?
- —
No personal income docs; deal must DSCR.
Hard money
10% down · 12.0% · 12mo
- Down + closing
- —
- Monthly P&I
- —
- Monthly cashflow
- —
- DSCR
- —
- Eligible?
- —
Short-term bridge; refi at stabilization.
Rent comps 31 comps
| Address | Beds | Baths | Sqft | Rent | $/sqft | DOM | Units | Dist |
|---|---|---|---|---|---|---|---|---|
| 2237 E 67th St Kansas City, MO | 4.0 | 1.0 | 1300 | $1,500 | $1.15 | 17d | 1 | 0.09mi |
| 1850 E 68th Ter Kansas City, MO | 4.0 | 2.0 | 1400 | $1,600 | $1.14 | 17d | 1 | 0.21mi |
| 1805 E 67th St Kansas City, MO | 2.0 | 1.0 | 1064 | $1,200 | $1.13 | 17d | 1 | 0.31mi |
| 7022 S Benton Ave Kansas City, MO | 3.0 | 1.5 | 1100 | $1,095 | $1.00 | 16d | 1 | 0.50mi |
| 6431 S Benton Ave Kansas City, MO | 3.0 | 1.0 | 1160 | $1,225 | $1.06 | 25d | 1 | 0.55mi |
| 6812 College Ave Kansas City, MO | 4.0 | 2.0 | 1152 | $1,795 | $1.56 | 25d | 1 | 0.61mi |
| 7133 Agnes Ave Kansas City, MO | 3.0 | 2.0 | 1100 | $1,645 | $1.50 | 25d | 1 | 0.66mi |
| 2607 E 73rd St Kansas City, MO | 2.0 | 1.0 | 1212 | $1,050 | $0.87 | 25d | 1 | 0.70mi |
| 7240 Agnes Ave Kansas City, MO | 3.0 | 1.0 | 1140 | $1,350 | $1.18 | 3d | 1 | 0.76mi |
| 6821 Bales Ave Kansas City, MO | 3.0 | 1.5 | 1430 | $1,595 | $1.12 | 21d | 1 | 0.76mi |
| 7316 Paseo Blvd Kansas City, MO | 3.0 | 1.5 | 1882 | $1,523 | $0.81 | 45d | 1 | 0.77mi |
| 6328 College Ave Kansas City, MO | 3.0 | 1.5 | 1856 | $1,399 | $0.75 | 5d | 1 | 0.79mi |
| 1702 Bushman Dr Kansas City, MO | 1.0–2.0 | 1.0–2.0 | 895 | $1,065 | $1.19 | 45d | 1 | 0.88mi |
| 6551 Rockhill Rd Kansas City, MO | 1.0–2.0 | 1.0–2.0 | 912 | $2,128 | $2.33 | 3d | 10 | 0.96mi |
| 1827 E 75th Ter Kansas City, MO | 3.0 | 1.5 | 1700 | $1,595 | $0.94 | 17d | 1 | 1.01mi |
| 822 E 72nd St Kansas City, MO | 3.0 | 3.0 | 1800 | $2,400 | $1.33 | 22d | 1 | 1.03mi |
| 6720 Holmes Rd Kansas City, MO | 3.0 | 3.0 | 1552 | $2,695 | $1.74 | 45d | 1 | 1.08mi |
| 7426 Indiana Ave Kansas City, MO | 3.0 | 1.0 | 1100 | $1,400 | $1.27 | 45d | 1 | 1.09mi |
| 6014 Virginia Ave Kansas City, MO | 2.0 | 1.0 | 1072 | $1,111 | $1.04 | 9d | 1 | 1.11mi |
| 6227 Rockhill Rd Kansas City, MO | 4.0 | 2.0 | 2076 | $1,995 | $0.96 | 25d | 1 | 1.12mi |
| 5824 Wabash Ave Kansas City, MO | 3.0 | 1.0 | 1276 | $1,050 | $0.82 | 45d | 1 | 1.13mi |
| 1836 E 77th St Kansas City, MO | 2.0 | 1.0 | 1200 | $1,150 | $0.96 | 22d | 1 | 1.18mi |
| 5801 Wabash Ave Kansas City, MO | 3.0 | 1.0 | 1200 | $1,200 | $1.00 | 45d | 1 | 1.19mi |
| 2811 E 58th St Kansas City, MO | 4.0 | 1.0 | 1348 | $1,473 | $1.09 | 45d | 1 | 1.22mi |
| 5712 Garfield Ave Kansas City, MO | 4.0 | 2.0 | 2200 | $1,900 | $0.86 | 18d | 1 | 1.29mi |
| 5708 Euclid Ave Kansas City, MO | 4.0 | 2.0 | 1350 | $1,600 | $1.19 | 17d | 1 | 1.30mi |
| 5752 College Ave Kansas City, MO | 4.0 | 1.0 | 1120 | $1,600 | $1.43 | 18d | 1 | 1.33mi |
| 224 E Winthrope Rd Kansas City, MO | 3.0 | 2.0 | 2000 | $2,350 | $1.18 | 3d | 1 | 1.40mi |
| 3861 E 60th St Kansas City, MO | 3.0 | 2.0 | 1491 | $1,250 | $0.84 | 4d | 1 | 1.44mi |
| 4211 E 61st St Kansas City, MO | 2.0 | 1.5 | 1220 | $1,500 | $1.23 | 45d | 1 | 1.46mi |
| 5531 Euclid Ave Kansas City, MO | 3.0 | 1.0 | 1135 | $1,300 | $1.15 | 45d | 1 | 1.49mi |
Listing history 3 events
-
2026-06-15statusdays on market $99,950 Pending 2 DOM
-
2026-06-13remarks 699-char remark
-
2026-06-13$99,950 Active 1 DOM
ⓘ Source: listings_history table (triggers on properties + properties_extension) + one-shot
backfill from property_details.listing_events for pre-trigger history.
Tax reassessment forecast MO · Resets to sale price
- Current annual tax
- $885 · $74/mo
- Projected year-2 tax
- $970 · $81/mo
- Expected delta
- +$84/yr (+$7/mo · 9.5%)
ⓘ Screening estimate from a state-policy table — verify with the county assessor before closing.
Climate risk First Street
- Flood 1/10 Low FEMA zone X (unshaded) · 0% chance over 30 yrs
- Wildfire 1/10 Low
- Heat 4/10 Moderate 7 d/yr ≥106°F today · 17 d/yr by 30 yrs out
- Wind 2/10 Low
- Air quality 3/10 Moderate 2 unhealthy d/yr today · 4 by 30 yrs out
Nearby sold comps map
Loading sold comps map…
Walkable amenities ~0.75 mi
Loading nearby amenities…
Taxation est. · year 1
- Rental income
- $18,206
- − Mortgage interest
- −$5,599
- − Property taxes
- −$885
- − Insurance
- −$500
- − Repairs & maintenance
- −$1,456
- − Management
- −$1,456
- − Depreciation
- −$2,908
- Taxable income
- $5,402
- Est. tax owed @ 24.0%
- −$1,296
- After-tax cash flow
- $5,412/yr
For passive investors: Depreciation is non-cash, so a rental often shows a tax loss while cash-flowing — sheltering income. Rental losses are passive: they offset passive income freely, and up to $25,000/yr can offset ordinary (W-2) income if you actively participate and your MAGI is under $100k (phasing out to $0 by $150k); unused losses carry forward. On sale, claimed depreciation is recaptured at up to 25%, and gains may owe capital-gains tax (a 1031 exchange can defer both). Figures are a year-1 estimate at your 24.0% rate — not tax advice; consult a CPA.
Schools (NCES district)
- District
- Kansas City 33
- NCES district ID
- 2916400
- Math proficiency
- 12% ▼ -8.00%
- Reading proficiency
- 24% ▬ 0.00%
- Median HH income
- $35,227
- Composite
- 14.8/100
- National rank
- #9387
- State rank
- #308 of 324 in MO
Livability — Kansas City
- Score
- 78/100
- State rank
- #28
- US rank
- #2671
Category grades
Schools grade is shown separately in the Schools card above.
Census & demographics
- Census place
- Kansas City, MO
- County
- Jackson County · 687,798 people
- City population
- 439,467
- Metro
- Kansas City, MO-KS
- Population (ZIP)
- 12,084
- Household income
- $45,622
- Rent vs Own
- Severe rent burden
- 679.0
Population outlook (Jackson County) Hauer SSP2
- Today (2025)
- 719,589 people
- By 2030
- 731,456 · +1.6%
- By 2040
- 746,689 · +3.8%
- By 2050
- 749,289 · +4.1%
- By 2075
- 736,227 · +2.3%
- By 2100
- 668,210 · -7.1%
Race, ethnicity, and origin ACS 2023
- Neighborhood character
- Predominantly Black (66%)
- Race & ethnicity
- Black 66% White 16% Hispanic / Latino 11% Two or more races 10%
- Hispanic origin (detail)
- Mexican 9%
- Common ancestry
- Italian 2% Scotch-Irish 1% Romanian 1%
- Foreign-born
- 6% · Canada, Jamaica
- Languages at home
- 92% English-only · Spanish 7%
Political lean MEDSL · Jackson
- 2024 margin
- D (+19.3) · D 58.9% · R 39.5% · Other 1.6%
- 2008→2024 swing
- -6.1pp toward R · 2008: 25.4pp · 2024: 19.3pp
- All cycles
- 2024: D+19.3 2020: D+22.0 2016: D+16.6 2012: D+19.0 2008: D+25.4
Not yet ingested
- Civics
- —
Market trends
- HPI YoY
- ▲ 79.13%
- Current HPI
- 414.4305
- Rent YoY
- ▲ 2.98%
- Metro
- Kansas City, MO-KS
- State GDP YoY
- ▲ 1.84%
- F500 in state
- 20
Industry mix (Fortune 500 HQ in MO)
| Industry | F500 HQs | Revenue |
|---|---|---|
| Healthcare | 1 | $163B |
|
||
| Insurance | 1 | $21B |
|
||
| Industrial Technology | 1 | $17B |
|
||
| Retail | 1 | $16B |
|
||
| Industrial Distribution | 1 | $10B |
|
||
| Utilities | 1 | $9B |
|
||
Price history
3 events — show timeline
- 2026-06-12 Listed $99,950 Heartland MLS as Distributed by MLS Grid
- 2013-08-27 Sold (Public Records) — Public Records
- 1987-11-04 Sold (Public Records) — Public Records
Property tax history
+4.9%/yrLatest (2025): $885 · -31.8% YoY. Source: county tax records.
Cash-flow waterfall
monthlySold comps — $/sqft
last 12 mo · ≤1 miLoading sold comps…