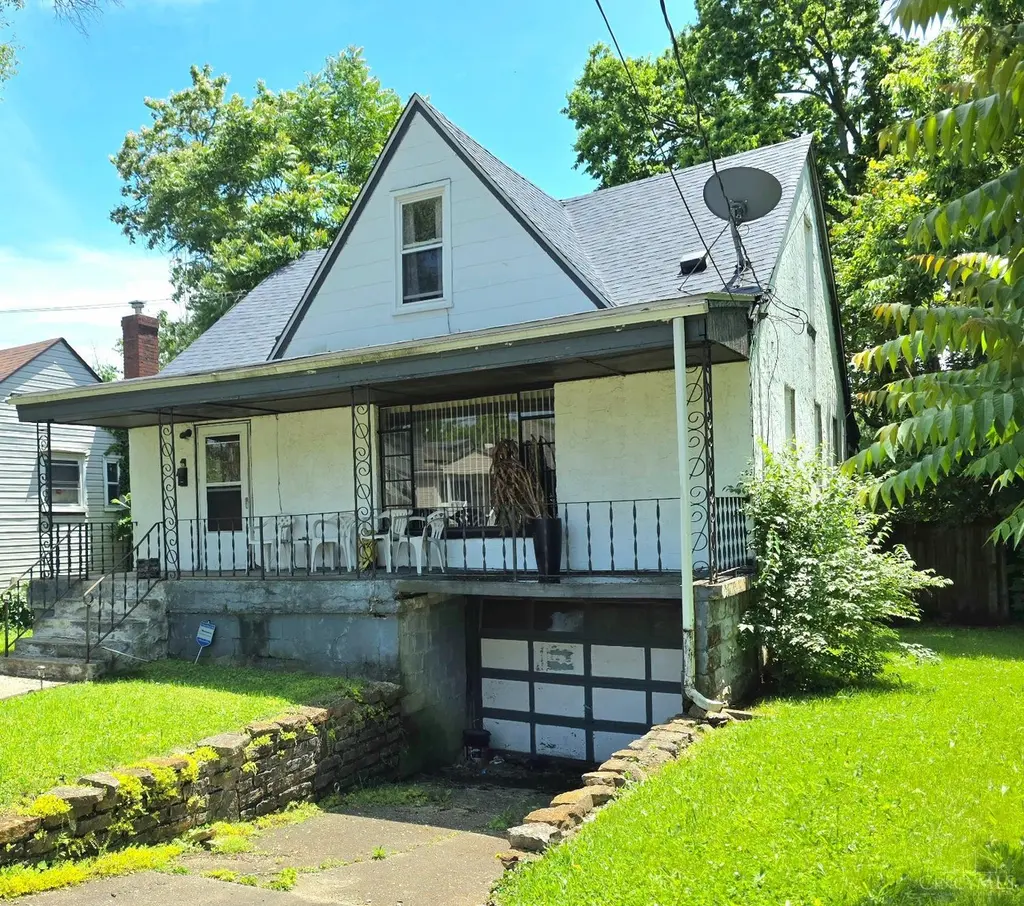
1001 Byrd Ave · Lincoln Heights, OH
Flood risk 1/10 · Minimal
- FEMA flood zone
- X (unshaded)
- Chance of flooding over 30 yrs
- 0.0%
- Est. flood insurance / yr
- $473 – $860
Fire risk 1/10 · Minimal
- Est. fire insurance / yr
- $713 – $1,323
Heat risk 4/10 · Minor
- Hot days now (above 103°F)
- 7 days/yr
- Hot days in 30 yrs
- 18 days/yr
Wind risk 2/10 · Minimal
- Chance of severe wind over 30 yrs
- 1.0%
Air-quality risk 3/10 · Minor
- Unhealthy air days now
- 2 days/yr
- Unhealthy air days in 30 yrs
- 3 days/yr
Risk factors via First Street. Map © Google.
Why this score? — see what drove the B grade
The composite is a weighted blend of 9 inputs, each scored 0–100. Each bar is that input's sub-score; the figure is the points it added to the 100-point composite (weight × sub-score).
- Cash flow +30.0/30.0
- 1% rule +10.0/10.0
- DSCR +10.0/10.0
- ARV discount +7.5/15.0
- Rent growth +4.5/5.0
- Livability +3.5/5.0
- Schools +3.4/10.0
- Condition / age +2.5/5.0
- Appreciation +0.0/10.0
$100,000
🖨 Deal sheet 📄 Offer letter ✓ Due diligence
Listing remarks
This mid century home has only had two owners and now it's ready for a third! Will some sweat equity and tlc, this could be your opportunity for a rental property or your own home in a centrally located historical Cincinnati suburb. An open floor plan and lots of space make the possibilities endless. * * This home will not qualify for VA or FHA financing * *
Key facts
- 4,182 sq ft lot
- Garage
- Built 1947
Property features AI
Finance
- Other: Lease not considered
- HOA & community: No HOA
Exterior
- Parking: Built-in garage with 1 garage space
- Utilities: Water at street; Gas at street; Public sewer
- Home design: Traditional single-family home; Two stories; Second floor contains bedrooms
- Construction: Stucco exterior; Block foundation; Shingle/composition roof; Second floor area approximately 717 sq ft
- Exterior features: Vinyl windows; Less than 0.5 acre lot; Residential zoning; City street access
Interior
- Kitchen: Wood cabinets; Oven/Range; Refrigerator
- Bedrooms: Three bedrooms, all on the second floor
- Flooring: Wood floors in living and dining areas
- Bathrooms: One full bathroom on the second floor (tub); One half bathroom on the first floor
- Heating & cooling: Forced air heating; Central air conditioning; Gas water heating
- Interior features: Six total rooms; Full unfinished basement
- Laundry & utility: Basement utility space
Neighborhood map
What this means for you Summary
Snapshot
- This is a 3-bed/1.5-bath single-family listed at $100k.
Deal economics
- At list price, monthly cash flow is $739 ($9k/yr) — positive.
- The deal already cash-flows at list — no discount required.
- Meets the 1% rule at list price ($2k rent vs $100k).
Location & tenants
- Location reads 69/100 on livability (#534 in OH) — a middle-class / working-renter tenant base. Strengths: commute A+, cost of living A+, crime B+; Watch: housing D, schools D-, amenities F.
- Princeton City (suburban): math 34% / reading 43% proficiency, ranked #542 of 656 in OH (top 83%) — families likely to look elsewhere, expect single-tenant / working-renter base with shorter leases.
- Market conditions: Rents rising fast (+8.0%/yr); 47 active listings in the ZIP; 3 comparable units currently listed for rent nearby; rentals at typical pace (median 17d on market — plan ~3-4 weeks tenant-placement turnaround); 801 units permitted in Hamilton County in 2024 (190 in 5+ unit buildings).
- This rent runs 33% of the median local income ($69k/yr) — at the standard rent-burdened threshold; future hikes will face affordability resistance.
Forward outlook
- Local home prices are declining (-3.0%/yr); year-one equity from $691 of loan paydown is wiped out by about $3k of value loss. Plan a longer hold.
- At projected returns (-3.0% appreciation + 8.0% rent growth), your $28k cash investment doubles in ~4 years — after that, you're playing with house money.
Negotiation context
- Only 8 days on market — expect competitive offers; lowballing is unlikely to land.
Risks & watch-outs
- Watch-outs: built in 1947 — expect roof / HVAC / electrical / plumbing capex.
Questions for the listing agent
- Built in 1947 — when were the roof, HVAC, electrical panel, plumbing, and water heater last replaced?
- Is there a deadline driving the sale (1031 exchange, divorce, estate, relocation)? That informs how much negotiation room exists.
- Schools are D-rated, which usually means shorter tenancies and higher turnover. Who's the typical renter profile here, and what's been the actual vacancy rate?
- What's the average days-on-market for RENTAL listings here right now (not sales)? A rising rental-DOM trend means longer vacancies and softer asking-rent achievability than the comps imply.
- What's the recent tenant-quality profile in this submarket — average credit score on applications, eviction rate, late-payment / NSF rate, and stable-employment percentage? A property-management company in the area should have these aggregated.
- How much new for-sale + rental construction is in the pipeline within 1–3 miles? Heavy new supply typically softens prices + rents 12–24 months out; constrained supply supports both.
Investment metrics
- 1% rule
- 1.89% ✓
- Cap rate
- 15.17%
- Cash-on-cash
- 31.69%
- DSCR
- 2.41
- GRM
- 4.4
CMA / ARV
- ARV (on-the-fly)
- $267,732
- Comps found
- 10
Show comp detail 10 sales within ~0.75 mi
| Address | Dist | Beds/Ba | Sqft | Sold | Price | $/sf | Match |
|---|---|---|---|---|---|---|---|
| 411 Jonte Ave | 0.38mi | 4/2.5 (+1) | 1,806 (-0%) | 19mo | $267,500 | $148 | 57 |
| 1040 Burns Ave | 0.67mi | 3/2.5 | 1,936 (+7%) | 0mo | $390,000 | $201 | 53 |
| 119 Eggerding Dr | 0.69mi | 3/2.0 | 1,890 (+4%) | 7mo | $212,000 | $112 | 52 |
| 1201 Dixie Ct | 0.45mi | 3/2.5 | 1,558 (-14%) | 2mo | $225,000 | $144 | 51 |
| 329 Westview Ave | 0.55mi | 3/1.5 | 1,624 (-10%) | 12mo | $225,500 | $139 | 47 |
| 313 Jonte Ave | 0.41mi | 2/1.5 (-1) | 1,607 (-11%) | 12mo | $213,000 | $133 | 47 |
| 1019 Crosley Ave | 0.65mi | 3/1.5 | 2,051 (+13%) | 3mo | $354,000 | $173 | 44 |
| 504 N Cooper Ave | 0.52mi | 4/1.5 (+1) | 1,539 (-15%) | 4mo | $185,000 | $120 | 42 |
| 23 North Ave | 0.65mi | 3/2.5 | 1,598 (-12%) | 9mo | $410,000 | $257 | 39 |
| 1125 Burns Ave | 0.61mi | 4/2.0 (+1) | 1,616 (-11%) | 21mo | $320,000 | $198 | 29 |
Match score weights: distance 35% · size 25% · config 20% · recency 20%. Top-matched comps best support the ARV.
Projected returns pro-forma
-3.0% appreciation · 8.0% rent growth · sell at horizon
- IRR
- 32.4%
- Equity multiple
- 2.46×
- Total profit
- $40,955
- Equity at exit
- $14,910
- IRR
- 42.2%
- Equity multiple
- 6.07×
- Total profit
- $142,093
- Equity at exit
- $8,646
Cash invested: $28,000 (down + closing). Projections, not guarantees.
Landlord ↔ Tenant lean methodology
- Overall (STATE)
- 73 Landlord-Friendly
- State Ohio
- 73 Landlord-Friendly · R+6
- County
- — inherits STATE
- City
- — inherits STATE
ZIP-level market 45215
- Rents YoY
- 8.0%
- Active inventory
- 47
- Price-to-rent
- 4.4×
Monthly cashflow live
- Estimated rent
- $1,892 medium interval (Pro) →
- Mortgage (P&I)
- −$524
- Tax from tax record
- −$189 /mo · $2,274/yr
- Insurance
- −$42
- HOA
- −$0
- Vacancy / Maint / Mgmt
- −$397
- Net cashflow
- $739
Break-even live
UW: 25.0% down · 7.5% · 30yr · 1.5% tax · 5.0% vac · 8.0% maint · 8.0% mgmt
Financing live
Cash to close
- Down payment
- $25,000
- Closing costs
- $3,000
- Reserves months
- —
- Total cash needed
- —
Loan-product check · same deal, 3 products live
Conventional
25% down · 7.5% · 30yr
- Down + closing
- —
- Monthly P&I
- —
- Monthly cashflow
- —
- DSCR
- —
- Eligible?
- —
Personal DTI + credit; lowest rate.
DSCR
20% down · 8.5% · 30yr
- Down + closing
- —
- Monthly P&I
- —
- Monthly cashflow
- —
- DSCR
- —
- Eligible?
- —
No personal income docs; deal must DSCR.
Hard money
10% down · 12.0% · 12mo
- Down + closing
- —
- Monthly P&I
- —
- Monthly cashflow
- —
- DSCR
- —
- Eligible?
- —
Short-term bridge; refi at stabilization.
Rent comps 3 comps
| Address | Beds | Baths | Sqft | Rent | $/sqft | DOM | Units | Dist |
|---|---|---|---|---|---|---|---|---|
| 911 Prairie Ave Cincinnati, OH | 4.0 | 1.0 | 1243 | $1,995 | $1.60 | 7d | 1 | 0.69mi |
| 301 W Benson St Unit 6 Cincinnati, OH | 3.0 | 2.0 | 1500 | $1,995 | $1.33 | 43d | 1 | 1.34mi |
| 332 Arlington Ave Cincinnati, OH | 3.0 | 2.0 | 1500 | $1,750 | $1.17 | 17d | 1 | 1.39mi |
Listing history 7 events
-
2026-06-18days on market $100,000 Active 8 DOM
-
2026-06-17days on market $100,000 Active 7 DOM
-
2026-06-16days on market $100,000 Active 6 DOM
-
2026-06-15days on market $100,000 Active 5 DOM
-
2026-06-13days on market $100,000 Active 3 DOM
-
2026-06-13remarks 363-char remark
-
2026-06-13$100,000 Active 2 DOM
ⓘ Source: listings_history table (triggers on properties + properties_extension) + one-shot
backfill from property_details.listing_events for pre-trigger history.
Tax reassessment forecast OH · Partial reset (capped growth)
- Current annual tax
- $2,274 · $189/mo
- Projected year-2 tax
- $2,274 · $189/mo
- Expected delta
- $0/yr ($0/mo · 0.0%)
ⓘ Screening estimate from a state-policy table — verify with the county assessor before closing.
Climate risk First Street
- Flood 1/10 Low FEMA zone X (unshaded) · 0% chance over 30 yrs
- Wildfire 1/10 Low
- Heat 4/10 Moderate 7 d/yr ≥103°F today · 18 d/yr by 30 yrs out
- Wind 2/10 Low 100% chance of damaging wind over 30 yrs
- Air quality 3/10 Moderate 2 unhealthy d/yr today · 3 by 30 yrs out
Nearby sold comps map
Loading sold comps map…
Walkable amenities ~0.75 mi
Loading nearby amenities…
Taxation est. · year 1
- Rental income
- $22,708
- − Mortgage interest
- −$5,602
- − Property taxes
- −$2,274
- − Insurance
- −$500
- − Repairs & maintenance
- −$1,817
- − Management
- −$1,817
- − Depreciation
- −$2,909
- Taxable income
- $7,790
- Est. tax owed @ 24.0%
- −$1,870
- After-tax cash flow
- $7,003/yr
For passive investors: Depreciation is non-cash, so a rental often shows a tax loss while cash-flowing — sheltering income. Rental losses are passive: they offset passive income freely, and up to $25,000/yr can offset ordinary (W-2) income if you actively participate and your MAGI is under $100k (phasing out to $0 by $150k); unused losses carry forward. On sale, claimed depreciation is recaptured at up to 25%, and gains may owe capital-gains tax (a 1031 exchange can defer both). Figures are a year-1 estimate at your 24.0% rate — not tax advice; consult a CPA.
Schools (NCES district)
- District
- Princeton City
- NCES district ID
- 3904467
- Math proficiency
- 34% ▼ -18.00%
- Reading proficiency
- 43% ▼ -8.00%
- Median HH income
- $53,182
- Composite
- 33.52/100
- National rank
- #5436
- State rank
- #542 of 656 in OH
Livability — Lincoln Heights
- Score
- 69/100
- State rank
- #534
- US rank
- #9027
Category grades
Schools grade is shown separately in the Schools card above.
Census & demographics
- Census place
- Lincoln Heights, OH
- County
- Hamilton County · 701,295 people
- Metro
- Cincinnati, OH-KY-IN
- Population (ZIP)
- 30,586
- Household income
- $69,372
- Rent vs Own
- Severe rent burden
- 1529.0
Population outlook (Hamilton County) Hauer SSP2
- Today (2025)
- 826,054 people
- By 2030
- 830,947 · +0.6%
- By 2040
- 832,319 · +0.8%
- By 2050
- 822,428 · -0.4%
- By 2075
- 788,688 · -4.5%
- By 2100
- 710,674 · -14.0%
Race, ethnicity, and origin ACS 2023
- Neighborhood character
- Majority White (63%)
- Race & ethnicity
- White 63% Black 26% Two or more races 6% Hispanic / Latino 3% Asian 2%
- Common ancestry
- Italian 3% Slovak 2% Lithuanian 1%
- Foreign-born
- 4% · Canada
- Languages at home
- 95% English-only · Spanish 2% Other Indo-European 1% French/Haitian/Cajun 1%
Political lean MEDSL · Hamilton
- 2024 margin
- D (+14.9) · D 57.0% · R 42.1%
- 2008→2024 swing
- +7.9pp toward D · 2008: 7.0pp · 2024: 14.9pp
- All cycles
- 2024: D+14.9 2020: D+15.9 2016: D+9.5 2012: D+4.9 2008: D+7.0
Not yet ingested
- Civics
- —
Market trends
- HPI YoY
- ▼ -263.50%
- Current HPI
- 217.3319
- Rent YoY
- ▲ 8.02%
- Metro
- Cincinnati, OH-KY-IN
- State GDP YoY
- ▲ 1.98%
- F500 in state
- 48
Industry mix (Fortune 500 HQ in OH)
| Industry | F500 HQs | Revenue |
|---|---|---|
| Insurance | 3 | $145B |
|
||
| Industrial Machinery | 3 | $49B |
|
||
| Financial Services | 3 | $24B |
|
||
| Consumer Goods | 2 | $93B |
|
||
| Aerospace / Defense | 2 | $47B |
|
||
| Utilities | 2 | $33B |
|
||
Price history
1 event — show timeline
- 2026-06-10 Listed $100,000 Cincy MLS
Property tax history
+7.3%/yrLatest (2025): $2,274 · +20.9% YoY. Source: county tax records.
Cash-flow waterfall
monthlySold comps — $/sqft
last 12 mo · ≤1 miLoading sold comps…