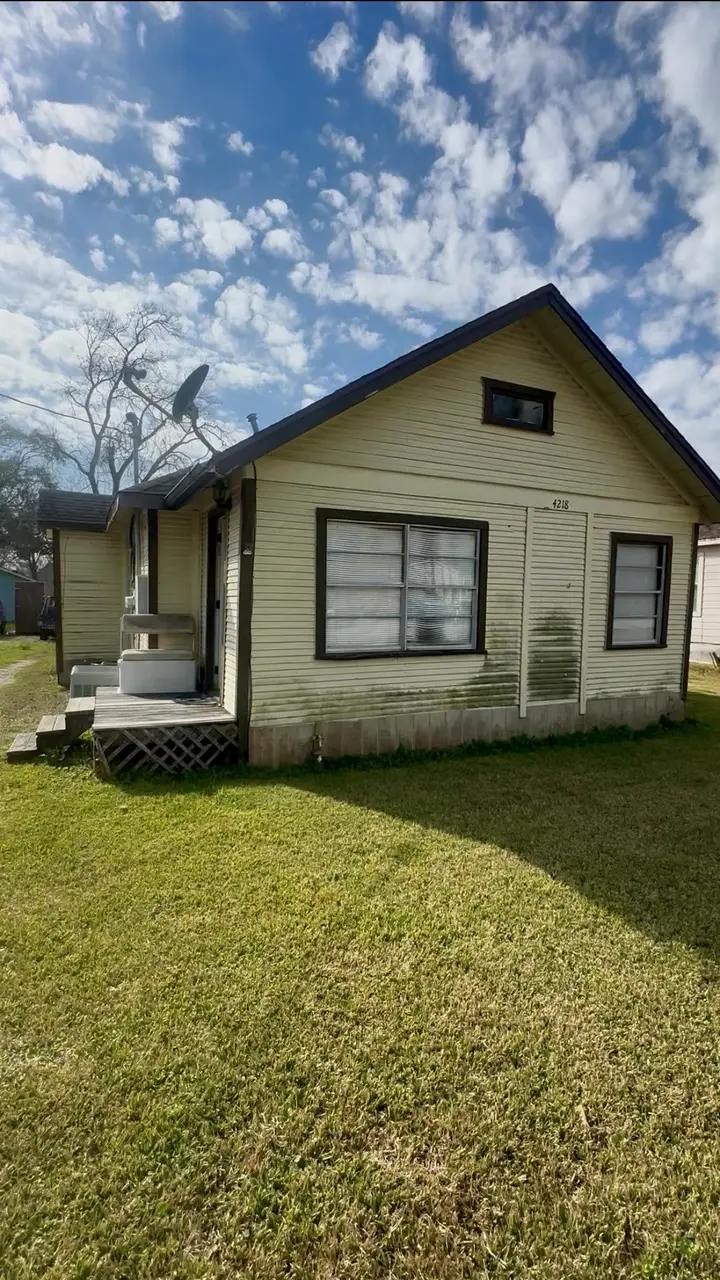
4218 Brown St · Bacliff, TX
Flood risk 7/10 · Major
- FEMA flood zone
- X (shaded)
- Chance of flooding over 30 yrs
- 0.72%
- Est. flood insurance / yr
- $507 – $1,088
Fire risk 1/10 · Minimal
- Est. fire insurance / yr
- $1,222 – $2,270
Heat risk 10/10 · Severe
- Hot days now (above 109°F)
- 7 days/yr
- Hot days in 30 yrs
- 26 days/yr
Wind risk 9/10 · Severe
- Chance of severe wind over 30 yrs
- 99.0%
Air-quality risk 2/10 · Minimal
- Unhealthy air days now
- 1 days/yr
- Unhealthy air days in 30 yrs
- 1 days/yr
Risk factors via First Street. Map © Google.
Why this score? — see what drove the B+ grade
The composite is a weighted blend of 9 inputs, each scored 0–100. Each bar is that input's sub-score; the figure is the points it added to the 100-point composite (weight × sub-score).
- Cash flow +30.0/30.0
- ARV discount +15.0/15.0
- 1% rule +10.0/10.0
- DSCR +10.0/10.0
- Schools +3.5/10.0
- Livability +2.9/5.0
- Rent growth +2.5/5.0
- Condition / age +2.5/5.0
- Appreciation +0.0/10.0
$85,000
🖨 Deal sheet (PDF) 📄 Offer letter ✓ Due diligence
Listing remarks MLS
This is a fantastic opportunity for investors, builders, or anyone looking to start fresh and build new. Utilities are already in place with electric and gas run to the property, saving you time and upfront costs. Close to the water, no restrictions and no HOA — giving you flexibility for new construction, rental potential, or other income-producing possibilities. Whether you’re looking to build your next project or add to your investment portfolio, this property offers endless potential. Don’t miss this rare opportunity to create value from the ground up!
Key facts
- Rental potential
- No restrictions
- Close to the water
Tags
Neighborhood map
What this means for you Summary
Snapshot
- This is a 2-bed/1.0-bath single-family listed at $85k.
Deal economics
- At list price, monthly cash flow is $715 ($9k/yr) — positive.
- The deal already cash-flows at list — no discount required.
- Meets the 1% rule at list price ($2k rent vs $85k).
- Recommended offer: $77k (9.0% below list) — sets the bar for market timing.
- Cap rate 17.3% vs local median 5.0% in Bacliff — top-decile yield for the area; either an underpriced asset or a hidden risk that comps aren't pricing in. Stress-test before assuming the spread holds.
Location & tenants
- Location reads 57/100 on livability (#1,252 in TX) — a working-class tenant base; expect higher turnover. Strengths: cost of living A+, housing A+; Watch: employment D+, crime D, schools F.
- Dickinson ISD (suburban): math 39% / reading 40% proficiency, ranked #366 of 826 in TX (top 44%) — families likely to look elsewhere, expect single-tenant / working-renter base with shorter leases; 60% free/reduced lunch — lower-income household profile, screen leases tightly.
- Market conditions: 62 active listings in the ZIP; 2 comparable units currently listed for rent nearby; 3,258 units permitted in Galveston County in 2024 (0 in 5+ unit buildings).
- This rent runs 41% of the median local income ($51k/yr) — at the standard rent-burdened threshold; future hikes will face affordability resistance.
Forward outlook
- Local home prices are declining (-3.0%/yr); year-one equity from $588 of loan paydown is wiped out by about $3k of value loss. Plan a longer hold.
- Galveston County population projected at +43% by 2050 — long-run rental-demand tailwind backs the buy-and-hold thesis.
- At projected returns (-3.0% appreciation + 3.0% rent growth), your $24k cash investment doubles in ~4 years — after that, you're playing with house money.
Negotiation context
- It's been on market 106 days — a 9% lower offer ($77k) is reasonable based on typical stale-listing flexibility.
Risks & watch-outs
- Watch-outs: flood insurance adds $66/mo.
- Climate carrying-cost: major flood risk; severe wind risk, 99% chance of damaging wind over 30y; extreme-heat days projected 7→26/yr by 2055 (HVAC capex compounding) — expect insurance premiums to compound above CPI over the hold.
Questions for the listing agent
- It's been on market 106 days. Have you received any prior offers? Is the seller open to a 9% concession, seller financing, or rate buy-down credit?
- Built in 1966 — when were the roof, HVAC, electrical panel, plumbing, and water heater last replaced?
- What's the actual annual flood-insurance premium (NFIP or private), and is the property in a SFHA with mandatory coverage?
- Why hasn't it sold? Are there any deal-killer items the seller is aware of (foundation, flood, title, zoning, code violations)?
- Is there a deadline driving the sale (1031 exchange, divorce, estate, relocation)? That informs how much negotiation room exists.
- Schools are F-rated, which usually means shorter tenancies and higher turnover. Who's the typical renter profile here, and what's been the actual vacancy rate?
- Crime grade is D in this area — have there been break-ins, vandalism, or insurance claims at this property in the last 3 years? What carrier currently insures it and at what premium?
- What's the average days-on-market for RENTAL listings here right now (not sales)? A rising rental-DOM trend means longer vacancies and softer asking-rent achievability than the comps imply.
- What's the recent tenant-quality profile in this submarket — average credit score on applications, eviction rate, late-payment / NSF rate, and stable-employment percentage? A property-management company in the area should have these aggregated.
- How much new for-sale + rental construction is in the pipeline within 1–3 miles? Heavy new supply typically softens prices + rents 12–24 months out; constrained supply supports both.
Investment metrics
- 1% rule
- 2.06% ✓
- Cap rate
- 17.32%
- Cash-on-cash
- 39.38%
- DSCR
- 2.75
- GRM
- 4.1
CMA / ARV
- ARV (median comp)
- $122,791
- List price
- $85,000
- Delta
- -30.78%
- Verdict
- UNDERPRICED
- Comps
- 20 within 1.0 mi
Show comp detail 7 sales within ~0.75 mi
| Address | Dist | Beds/Ba | Sqft | Sold | Price | $/sf | Match |
|---|---|---|---|---|---|---|---|
| 4111 Brown St | 0.10mi | 2/1.0 | 850 (+6%) | 10mo | $134,900 | $159 | 77 |
| 303 Texas Ave | 0.25mi | 2/1.0 | 832 (+4%) | 6mo | $132,900 | $160 | 77 |
| 4102 Houx St | 0.16mi | 2/1.0 | 840 (+4%) | 24mo | $159,900 | $190 | 65 |
| 4222 Sevan St | 0.29mi | 2/1.0 | 704 (-12%) | 15mo | $139,900 | $199 | 53 |
| 4705 8th St | 0.37mi | 1/1.0 (-1) | 880 (+10%) | 22mo | $385,000 | $438 | 43 |
| 4311 14th St | 0.37mi | 1/1.0 (-1) | 714 (-11%) | 21mo | $82,500 | $116 | 41 |
| 4730 Oleander St | 0.66mi | 3/1.0 (+1) | 915 (+14%) | 0mo | $135,000 | $148 | 41 |
Match score weights: distance 35% · size 25% · config 20% · recency 20%. Top-matched comps best support the ARV.
Projected returns pro-forma
-3.0% appreciation · 3.0% rent growth · sell at horizon
- IRR
- 31.8%
- Equity multiple
- 2.34×
- Total profit
- $31,811
- Equity at exit
- $12,674
- IRR
- 38.9%
- Equity multiple
- 4.64×
- Total profit
- $86,606
- Equity at exit
- $7,349
Cash invested: $23,800 (down + closing). Projections, not guarantees.
Landlord ↔ Tenant lean methodology
- Overall (STATE)
- 87 Strongly Landlord-Friendly
- State Texas
- 87 Strongly Landlord-Friendly · R+5
- County
- — inherits STATE
- City
- — inherits STATE
ZIP-level market 77518
- Home prices YoY
- -7.6%
- Active inventory
- 62
- Price-to-rent
- 4.1×
Monthly cashflow live
- Estimated rent
- $1,749 medium interval (Pro) →
- Mortgage (P&I)
- −$446
- Tax from tax record
- −$119 /mo · $1,430/yr
- Insurance
- −$35
- Flood insurance flood zone
- −$66 /mo · $798/yr
- HOA
- −$0
- Vacancy / Maint / Mgmt
- −$367
- Net cashflow
- $715
Break-even live
Sensitivity live
| Price | -10% $763 | -5% $739 | +0% $715 | +5% $690 | +10% $666 |
|---|---|---|---|---|---|
| Rent | -10% $576 | -5% $645 | +0% $715 | +5% $784 | +10% $853 |
| Rate | -1.0pp $757 | -0.5pp $736 | base $715 | +0.5pp $693 | +1.0pp $670 |
UW: 25.0% down · 7.5% · 30yr · 1.5% tax · 5.0% vac · 8.0% maint · 8.0% mgmt
Financing live
Cash to close
- Down payment
- $21,250
- Closing costs
- $2,550
- Reserves months
- —
- Total cash needed
- —
Loan-product check · same deal, 3 products live
Conventional
25% down · 7.5% · 30yr
- Down + closing
- —
- Monthly P&I
- —
- Monthly cashflow
- —
- DSCR
- —
- Eligible?
- —
Personal DTI + credit; lowest rate.
DSCR
20% down · 8.5% · 30yr
- Down + closing
- —
- Monthly P&I
- —
- Monthly cashflow
- —
- DSCR
- —
- Eligible?
- —
No personal income docs; deal must DSCR.
Hard money
10% down · 12.0% · 12mo
- Down + closing
- —
- Monthly P&I
- —
- Monthly cashflow
- —
- DSCR
- —
- Eligible?
- —
Short-term bridge; refi at stabilization.
Rent comps 2 comps
| Address | Beds | Baths | Sqft | Rent | $/sqft | DOM | Units | Dist |
|---|---|---|---|---|---|---|---|---|
| 320 Louisiana Ave Bacliff, TX | 2.0 | 1.0 | 786 | $2,150 | $2.74 | 1d | 1 | 0.32mi |
| 804 E AVE Unit 2 Bacliff, TX | 2.0 | 1.0 | 850 | $1,100 | $1.29 | 44d | 1 | 0.47mi |
Listing history 17 events
-
2026-06-18days on market $85,000 Active 106 DOM
-
2026-06-17days on market $85,000 Active 105 DOM
-
2026-06-16days on market $85,000 Active 104 DOM
-
2026-06-15days on market $85,000 Active 103 DOM
-
2026-06-13days on market $85,000 Active 101 DOM
-
2026-06-09days on market $85,000 Active 97 DOM
-
2026-06-08days on market $85,000 Active 96 DOM
-
2026-06-07days on market $85,000 Active 95 DOM
-
2026-06-04days on market $85,000 Active 92 DOM
-
2026-06-03days on market $85,000 Active 91 DOM
-
2026-06-02days on market $85,000 Active 90 DOM
-
2026-06-01days on market $85,000 Active 89 DOM
-
2026-05-31days on market $85,000 Active 88 DOM
-
2026-04-10price $85,000 583-char remark
Show marketing remark (583 chars)
This is a fantastic opportunity for investors, builders, or anyone looking to start fresh and build new. Utilities are already in place with electric and gas run to the property, saving you time and upfront costs. Close to the water, no restrictions and no HOA — giving you flexibility for new construction, rental potential, or other income-producing possibilities. Whether you’re looking to build your next project or add to your investment portfolio, this property offers endless potential. Don’t miss this rare opportunity to create value from the ground up!
-
2026-03-04$120,000 Active 583-char remark
Show marketing remark (583 chars)
This is a fantastic opportunity for investors, builders, or anyone looking to start fresh and build new. Utilities are already in place with electric and gas run to the property, saving you time and upfront costs. Close to the water, no restrictions and no HOA — giving you flexibility for new construction, rental potential, or other income-producing possibilities. Whether you’re looking to build your next project or add to your investment portfolio, this property offers endless potential. Don’t miss this rare opportunity to create value from the ground up!
-
2006-02-24soldstatus
-
1992-09-18soldstatus
ⓘ Source: listings_history table (triggers on properties + properties_extension) + one-shot
backfill from property_details.listing_events for pre-trigger history.
Tax reassessment forecast TX · Resets to sale price
- Current annual tax
- $1,430 · $119/mo
- Projected year-2 tax
- $1,556 · $130/mo
- Expected delta
- +$125/yr (+$10/mo · 8.7%)
ⓘ Screening estimate from a state-policy table — verify with the county assessor before closing.
Climate risk First Street
- Flood 7/10 Severe FEMA zone X (shaded) · 72% chance over 30 yrs
- Wildfire 1/10 Low
- Heat 10/10 Extreme 7 d/yr ≥109°F today · 26 d/yr by 30 yrs out
- Wind 9/10 Extreme 99% chance of damaging wind over 30 yrs
- Air quality 2/10 Low 1 unhealthy d/yr today · 1 by 30 yrs out
Nearby sold comps map
Loading sold comps map…
Walkable amenities ~0.75 mi
Loading nearby amenities…
Taxation est. · year 1
- Rental income
- $20,983
- − Mortgage interest
- −$4,761
- − Property taxes
- −$1,430
- − Insurance
- −$1,222
- − Repairs & maintenance
- −$1,679
- − Management
- −$1,679
- − Depreciation
- −$2,473
- Taxable income
- $7,739
- Est. tax owed @ 24.0%
- −$1,857
- After-tax cash flow
- $6,717/yr
For passive investors: Depreciation is non-cash, so a rental often shows a tax loss while cash-flowing — sheltering income. Rental losses are passive: they offset passive income freely, and up to $25,000/yr can offset ordinary (W-2) income if you actively participate and your MAGI is under $100k (phasing out to $0 by $150k); unused losses carry forward. On sale, claimed depreciation is recaptured at up to 25%, and gains may owe capital-gains tax (a 1031 exchange can defer both). Figures are a year-1 estimate at your 24.0% rate — not tax advice; consult a CPA.
Schools (NCES district)
- District
- Dickinson ISD
- NCES district ID
- 4817070
- Math proficiency
- 39% ▼ -11.00%
- Reading proficiency
- 40% ▼ -2.00%
- Median HH income
- $61,318
- Composite
- 35.16/100
- National rank
- #5005
- State rank
- #366 of 826 in TX
Livability — Bacliff
- Score
- 57/100
- State rank
- #1252
- US rank
- #21864
Category grades
Schools grade is shown separately in the Schools card above.
Census & demographics
- Census place
- Bacliff, TX
- County
- Galveston County · 357,330 people
- City population
- 9,541
- Metro
- Houston-The Woodlands-Sugar Land, TX
- Population (ZIP)
- 9,541
- Household income
- $51,458
- Rent vs Own
- Severe rent burden
- 672.0
Population outlook (Galveston County) Hauer SSP2
- Today (2025)
- 390,640 people
- By 2030
- 425,226 · +8.9%
- By 2040
- 493,765 · +26.4%
- By 2050
- 559,698 · +43.3%
- By 2075
- 719,260 · +84.1%
- By 2100
- 819,628 · +109.8%
Race, ethnicity, and origin ACS 2023
- Neighborhood character
- Diverse neighborhood (Simpson 0.60)
- Race & ethnicity
- Hispanic / Latino 46% White 43% Two or more races 21% Black 7% Asian 2% Native American 1%
- Hispanic origin (detail)
- Mexican 31%
- Common ancestry
- Slovak 3% Lithuanian 2% Romanian 1%
- Foreign-born
- 15% · Canada, Vietnam, China
- Languages at home
- 66% English-only · Spanish 32% Vietnamese 1%
Political lean MEDSL · Galveston
- 2024 margin
- Strong R (+27.4) · D 35.7% · R 63.1% · Other 1.2%
- 2008→2024 swing
- -7.9pp toward R · 2008: -19.5pp · 2024: -27.4pp
- All cycles
- 2024: R+27.4 2020: R+22.6 2016: R+22.6 2012: R+26.9 2008: R+19.5
Not yet ingested
- Civics
- —
Market trends
- HPI YoY
- ▼ -24.15%
- Current HPI
- 293.2677
- Rent YoY
- —
- Metro
- Houston-The Woodlands-Sugar Land, TX
- State GDP YoY
- ▲ 3.95%
- F500 in state
- 110
Industry mix (Fortune 500 HQ in TX)
| Industry | F500 HQs | Revenue |
|---|---|---|
| Energy | 16 | $1,198B |
|
||
| Technology | 5 | $198B |
|
||
| Engineering / Construction | 4 | $72B |
|
||
| Energy Services | 3 | $60B |
|
||
| Utilities | 3 | $41B |
|
||
| Healthcare | 2 | $330B |
|
||
Price history
-29.2% since first listed4 events — show timeline
- 2026-04-10 Price Changed $85,000 HARMLS
- 2026-03-04 Listed $120,000 HARMLS
- 2006-02-24 Sold (Public Records) — Public Records
- 1992-09-18 Sold (Public Records) — Public Records
Property tax history
+4.0%/yrLatest (2025): $1,430 · +12.6% YoY. Source: county tax records.
Cash-flow waterfall
monthlySold comps — $/sqft
last 12 mo · ≤1 miLoading sold comps…