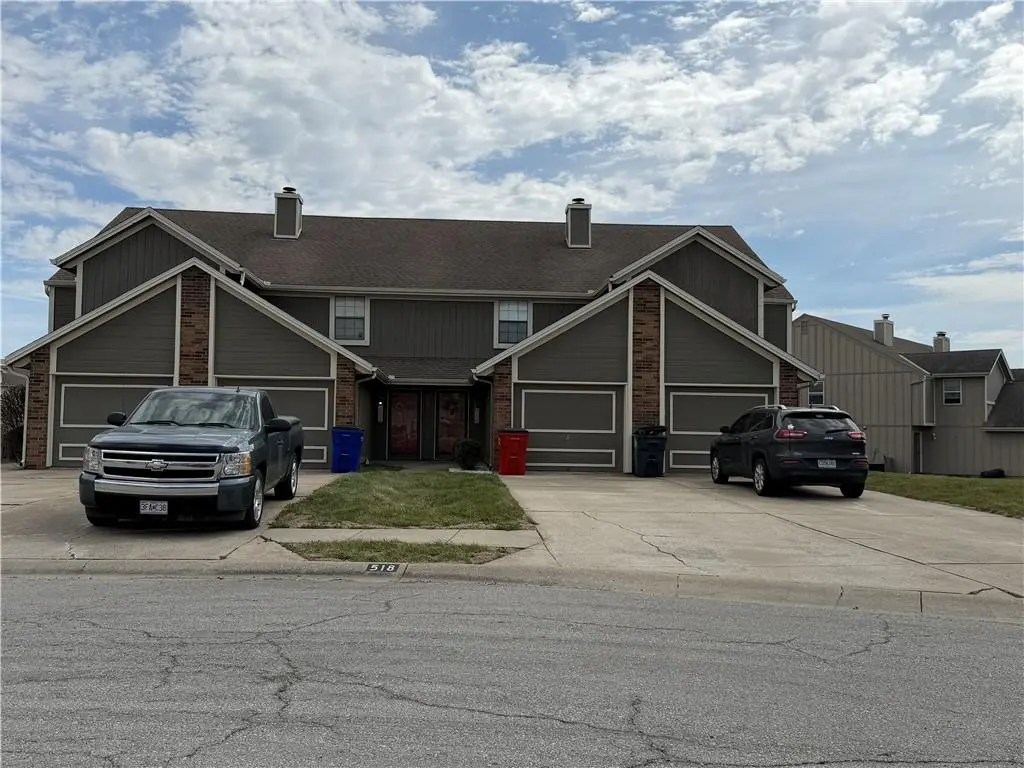
518 NE 6th St Unit B · Blue Springs, MO
Flood risk 1/10 · Minimal
- FEMA flood zone
- X (unshaded)
- Chance of flooding over 30 yrs
- 0.0%
- Est. flood insurance / yr
- $473 – $860
Fire risk 3/10 · Minor
- Est. fire insurance / yr
- $1,054 – $1,958
Heat risk 4/10 · Minor
- Hot days now (above 108°F)
- 7 days/yr
- Hot days in 30 yrs
- 16 days/yr
Wind risk 2/10 · Minimal
- Chance of severe wind over 30 yrs
- —
Air-quality risk 4/10 · Minor
- Unhealthy air days now
- 5 days/yr
- Unhealthy air days in 30 yrs
- 5 days/yr
Risk factors via First Street. Map © Google.
Why this score? — see what drove the D grade
The composite is a weighted blend of 9 inputs, each scored 0–100. Each bar is that input's sub-score; the figure is the points it added to the 100-point composite (weight × sub-score).
- Cash flow +12.0/30.0
- ARV discount +7.5/15.0
- Schools +5.1/10.0
- Livability +4.1/5.0
- Rent growth +3.8/5.0
- 1% rule +3.7/10.0
- DSCR +3.5/10.0
- Condition / age +2.5/5.0
- Appreciation +0.0/10.0
$185,000
🖨 Deal sheet (PDF) 📄 Offer letter ✓ Due diligence
Listing remarks MLS
NOT a Short Sale or Re-po! Seller has moved to KS. , just reduced 15K! Clean and well maintained. All appliances stay including washer and dryer. Great location, walk to Wal-Mart and new shopping center. Great access to I-70. Large Bedrooms!
Key facts
- $128 HOA
- Garage
- Built 1992
Property features AI
Finance
- Other: Located in a city lot; flood plain status unknown
- HOA & community: Monthly HOA fee ($128) covering lawn service, partial amenities, snow removal, street maintenance, and trash; Has HOA
Exterior
- Parking: Attached garage (faces front); 1 garage space
- Utilities: Public water; Public sewer
- Home design: Residential townhouse; Attached property; 2 stories; Above-grade finished living area (from public records)
- Construction: Board & batten siding with brick trim; Composition roof; Slab foundation; Originally built approximately 31–40 years ago
- Exterior features: Patio; City lot; Paved road access
Interior
- Kitchen: Dishwasher; Disposal; Refrigerator; Free-standing electric oven
- Bedrooms: 2 bedrooms (both on second level)
- Bathrooms: 1 full bath; 1 half bath
- Heating & cooling: Electric heating; Electric cooling (central)
- Interior features: Dishwasher; Disposal; Refrigerator; Free-standing electric oven; Living room fireplace (1)
- Laundry & utility: Laundry located on bedroom level
Neighborhood map
What this means for you Summary
Snapshot
- This is a 2-bed/1.5-bath condo listed at $185k.
Deal economics
- At list price, monthly cash flow is $-46 ($-548/yr) — negative.
- To cash-flow at today's rent, offer at most $177k (4.4% below list).
- To meet the 1% rule (rent ≥ 1% of price), the offer needs to be $162k (12.5% below list).
- Recommended offer: $162k (12.5% below list) — sets the bar for 1% rule.
- Cap rate 6.0% vs local median 3.2% in Blue Springs — top-decile yield for the area; either an underpriced asset or a hidden risk that comps aren't pricing in. Stress-test before assuming the spread holds.
Location & tenants
- Location reads 82/100 on livability (#11 in MO, #1,297 nationally) — a professional / high-income tenant draw. Strengths: cost of living A+, housing A+, health & safety A+; Watch: commute F.
- Blue Springs R-IV (suburban): math 55% / reading 60% proficiency, ranked #17 of 324 in MO (top 5%) — acceptable for families but not a draw, mixed tenant base, ~2y average lease.
- Market conditions: Rents rising fast (+5.1%/yr); 243 active listings in the ZIP; 12 comparable units currently listed for rent nearby; rentals at typical pace (median 17d on market — plan ~3-4 weeks tenant-placement turnaround); solid renter incomes; 4,002 units permitted in Jackson County in 2024 (2,271 in 5+ unit buildings).
Forward outlook
- Local home prices are declining (-3.0%/yr); year-one equity from $1k of loan paydown is wiped out by about $6k of value loss. Plan a longer hold.
- Jackson County population projected at +4% by 2050 — modest demand growth; plan on rents tracking national, not racing it.
Negotiation context
- It's been on market 27 days — a 2% lower offer ($182k) is reasonable based on typical stale-listing flexibility.
- 3 sale attempts since 17y ago with the ask held roughly flat each time — persistent listings suggest the price (not the market) is what's stuck; bring a comps-based counter.
Questions for the listing agent
- What do current leases actually rent for vs. the listed asking? Can we see a recent rent roll and the last 12 months of T-12 income?
- What does the HOA fee cover, when was the last increase, and are there any pending special assessments or reserve-fund shortfalls?
- Any open or pending special assessments — roof, HVAC, plumbing, elevator, façade? What's the per-unit balance and payoff schedule, and is the seller paying it off at close or rolling it to the buyer?
- Is there a deadline driving the sale (1031 exchange, divorce, estate, relocation)? That informs how much negotiation room exists.
- Schools are A-rated — typically a magnet for longer-tenancy family renters. What's the average tenant stay here, and is there a school-zone premium baked into asking?
- The area grade is low — what's the realistic commute time and amenity access for the typical tenant pool here? Any planned neighborhood developments (good or bad) we should know about?
- What's the average days-on-market for RENTAL listings here right now (not sales)? A rising rental-DOM trend means longer vacancies and softer asking-rent achievability than the comps imply.
- What's the recent tenant-quality profile in this submarket — average credit score on applications, eviction rate, late-payment / NSF rate, and stable-employment percentage? A property-management company in the area should have these aggregated.
- How much new apartment / multifamily construction is in the pipeline within 1–3 miles? Heavy new supply (>2% of stock underway) typically softens rents 12–24 months out; light construction supports rent growth.
Investment metrics
- 1% rule
- 0.87% ✗
- Cap rate
- 6.00%
- Cash-on-cash
- -1.06%
- DSCR
- 0.95
- GRM
- 9.5
CMA / ARV
No comps found within radius.
Projected returns pro-forma
-3.0% appreciation · 5.12% rent growth · sell at horizon
- IRR
- -15.6%
- Equity multiple
- 0.43×
- Total profit
- $-29,308
- Equity at exit
- $27,584
- IRR
- -3.7%
- Equity multiple
- 0.73×
- Total profit
- $-13,943
- Equity at exit
- $15,995
Cash invested: $51,800 (down + closing). Projections, not guarantees.
Landlord ↔ Tenant lean methodology
- Overall (STATE)
- 81 Strongly Landlord-Friendly
- State Missouri
- 81 Strongly Landlord-Friendly · R+10
- County
- — inherits STATE
- City
- — inherits STATE
ZIP-level market 64014
- Rents YoY
- 5.1%
- Active inventory
- 243
- Price-to-rent
- 9.5×
Monthly cashflow live
- Estimated rent
- $1,619 high interval (Pro) →
- Mortgage (P&I)
- −$970
- Tax from tax record
- −$149 /mo · $1,790/yr
- Insurance
- −$77
- HOA
- −$128
- Vacancy / Maint / Mgmt
- −$340
- Net cashflow
- $-46
Break-even live
Sensitivity live
| Price | -10% $59 | -5% $7 | +0% $-46 | +5% $-98 | +10% $-150 |
|---|---|---|---|---|---|
| Rent | -10% $-174 | -5% $-110 | +0% $-46 | +5% $18 | +10% $82 |
| Rate | -1.0pp $48 | -0.5pp $1 | base $-46 | +0.5pp $-94 | +1.0pp $-142 |
UW: 25.0% down · 7.5% · 30yr · 1.5% tax · 5.0% vac · 8.0% maint · 8.0% mgmt
Financing live
Cash to close
- Down payment
- $46,250
- Closing costs
- $5,550
- Reserves months
- —
- Total cash needed
- —
Loan-product check · same deal, 3 products live
Conventional
25% down · 7.5% · 30yr
- Down + closing
- —
- Monthly P&I
- —
- Monthly cashflow
- —
- DSCR
- —
- Eligible?
- —
Personal DTI + credit; lowest rate.
DSCR
20% down · 8.5% · 30yr
- Down + closing
- —
- Monthly P&I
- —
- Monthly cashflow
- —
- DSCR
- —
- Eligible?
- —
No personal income docs; deal must DSCR.
Hard money
10% down · 12.0% · 12mo
- Down + closing
- —
- Monthly P&I
- —
- Monthly cashflow
- —
- DSCR
- —
- Eligible?
- —
Short-term bridge; refi at stabilization.
Rent comps 12 comps
| Address | Beds | Baths | Sqft | Rent | $/sqft | DOM | Units | Dist |
|---|---|---|---|---|---|---|---|---|
| 128 N 1st St Blue Springs, MO | 3.0 | 2.0 | 1100 | $1,706 | $1.55 | 8d | 1 | 0.55mi |
| 573 NW Valleybrook Rd Blue Springs, MO | 2.0 | 2.5 | 1350 | $1,750 | $1.30 | 22d | 1 | 0.57mi |
| 1120 NE 9th St Blue Springs, MO | 3.0 | 2.0 | 1450 | $1,800 | $1.24 | 24d | 1 | 0.74mi |
| 101 NW Mock Ave Blue Springs, MO | 1.0–2.0 | 1.0–2.0 | 937 | $1,550 | $1.65 | 2d | 5 | 0.74mi |
| 503 SW 4th St Blue Springs, MO | 3.0 | 2.0 | 1400 | $1,395 | $1.00 | 44d | 1 | 0.89mi |
| 509 SW 5th St Blue Springs, MO | 3.0 | 2.5 | 1370 | $1,475 | $1.08 | 8d | 1 | 0.95mi |
| 900 SE Tequesta Ln Blue Springs, MO | 3.0 | 2.5–3.5 | 1647 | $2,128 | $1.29 | 2d | 11 | 0.96mi |
| 402 SW 6 St Unit 402 Blue Springs, MO | 2.0 | 1.0 | 900 | $1,135 | $1.26 | 4d | 1 | 0.97mi |
| 132 SW 8th St Unit 132 8th Blue Springs, MO | 3.0 | 2.5 | 1350 | $1,795 | $1.33 | 44d | 1 | 1.09mi |
| 804 NW Hearnes Ave Blue Springs, MO | 3.0 | 1.5 | 1150 | $1,671 | $1.45 | 44d | 1 | 1.13mi |
| 110 SW 10th St Unit 4 Blue Springs, MO | 1.0 | 1.0 | 1000 | $820 | $0.82 | 4d | 1 | 1.23mi |
| 1003 NW 12 St Blue Springs, MO | 3.0 | 2.0 | 1014 | $1,495 | $1.47 | 17d | 1 | 1.49mi |
HOA detail condo
- Monthly dues
- $128 · $1,536/yr
- Assessments
- None detected in remarks — confirm with the listing agent.
Listing history 9 events
-
2026-04-26$185,000 Active 242-char remark
-
2026-04-24historical $185,000 242-char remark
-
2010-11-29soldstatus 241-char remark
Show marketing remark (241 chars)
NOT a Short Sale or Re-po! Seller has moved to KS. , just reduced 15K! Clean and well maintained. All appliances stay including washer and dryer. Great location, walk to Wal-Mart and new shopping center. Great access to I-70. Large Bedrooms!
-
2010-11-05$60,000 241-char remark
Show marketing remark (241 chars)
NOT a Short Sale or Re-po! Seller has moved to KS. , just reduced 15K! Clean and well maintained. All appliances stay including washer and dryer. Great location, walk to Wal-Mart and new shopping center. Great access to I-70. Large Bedrooms!
-
2010-11-04historical
-
2009-03-02$74,950
-
2004-05-28soldstatus
-
2002-03-28soldstatus
-
1995-07-03soldstatus
ⓘ Source: listings_history table (triggers on properties + properties_extension) + one-shot
backfill from property_details.listing_events for pre-trigger history.
Tax reassessment forecast MO · Resets to sale price
- Current annual tax
- $1,790 · $149/mo
- Projected year-2 tax
- $1,794 · $150/mo
- Expected delta
- +$4/yr ($0/mo · 0.2%)
ⓘ Screening estimate from a state-policy table — verify with the county assessor before closing.
Climate risk First Street
- Flood 1/10 Low FEMA zone X (unshaded) · 0% chance over 30 yrs
- Wildfire 3/10 Moderate
- Heat 4/10 Moderate 7 d/yr ≥108°F today · 16 d/yr by 30 yrs out
- Wind 2/10 Low
- Air quality 4/10 Moderate 5 unhealthy d/yr today · 5 by 30 yrs out
Nearby sold comps map
Loading sold comps map…
Walkable amenities ~0.75 mi
Loading nearby amenities…
Taxation est. · year 1
- Rental income
- $19,424
- − Mortgage interest
- −$10,363
- − Property taxes
- −$1,790
- − Insurance
- −$925
- − Repairs & maintenance
- −$1,554
- − Management
- −$1,554
- − HOA
- −$1,536
- − Depreciation
- −$5,382
- Taxable loss
- −$3,680
- Est. tax savings @ 24.0%
- +$883
- After-tax cash flow
- $335/yr
For passive investors: Depreciation is non-cash, so a rental often shows a tax loss while cash-flowing — sheltering income. Rental losses are passive: they offset passive income freely, and up to $25,000/yr can offset ordinary (W-2) income if you actively participate and your MAGI is under $100k (phasing out to $0 by $150k); unused losses carry forward. On sale, claimed depreciation is recaptured at up to 25%, and gains may owe capital-gains tax (a 1031 exchange can defer both). Figures are a year-1 estimate at your 24.0% rate — not tax advice; consult a CPA.
Schools (NCES district)
- District
- Blue Springs R-IV
- NCES district ID
- 2905310
- Math proficiency
- 55% ▼ -10.00%
- Reading proficiency
- 60% ▼ -6.00%
- Median HH income
- $67,959
- Composite
- 50.71/100
- National rank
- #1819
- State rank
- #17 of 324 in MO
Livability — Blue Springs
- Score
- 82/100
- State rank
- #11
- US rank
- #1297
Category grades
Schools grade is shown separately in the Schools card above.
Census & demographics
- Census place
- Blue Springs, MO
- County
- Jackson County · 687,798 people
- City population
- 61,033
- Metro
- Kansas City, MO-KS
- Population (ZIP)
- 28,788
- Household income
- $90,337
- Rent vs Own
- Severe rent burden
- 888.0
Population outlook (Jackson County) Hauer SSP2
- Today (2025)
- 719,589 people
- By 2030
- 731,456 · +1.6%
- By 2040
- 746,689 · +3.8%
- By 2050
- 749,289 · +4.1%
- By 2075
- 736,227 · +2.3%
- By 2100
- 668,210 · -7.1%
Race, ethnicity, and origin ACS 2023
- Neighborhood character
- Predominantly White (76%)
- Race & ethnicity
- White 76% Hispanic / Latino 10% Two or more races 8% Black 8% Asian 1%
- Hispanic origin (detail)
- Mexican 7%
- Common ancestry
- Italian 10% Romanian 2% Lithuanian 2%
- Foreign-born
- 3% · Canada, South Korea
- Languages at home
- 94% English-only · Spanish 5%
Political lean MEDSL · Jackson
- 2024 margin
- D (+19.3) · D 58.9% · R 39.5% · Other 1.6%
- 2008→2024 swing
- -6.1pp toward R · 2008: 25.4pp · 2024: 19.3pp
- All cycles
- 2024: D+19.3 2020: D+22.0 2016: D+16.6 2012: D+19.0 2008: D+25.4
Not yet ingested
- Civics
- —
Market trends
- HPI YoY
- ▼ -187.52%
- Current HPI
- 236.8685
- Rent YoY
- ▲ 5.12%
- Metro
- Kansas City, MO-KS
- State GDP YoY
- ▲ 1.84%
- F500 in state
- 20
Industry mix (Fortune 500 HQ in MO)
| Industry | F500 HQs | Revenue |
|---|---|---|
| Healthcare | 1 | $163B |
|
||
| Insurance | 1 | $21B |
|
||
| Industrial Technology | 1 | $17B |
|
||
| Retail | 1 | $16B |
|
||
| Industrial Distribution | 1 | $10B |
|
||
| Utilities | 1 | $9B |
|
||
Price history
+146.8% since first listed10 events — show timeline
- 2026-05-23 Pending — Heartland MLS as Distributed by MLS Grid
- 2026-04-26 Listed $185,000 Heartland MLS as Distributed by MLS Grid
- 2026-04-24 Coming Soon $185,000 Heartland MLS as Distributed by MLS Grid
- 2010-11-29 Sold (MLS) — Heartland MLS as Distributed by MLS Grid
- 2010-11-05 Listed $60,000 Heartland MLS as Distributed by MLS Grid
- 2010-11-04 Listing Removed — Heartland MLS as Distributed by MLS Grid
- 2009-03-02 Listed $74,950 Heartland MLS as Distributed by MLS Grid
- 2004-05-28 Sold (Public Records) — Public Records
- 2002-03-28 Sold (Public Records) — Public Records
- 1995-07-03 Sold (Public Records) — Public Records
Property tax history
+4.6%/yrLatest (2025): $1,790 · +0.8% YoY. Source: county tax records.
Cash-flow waterfall
monthlySold comps — $/sqft
last 12 mo · ≤1 miLoading sold comps…