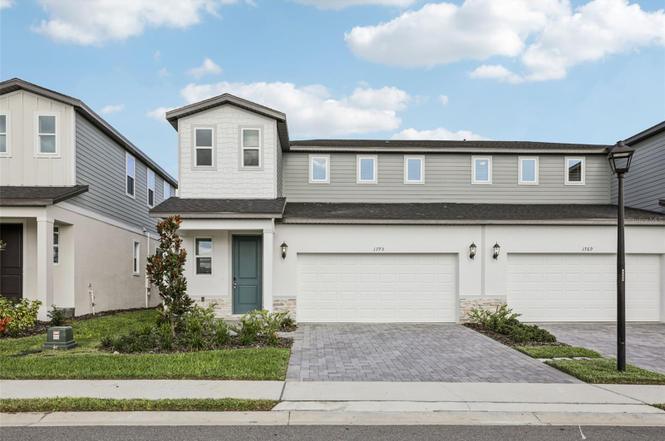
1773 Archer Dr · Minneola, FL
Flood risk No data
- FEMA flood zone
- —
- Chance of flooding over 30 yrs
- —
- Est. flood insurance / yr
- —
Fire risk No data
- Est. fire insurance / yr
- —
Heat risk No data
- Hot days now (above threshold)
- —
- Hot days in 30 yrs
- —
Wind risk No data
- Chance of severe wind over 30 yrs
- —
Air-quality risk No data
- Unhealthy air days now
- —
- Unhealthy air days in 30 yrs
- —
Risk factors via First Street. Map © Google.
Why this score? — see what drove the D grade
The composite is a weighted blend of 9 inputs, each scored 0–100. Each bar is that input's sub-score; the figure is the points it added to the 100-point composite (weight × sub-score).
- Cash flow +14.9/30.0
- ARV discount +7.5/15.0
- DSCR +4.6/10.0
- Schools +4.2/10.0
- Rent growth +3.8/5.0
- Livability +3.8/5.0
- 1% rule +3.4/10.0
- Condition / age +2.5/5.0
- Appreciation +0.0/10.0
$382,171
🖨 Deal sheet 📄 Offer letter ✓ Due diligence
Listing remarks
One or more photo(s) has been virtually staged. Brand new, energy-efficient home available NOW! The two-story foyer impresses upon entry as you continue into the spacious dining area and great room. This open-concept floorplan is perfectly designed for entertaining guests and navigating everyday life. Now selling from the mid $400s, Cyrene at Minneola Villas offers paired villas in Lake County, FL. Residents will have easy access to Florida's Turnpike, restaurants, retail, and more. Each of our homes is built with innovative, energy-efficient features designed to help you enjoy more savings, better health, real comfort and peace of mind.
Key facts
- $117 HOA
- 2 garage spots
- Community pool
Neighborhood map
What this means for you Summary
Snapshot
- This is a 4-bed/2.5-bath land listed at $382k.
Deal economics
- At list price, monthly cash flow is $114 ($1k/yr) — positive.
- The deal already cash-flows at list — no discount required.
- To meet the 1% rule (rent ≥ 1% of price), the offer needs to be $320k (16.3% below list).
- Recommended offer: $320k (16.3% below list) — sets the bar for 1% rule.
- Cap rate 6.6% vs local median 3.5% in Minneola — top-decile yield for the area; either an underpriced asset or a hidden risk that comps aren't pricing in. Stress-test before assuming the spread holds.
Location & tenants
- Location reads 75/100 on livability (#253 in FL, #3,987 nationally) — a middle-class / working-renter tenant base. Strengths: housing A+, health & safety A+, crime A-; Watch: amenities F, commute F.
- Lake (suburban): math 49% / reading 50% proficiency, ranked #37 of 73 in FL (top 51%) — families likely to look elsewhere, expect single-tenant / working-renter base with shorter leases.
- Zoned schools: Grassy Lake Elementary School (math 58% / reading 63%, grade B-, #664 of 2,144 statewide, top 32%, 1,209 students, 29% FRL); Lake Minneola High School (math 44% / reading 57%, grade D+, #171 of 667 statewide, top 26%, 2,176 students, 28% FRL) — zoned schools average 29% FRL vs 49% district-wide (20 pts lower); this property's tenant base skews higher-income than the district average.
- Market conditions: Rents rising fast (+5.2%/yr); 439 active listings in the ZIP; 19 comparable units currently listed for rent nearby; rentals at typical pace (median 24d on market — plan ~3-4 weeks tenant-placement turnaround); solid renter incomes; 4,799 units permitted in Lake County in 2024 (814 in 5+ unit buildings).
- This rent runs 36% of the median local income ($105k/yr) — at the standard rent-burdened threshold; future hikes will face affordability resistance.
Forward outlook
- Local home prices are declining (-3.0%/yr); year-one equity from $3k of loan paydown is wiped out by about $11k of value loss. Plan a longer hold.
- Lake County population projected at +37% by 2050 — long-run rental-demand tailwind backs the buy-and-hold thesis.
Negotiation context
- It's been on market 93 days — a 9% lower offer ($348k) is reasonable based on typical stale-listing flexibility.
Questions for the listing agent
- It's been on market 93 days. Have you received any prior offers? Is the seller open to a 16% concession, seller financing, or rate buy-down credit?
- What does the HOA fee cover, when was the last increase, and are there any pending special assessments or reserve-fund shortfalls?
- Why hasn't it sold? Are there any deal-killer items the seller is aware of (foundation, flood, title, zoning, code violations)?
- Is there a deadline driving the sale (1031 exchange, divorce, estate, relocation)? That informs how much negotiation room exists.
- Schools are B-rated — typically a magnet for longer-tenancy family renters. What's the average tenant stay here, and is there a school-zone premium baked into asking?
- The area grade is low — what's the realistic commute time and amenity access for the typical tenant pool here? Any planned neighborhood developments (good or bad) we should know about?
- What's the average days-on-market for RENTAL listings here right now (not sales)? A rising rental-DOM trend means longer vacancies and softer asking-rent achievability than the comps imply.
- What's the recent tenant-quality profile in this submarket — average credit score on applications, eviction rate, late-payment / NSF rate, and stable-employment percentage? A property-management company in the area should have these aggregated.
- How much new for-sale + rental construction is in the pipeline within 1–3 miles? Heavy new supply typically softens prices + rents 12–24 months out; constrained supply supports both.
Investment metrics
- 1% rule
- 0.84% ✗
- Cap rate
- 6.65%
- Cash-on-cash
- 1.27%
- DSCR
- 1.06
- GRM
- 10.0
CMA / ARV
No comps found within radius.
Projected returns pro-forma
-3.0% appreciation · 5.17% rent growth · sell at horizon
- IRR
- -12.1%
- Equity multiple
- 0.55×
- Total profit
- $-47,650
- Equity at exit
- $56,983
- IRR
- -0.2%
- Equity multiple
- 0.98×
- Total profit
- $-1,937
- Equity at exit
- $33,043
Cash invested: $107,008 (down + closing). Projections, not guarantees.
Landlord ↔ Tenant lean methodology
- Overall (STATE)
- 87 Strongly Landlord-Friendly
- State Florida
- 87 Strongly Landlord-Friendly · R+3
- County
- — inherits STATE
- City
- — inherits STATE
ZIP-level market 34715
- Home prices YoY
- -19.2%
- Rents YoY
- 5.2%
- Active inventory
- 439
- Price-to-rent
- 10.0×
Monthly cashflow live
- Estimated rent
- $3,199 high interval (Pro) →
- Mortgage (P&I)
- −$2,004
- Tax from tax record
- −$133 /mo · $1,602/yr
- Insurance
- −$159
- HOA
- −$117
- Vacancy / Maint / Mgmt
- −$672
- Net cashflow
- $114
Break-even live
UW: 25.0% down · 7.5% · 30yr · 1.5% tax · 5.0% vac · 8.0% maint · 8.0% mgmt
Financing live
Cash to close
- Down payment
- $95,543
- Closing costs
- $11,465
- Reserves months
- —
- Total cash needed
- —
Loan-product check · same deal, 3 products live
Conventional
25% down · 7.5% · 30yr
- Down + closing
- —
- Monthly P&I
- —
- Monthly cashflow
- —
- DSCR
- —
- Eligible?
- —
Personal DTI + credit; lowest rate.
DSCR
20% down · 8.5% · 30yr
- Down + closing
- —
- Monthly P&I
- —
- Monthly cashflow
- —
- DSCR
- —
- Eligible?
- —
No personal income docs; deal must DSCR.
Hard money
10% down · 12.0% · 12mo
- Down + closing
- —
- Monthly P&I
- —
- Monthly cashflow
- —
- DSCR
- —
- Eligible?
- —
Short-term bridge; refi at stabilization.
Rent comps 19 comps
| Address | Beds | Baths | Sqft | Rent | $/sqft | DOM | Units | Dist |
|---|---|---|---|---|---|---|---|---|
| 2276 Hen Rd Minneola, FL | 4.0 | 2.5 | 2601 | $3,200 | $1.23 | 24d | 1 | 0.12mi |
| 975 Vineyard Ridge Rd Minneola, FL | 4.0 | 2.0 | 2236 | $3,200 | $1.43 | 14d | 1 | 0.32mi |
| 366 Switchgrass Loop Minneola, FL | 3.0 | 2.0 | 1643 | $2,700 | $1.64 | 24d | 1 | 0.42mi |
| 366 Switchgrass Loop Unit 366 Minneola, FL | 3.0 | 2.0 | 1643 | $2,650 | $1.61 | 24d | 1 | 0.42mi |
| 848 Vineyard Ridge Rd Minneola, FL | 4.0 | 3.0 | 1964 | $2,650 | $1.35 | 16d | 1 | 0.47mi |
| 2100 Maverick Ct Minneola, FL | 4.0 | 2.5 | 1956 | $2,999 | $1.53 | 5d | 1 | 0.77mi |
| 1012 Sadie Ridge Rd Clermont, FL | 4.0 | 2.0 | 2055 | $2,800 | $1.36 | 24d | 1 | 0.81mi |
| 1270 Whispering Ln Minneola, FL | 3.0 | 2.0 | 1554 | $2,600 | $1.67 | 5d | 1 | 0.88mi |
| 2311 Juniper Berry Dr Minneola, FL | 4.0 | 4.0 | 2945 | $4,500 | $1.53 | 24d | 1 | 0.90mi |
| 2002 Redbay Ave Minneola, FL | 3.0 | 2.0 | 2200 | $3,500 | $1.59 | 24d | 1 | 0.90mi |
| 2062 Redbay Ave Minneola, FL | 3.0 | 2.5 | 2190 | $2,700 | $1.23 | 24d | 1 | 0.90mi |
| 2062 Redbay Ave Minneola, FL | 3.0 | 2.0 | 2190 | $2,650 | $1.21 | 16d | 1 | 0.90mi |
| 1946 Holden Ridge Ln Clermont, FL | 3.0 | 2.5 | 1866 | $2,250 | $1.21 | 24d | 1 | 0.93mi |
| 2040 Axel St Minneola, FL | 4.0 | 3.0 | 1884 | $2,550 | $1.35 | 24d | 1 | 1.02mi |
| 6024 Snapdragon Rd Minneola, FL | 3.0 | 2.0 | 2092 | $2,916 | $1.39 | 12d | 1 | 1.03mi |
| 16008 Volterra Pt Bella Collina, FL | 4.0 | 4.0 | 2979 | $7,500 | $2.52 | 24d | 1 | 1.29mi |
| 204 Lace Bark Ct Minneola, FL | 3.0 | 2.0 | 1778 | $2,200 | $1.24 | 24d | 1 | 1.30mi |
| 1877 Sierra Sun Way Clermont, FL | 3.0 | 2.0 | 1536 | $2,500 | $1.63 | 24d | 1 | 1.43mi |
| 1300 Cavender Creek Rd Minneola, FL | 4.0 | 3.0 | 2472 | $3,050 | $1.23 | 17d | 1 | 1.45mi |
HOA detail
- Monthly dues
- $117 · $1,404/yr
Listing history 8 events
-
2026-06-04status $382,171 Pending 93 DOM
-
2026-06-03days on market $382,171 Active 93 DOM
-
2026-06-02days on market $382,171 Active 92 DOM
-
2026-06-02pricestatus $382,171 Active 91 DOM
-
2026-04-07status Pending
-
2026-04-02price $377,990
-
2026-03-04price $398,000
-
2026-01-06$423,000 Active
ⓘ Source: listings_history table (triggers on properties + properties_extension) + one-shot
backfill from property_details.listing_events for pre-trigger history.
Tax reassessment forecast FL · Resets to sale price
- Current annual tax
- $1,602 · $133/mo
- Projected year-2 tax
- $3,172 · $264/mo
- Expected delta
- +$1,570/yr (+$131/mo · 98.0%)
ⓘ Screening estimate from a state-policy table — verify with the county assessor before closing.
Nearby sold comps map
Loading sold comps map…
Walkable amenities ~0.75 mi
Loading nearby amenities…
Taxation est. · year 1
- Rental income
- $38,391
- − Mortgage interest
- −$21,408
- − Property taxes
- −$1,602
- − Insurance
- −$1,911
- − Repairs & maintenance
- −$3,071
- − Management
- −$3,071
- − HOA
- −$1,404
- − Depreciation
- −$11,118
- Taxable loss
- −$5,193
- Est. tax savings @ 24.0%
- +$1,246
- After-tax cash flow
- $2,609/yr
For passive investors: Depreciation is non-cash, so a rental often shows a tax loss while cash-flowing — sheltering income. Rental losses are passive: they offset passive income freely, and up to $25,000/yr can offset ordinary (W-2) income if you actively participate and your MAGI is under $100k (phasing out to $0 by $150k); unused losses carry forward. On sale, claimed depreciation is recaptured at up to 25%, and gains may owe capital-gains tax (a 1031 exchange can defer both). Figures are a year-1 estimate at your 24.0% rate — not tax advice; consult a CPA.
Schools (NCES district)
- District
- Lake
- NCES district ID
- 1201050
- Math proficiency
- 49% ▼ -7.00%
- Reading proficiency
- 50% ▼ -4.00%
- Median HH income
- $46,632
- Composite
- 42.05/100
- National rank
- #3327
- State rank
- #37 of 73 in FL
Livability — Minneola
- Score
- 75/100
- State rank
- #253
- US rank
- #3987
Category grades
Schools grade is shown separately in the Schools card above.
Census & demographics
- Census place
- Minneola, FL
- County
- Lake County · 364,602 people
- City population
- 26,810
- Metro
- Orlando-Kissimmee-Sanford, FL
- Population (ZIP)
- 26,810
- Household income
- $105,262
- Rent vs Own
- Severe rent burden
- 293.0
Population outlook (Lake County) Hauer SSP2
- Today (2025)
- 386,640 people
- By 2030
- 417,107 · +7.9%
- By 2040
- 476,676 · +23.3%
- By 2050
- 531,296 · +37.4%
- By 2075
- 648,303 · +67.7%
- By 2100
- 698,530 · +80.7%
Race, ethnicity, and origin ACS 2023
- Neighborhood character
- Diverse neighborhood (Simpson 0.63)
- Race & ethnicity
- White 51% Hispanic / Latino 31% Two or more races 19% Black 8% Asian 5%
- Hispanic origin (detail)
- Mexican 3% Puerto Rican 18% Cuban 2% Dominican 3%
- Common ancestry
- Romanian 2% Slovak 1% Scotch-Irish 1%
- Foreign-born
- 16% · Canada, Vietnam, Jamaica
- Languages at home
- 71% English-only · Spanish 24% Vietnamese 2% French/Haitian/Cajun 1%
Political lean MEDSL · Lake
- 2024 margin
- Strong R (+24.7) · D 37.3% · R 62.0%
- 2008→2024 swing
- -11.2pp toward R · 2008: -13.5pp · 2024: -24.7pp
- All cycles
- 2024: R+24.7 2020: R+20.0 2016: R+23.1 2012: R+17.1 2008: R+13.5
Not yet ingested
- Civics
- —
Market trends
- HPI YoY
- ▼ -72.47%
- Current HPI
- 305.4193
- Rent YoY
- ▲ 5.17%
- Metro
- Orlando-Kissimmee-Sanford, FL
- State GDP YoY
- ▲ 3.28%
- F500 in state
- 36
Industry mix (Fortune 500 HQ in FL)
| Industry | F500 HQs | Revenue |
|---|---|---|
| Industrial Technology | 2 | $29B |
|
||
| Insurance | 2 | $17B |
|
||
| Retail | 1 | $60B |
|
||
| Technology Distribution | 1 | $58B |
|
||
| Homebuilding | 1 | $35B |
|
||
| Technology Manufacturing | 1 | $35B |
|
||
Price history
-10.6% since first listed4 events — show timeline
- 2026-04-07 Pending — Stellar MLS as Distributed by MLS Grid
- 2026-04-02 Price Changed $377,990 Stellar MLS as Distributed by MLS Grid
- 2026-03-04 Price Changed $398,000 Stellar MLS as Distributed by MLS Grid
- 2026-01-06 Listed $423,000 Stellar MLS as Distributed by MLS Grid
Cash-flow waterfall
monthlySold comps — $/sqft
last 12 mo · ≤1 miLoading sold comps…