 Multi-family
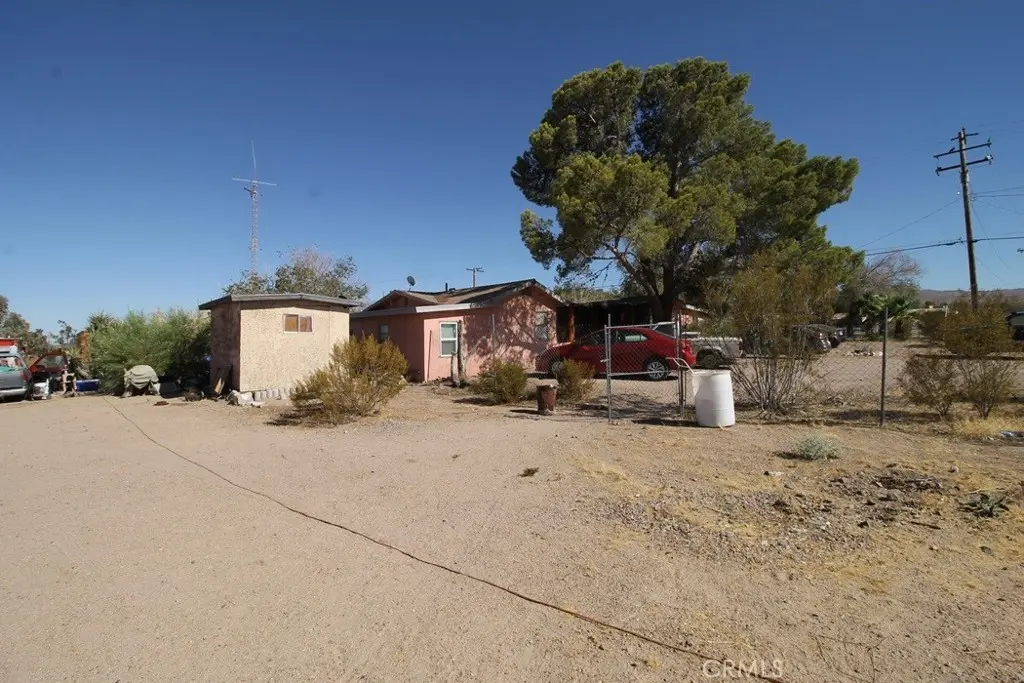
33713 1st St · Barstow, CA
Flood risk 1/10 · Minimal
- FEMA flood zone
- D
- Chance of flooding over 30 yrs
- 0.0%
- Est. flood insurance / yr
- $544 – $1,084
Fire risk 3/10 · Minor
- Est. fire insurance / yr
- $659 – $1,223
Heat risk 8/10 · Major
- Hot days now (above 105°F)
- 7 days/yr
- Hot days in 30 yrs
- 20 days/yr
Wind risk 1/10 · Minimal
- Chance of severe wind over 30 yrs
- —
Air-quality risk 6/10 · Moderate
- Unhealthy air days now
- 11 days/yr
- Unhealthy air days in 30 yrs
- 14 days/yr
Risk factors via First Street. Map © Google.
Why this score? — see what drove the B- grade
The composite is a weighted blend of 9 inputs, each scored 0–100. Each bar is that input's sub-score; the figure is the points it added to the 100-point composite (weight × sub-score).
- Cash flow +28.4/30.0
- DSCR +10.0/10.0
- ARV discount +7.5/15.0
- 1% rule +7.0/10.0
- Appreciation +5.0/10.0
- Livability +3.2/5.0
- Schools +2.7/10.0
- Rent growth +2.5/5.0
- Condition / age +2.5/5.0
$200,000
🖨 Deal sheet 📄 Offer letter ✓ Due diligence
Multi-family units
County records classify this as Multi-Family (2-4 Unit). Listing-text estimate: 1 unit. estimate disagrees with records
Listing remarks
Less than 8 miles from Barstow, this versatile income-producing property offers exceptional investment potential with multiple opportunities for additional revenue. The property features two fully rented units, each offering 2 bedrooms, 1 bathroom, a kitchen, and a living room. Current rents are below market value, leaving room for increased cash flow and future upside. The large warehouse/workshop adds even more value, presenting an excellent opportunity for extra rental income or the perfect setup for a small business, contractor, mechanic, storage use, or home-based operation. Situated on 1.61 acres adjacent to the Daggett Community Services District, this property combines residential i
Key facts
- 1.61 acres
- Fully rented units
- 1.61 acre lot
Tags
Property features AI
Finance
- Financial info: Gross scheduled income $1,525; Gross income $1,425; Net operating income $1,425; Operating expense $100; Trash expense $120; Total expenses $1,325; Tenant pays gas and electricity; Unit rents shown: one unit at $800, one unit at $825
- HOA & community: Suburban community
Exterior
- Parking: 4 garage spaces (4 total parking spaces)
- Utilities: Public/district water; Septic (type unknown); Two separate water meters, two separate gas meters, and two separate electric meters
- Home design: Multi-unit property with 2 buildings and 2 total units; One-story buildings; No ADU
- Construction: Built (year per public records); Parcel number 0516181090000
- Exterior features: Desert front and desert back landscaping; No pool
Interior
- Bedrooms: Two 2-bedroom units (each unit listed as 2 beds)
- Interior features: Front door entry; Single-story layout; Attached property with one common wall
- Laundry & utility: Laundry inside
Neighborhood map
What this means for you Summary
Snapshot
- This is a 4-bed/?-bath multifamily listed at $200k.
Deal economics
- At list price, monthly cash flow is $649 ($8k/yr) — positive.
- The deal already cash-flows at list — no discount required.
- Meets the 1% rule at list price ($2k rent vs $200k).
- Recommended offer: $197k (1.5% below list) — sets the bar for market timing.
- Cap rate 10.2% vs local median 4.6% in Barstow — top-decile yield for the area; either an underpriced asset or a hidden risk that comps aren't pricing in. Stress-test before assuming the spread holds.
Location & tenants
- Location reads 63/100 on livability (#444 in CA) — a middle-class / working-renter tenant base. Strengths: commute A+, housing A+; Watch: amenities C-, health & safety C-, schools F.
- Silver Valley Unified (town): math 23% / reading 39% proficiency, ranked #323 of 517 in CA (top 62%) — families likely to look elsewhere, expect single-tenant / working-renter base with shorter leases.
- Market conditions: 21 active listings in the ZIP; 5,458 units permitted in San Bernardino County in 2024 (1,500 in 5+ unit buildings).
Forward outlook
- In year one you build about $7k of equity ($1k loan paydown + $6k appreciation (3.0% local appreciation)).
- San Bernardino County population projected at +15% by 2050 — modest demand growth; plan on rents tracking national, not racing it.
- At projected returns (3.0% appreciation + 3.0% rent growth), your $56k cash investment doubles in ~4 years — after that, you're playing with house money.
- By year 5, paydown + projected appreciation supports a ~$32k cash-out refi (75% LTV) — recoverable capital for the next deal without selling this one.
Negotiation context
- It's been on market 30 days — a 2% lower offer ($197k) is reasonable based on typical stale-listing flexibility.
- 2 sale attempts since 2y ago with the ask held roughly flat each time — persistent listings suggest the price (not the market) is what's stuck; bring a comps-based counter.
- Current owner paid $112k; list at $200k implies a 78% gain — meaningful room to come down on a strong offer.
Risks & watch-outs
- Watch-outs: built in 1954 — expect roof / HVAC / electrical / plumbing capex.
- Climate carrying-cost: extreme-heat days projected 7→20/yr by 2055 (HVAC capex compounding) — expect insurance premiums to compound above CPI over the hold.
Questions for the listing agent
- Built in 1954 — when were the roof, HVAC, electrical panel, plumbing, and water heater last replaced?
- Is there a deadline driving the sale (1031 exchange, divorce, estate, relocation)? That informs how much negotiation room exists.
- Schools are F-rated, which usually means shorter tenancies and higher turnover. Who's the typical renter profile here, and what's been the actual vacancy rate?
- Crime grade is F in this area — have there been break-ins, vandalism, or insurance claims at this property in the last 3 years? What carrier currently insures it and at what premium?
- What's the average days-on-market for RENTAL listings here right now (not sales)? A rising rental-DOM trend means longer vacancies and softer asking-rent achievability than the comps imply.
- What's the recent tenant-quality profile in this submarket — average credit score on applications, eviction rate, late-payment / NSF rate, and stable-employment percentage? A property-management company in the area should have these aggregated.
- How much new apartment / multifamily construction is in the pipeline within 1–3 miles? Heavy new supply (>2% of stock underway) typically softens rents 12–24 months out; light construction supports rent growth.
Investment metrics
- 1% rule
- 1.20% ✓
- Cap rate
- 10.19%
- Cash-on-cash
- 13.91%
- DSCR
- 1.62
- GRM
- 6.9
CMA / ARV
No comps found within radius.
Projected returns pro-forma
3.0% appreciation · 3.0% rent growth · sell at horizon
- IRR
- 20.5%
- Equity multiple
- 2.17×
- Total profit
- $65,400
- Equity at exit
- $89,929
- IRR
- 21.7%
- Equity multiple
- 4.12×
- Total profit
- $174,828
- Equity at exit
- $138,591
Cash invested: $56,000 (down + closing). Projections, not guarantees.
Landlord ↔ Tenant lean methodology
- Overall (STATE)
- 18 Strongly Tenant-Friendly
- State California
- 18 Strongly Tenant-Friendly · D+13
- County
- — inherits STATE
- City
- — inherits STATE
ZIP-level market 92327
- Active inventory
- 21
- Price-to-rent
- 13.9×
Monthly cashflow live
- Estimated rent
- $2,400 medium interval (Pro) →
- Mortgage (P&I)
- −$1,049
- Tax from tax record
- −$115 /mo · $1,375/yr
- Insurance
- −$83
- HOA
- −$0
- Vacancy / Maint / Mgmt
- −$504
- Net cashflow
- $649
Break-even live
2-unit breakdown (identical units grouped — click to expand)
| Units | Beds | Baths | Est. rent |
|---|---|---|---|
| 2× units | 2 | 1 | $2,400 |
| #1 | 2 | 1 | $1,200 |
| #2 | 2 | 1 | $1,200 |
| Total (2 units) | $2,400 | ||
UW: 25.0% down · 7.5% · 30yr · 1.5% tax · 5.0% vac · 8.0% maint · 8.0% mgmt
Financing live
Cash to close
- Down payment
- $50,000
- Closing costs
- $6,000
- Reserves months
- —
- Total cash needed
- —
Loan-product check · same deal, 3 products live
Conventional
25% down · 7.5% · 30yr
- Down + closing
- —
- Monthly P&I
- —
- Monthly cashflow
- —
- DSCR
- —
- Eligible?
- —
Personal DTI + credit; lowest rate.
DSCR
20% down · 8.5% · 30yr
- Down + closing
- —
- Monthly P&I
- —
- Monthly cashflow
- —
- DSCR
- —
- Eligible?
- —
No personal income docs; deal must DSCR.
Hard money
10% down · 12.0% · 12mo
- Down + closing
- —
- Monthly P&I
- —
- Monthly cashflow
- —
- DSCR
- —
- Eligible?
- —
Short-term bridge; refi at stabilization.
Listing history 20 events
-
2026-06-18days on market $200,000 Active 30 DOM
-
2026-06-17days on market $200,000 Active 29 DOM
-
2026-06-16days on market $200,000 Active 28 DOM
-
2026-06-15days on market $200,000 Active 27 DOM
-
2026-06-13days on market $200,000 Active 25 DOM
-
2026-06-13days on market $200,000 Active 24 DOM
-
2026-06-09days on market $200,000 Active 21 DOM
-
2026-06-08days on market $200,000 Active 20 DOM
-
2026-06-07days on market $200,000 Active 19 DOM
-
2026-06-04days on market $200,000 Active 16 DOM
-
2026-06-03days on market $200,000 Active 15 DOM
-
2026-06-02days on market $200,000 Active 14 DOM
-
2026-06-01days on market $200,000 Active 13 DOM
-
2026-05-31days on market $200,000 Active 12 DOM
-
2026-05-19$200,000 Active
-
2025-02-28historical
-
2024-07-31$200,000 Active
-
2024-07-10historical
-
2007-05-08soldstatus $112,500
-
1995-05-08soldstatus $50,000
ⓘ Source: listings_history table (triggers on properties + properties_extension) + one-shot
backfill from property_details.listing_events for pre-trigger history.
Tax reassessment forecast CA · Resets to sale price
- Current annual tax
- $1,375 · $115/mo
- Projected year-2 tax
- $1,520 · $127/mo
- Expected delta
- +$145/yr (+$12/mo · 10.6%)
ⓘ Screening estimate from a state-policy table — verify with the county assessor before closing.
Climate risk First Street
- Flood 1/10 Low FEMA zone D · 0% chance over 30 yrs
- Wildfire 3/10 Moderate
- Heat 8/10 Severe 7 d/yr ≥105°F today · 20 d/yr by 30 yrs out
- Wind 1/10 Low
- Air quality 6/10 Major 11 unhealthy d/yr today · 14 by 30 yrs out
Nearby sold comps map
Loading sold comps map…
Walkable amenities ~0.75 mi
Loading nearby amenities…
Taxation est. · year 1
- Rental income
- $28,800
- − Mortgage interest
- −$11,203
- − Property taxes
- −$1,375
- − Insurance
- −$1,000
- − Repairs & maintenance
- −$2,304
- − Management
- −$2,304
- − Depreciation
- −$5,818
- Taxable income
- $4,796
- Est. tax owed @ 24.0%
- −$1,151
- After-tax cash flow
- $6,640/yr
For passive investors: Depreciation is non-cash, so a rental often shows a tax loss while cash-flowing — sheltering income. Rental losses are passive: they offset passive income freely, and up to $25,000/yr can offset ordinary (W-2) income if you actively participate and your MAGI is under $100k (phasing out to $0 by $150k); unused losses carry forward. On sale, claimed depreciation is recaptured at up to 25%, and gains may owe capital-gains tax (a 1031 exchange can defer both). Figures are a year-1 estimate at your 24.0% rate — not tax advice; consult a CPA.
Schools (NCES district)
- District
- Silver Valley Unified
- NCES district ID
- 0636820
- Math proficiency
- 23% ▼ -12.00%
- Reading proficiency
- 39% ▼ -12.00%
- Median HH income
- $48,754
- Composite
- 26.85/100
- National rank
- #7105
- State rank
- #323 of 517 in CA
Livability — Barstow
- Score
- 63/100
- State rank
- #444
- US rank
- #15099
Category grades
Schools grade is shown separately in the Schools card above.
Census & demographics
- City population
- 33,954
- Population (ZIP)
- 706
Population outlook (San Bernardino County) Hauer SSP2
- Today (2025)
- 2,300,329 people
- By 2030
- 2,378,907 · +3.4%
- By 2040
- 2,523,137 · +9.7%
- By 2050
- 2,642,388 · +14.9%
- By 2075
- 2,880,769 · +25.2%
- By 2100
- 2,909,436 · +26.5%
Race, ethnicity, and origin ACS 2023
- Neighborhood character
- Diverse neighborhood (Simpson 0.67)
- Race & ethnicity
- White 48% Hispanic / Latino 23% Black 22% Two or more races 22%
- Hispanic origin (detail)
- Mexican 21%
- Common ancestry
- English 4% Italian 2%
Political lean MEDSL · San Bernardino
- 2024 margin
- Toss-up / Even · D 47.5% · R 49.7% · Other 2.8%
- 2008→2024 swing
- -8.5pp toward R · 2008: 6.3pp · 2024: -2.1pp
- All cycles
- 2024: R+2.1 2020: D+10.7 2016: D+9.8 2012: D+5.4 2008: D+6.3
Not yet ingested
- Civics
- —
Market trends
- HPI YoY
- —
- Current HPI
- —
- Rent YoY
- —
- Metro
- —
- State GDP YoY
- ▲ 3.21%
- F500 in state
- 116
Industry mix (Fortune 500 HQ in CA)
| Industry | F500 HQs | Revenue |
|---|---|---|
| Technology | 27 | $1,492B |
|
||
| Financial Services | 3 | $174B |
|
||
| Retail | 3 | $44B |
|
||
| Insurance | 3 | $26B |
|
||
| Media / Entertainment | 2 | $115B |
|
||
| Pharmaceuticals / Biotech | 2 | $62B |
|
||
Price history
+300.0% since first listed6 events — show timeline
- 2026-05-19 Listed $200,000 CRMLS
- 2025-02-28 Listing Removed — CRMLS
- 2024-07-31 Listed $200,000 CRMLS
- 2024-07-10 Coming Soon — CRMLS
- 2007-05-08 Sold (Public Records) $112,500 Public Records
- 1995-05-08 Sold (Public Records) $50,000 Public Records
Property tax history
-2.9%/yrLatest (2025): $1,375 · -0.0% YoY. Source: county tax records.
Cash-flow waterfall
monthlySold comps — $/sqft
last 12 mo · ≤1 miLoading sold comps…