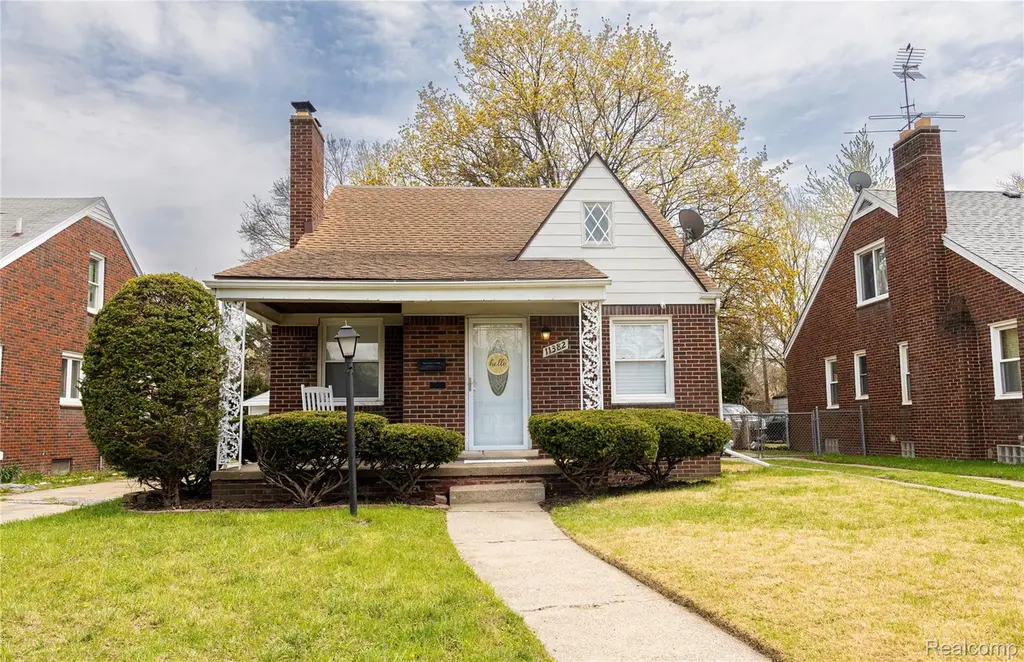
11382 Rossiter St St · Detroit, MI
Flood risk 1/10 · Minimal
- FEMA flood zone
- X (unshaded)
- Chance of flooding over 30 yrs
- 0.0%
- Est. flood insurance / yr
- $473 – $860
Fire risk 1/10 · Minimal
- Est. fire insurance / yr
- $784 – $1,456
Heat risk 3/10 · Minor
- Hot days now (above 95°F)
- 7 days/yr
- Hot days in 30 yrs
- 15 days/yr
Wind risk 2/10 · Minimal
- Chance of severe wind over 30 yrs
- —
Air-quality risk 3/10 · Minor
- Unhealthy air days now
- 2 days/yr
- Unhealthy air days in 30 yrs
- 5 days/yr
Risk factors via First Street. Map © Google.
Why this score? — see what drove the D grade
The composite is a weighted blend of 9 inputs, each scored 0–100. Each bar is that input's sub-score; the figure is the points it added to the 100-point composite (weight × sub-score).
- Cash flow +15.4/30.0
- ARV discount +7.5/15.0
- DSCR +4.7/10.0
- 1% rule +4.6/10.0
- Livability +3.7/5.0
- Rent growth +2.7/5.0
- Condition / age +2.5/5.0
- Schools +1.3/10.0
- Appreciation +0.0/10.0
$140,000
🖨 Deal sheet (PDF) 📄 Offer letter ✓ Due diligence
Listing remarks MLS
Beautifully updated modern home featuring 3 spacious bedrooms and 2 full bathrooms. Enjoy a stylish kitchen with marble countertops, a cozy living room with fireplace, and a partially finished basement perfect for entertaining. Complete with a fenced backyard and garage - move-in ready!
Key facts
- 6,534 sq ft lot
- Garage
- Built 1947
Property features AI
Exterior
- Parking: Detached garage (about 1.5 car)
- Utilities: Public water; Public sewer
- Home design: Single-family residence; Two levels; Ground-level entry
- Construction: Brick construction; Block foundation; Asphalt roof; Built-up living area above grade and finished lower level
- Exterior features: Porch; Paved road access; Pets allowed
Interior
- Bedrooms: Total of 3 rooms
- Bathrooms: 2 full bathrooms
- Heating & cooling: Forced air heating (natural gas); No central cooling
- Interior features: Fireplace in the living room; Partially finished basement
Neighborhood map
What this means for you Summary
Snapshot
- This is a 3-bed/1.0-bath single-family listed at $140k.
Deal economics
- At list price, monthly cash flow is $54 ($646/yr) — positive.
- The deal already cash-flows at list — no discount required.
- To meet the 1% rule (rent ≥ 1% of price), the offer needs to be $135k (3.7% below list).
- Recommended offer: $135k (3.7% below list) — sets the bar for 1% rule.
- Cap rate 6.8% vs local median 10.0% in Detroit — below-typical yield; the buyer is paying a premium for something (appreciation thesis, condition, location) that the cap rate doesn't capture.
Location & tenants
- Location reads 73/100 on livability (#218 in MI) — a middle-class / working-renter tenant base. Strengths: amenities A+, commute A+, cost of living A+; Watch: crime F, employment F.
- Detroit Public Schools Community District (urban): math 10% / reading 24% proficiency, ranked #499 of 540 in MI (top 92%) — low school quality limits family demand, transient renter base, plan for 1-2y turnover; 90% free/reduced lunch — lower-income household profile, screen leases tightly.
- Zoned schools: Carleton Elementary School (math 10% / reading 10%, grade F, #1,230 of 1,397 statewide, top 91%, 392 students, 96% FRL); Fisher Magnet Upper Academy (math 15% / reading 44%, grade F, #341 of 493 statewide, top 69%, 378 students, 93% FRL); Denby High School (math 24% / reading 24%, grade F, #481 of 713 statewide, top 81%, 537 students, 88% FRL) — zoned schools at 92% FRL track the district average.
- Market conditions: Rents flat; 492 active listings in the ZIP; 40 comparable units currently listed for rent nearby; rentals at typical pace (median 19d on market — plan ~3-4 weeks tenant-placement turnaround); lower-income renter base — watch delinquency; 2,639 units permitted in Wayne County in 2024 (1,216 in 5+ unit buildings).
- This rent runs 36% of the median local income ($45k/yr) — at the standard rent-burdened threshold; future hikes will face affordability resistance.
Forward outlook
- Local home prices are declining (-3.0%/yr); year-one equity from $968 of loan paydown is wiped out by about $4k of value loss. Plan a longer hold.
- Wayne County population projected at -17% by 2050 — secular population decline; favor cash flow + early exit over multi-decade hold.
Negotiation context
- Only 6 days on market — expect competitive offers; lowballing is unlikely to land.
- 14 sale attempts since 21y ago with the ask held roughly flat each time — persistent listings suggest the price (not the market) is what's stuck; bring a comps-based counter.
- Current owner paid $65k; list at $140k implies a 115% gain — meaningful room to come down on a strong offer.
Risks & watch-outs
- Watch-outs: built in 1947 — expect roof / HVAC / electrical / plumbing capex.
Questions for the listing agent
- Built in 1947 — when were the roof, HVAC, electrical panel, plumbing, and water heater last replaced?
- Is there a deadline driving the sale (1031 exchange, divorce, estate, relocation)? That informs how much negotiation room exists.
- Schools are F-rated, which usually means shorter tenancies and higher turnover. Who's the typical renter profile here, and what's been the actual vacancy rate?
- Crime grade is F in this area — have there been break-ins, vandalism, or insurance claims at this property in the last 3 years? What carrier currently insures it and at what premium?
- The area grade is low — what's the realistic commute time and amenity access for the typical tenant pool here? Any planned neighborhood developments (good or bad) we should know about?
- What's the average days-on-market for RENTAL listings here right now (not sales)? A rising rental-DOM trend means longer vacancies and softer asking-rent achievability than the comps imply.
- What's the recent tenant-quality profile in this submarket — average credit score on applications, eviction rate, late-payment / NSF rate, and stable-employment percentage? A property-management company in the area should have these aggregated.
- How much new for-sale + rental construction is in the pipeline within 1–3 miles? Heavy new supply typically softens prices + rents 12–24 months out; constrained supply supports both.
Investment metrics
- 1% rule
- 0.96% ✗
- Cap rate
- 6.75%
- Cash-on-cash
- 1.65%
- DSCR
- 1.07
- GRM
- 8.7
CMA / ARV
- ARV (on-the-fly)
- $77,520
- Comps found
- 12
Show comp detail 12 sales within ~0.75 mi
| Address | Dist | Beds/Ba | Sqft | Sold | Price | $/sf | Match |
|---|---|---|---|---|---|---|---|
| 11742 Whitehill St | 0.19mi | 3/1.5 | 1,228 (+8%) | 1mo | $61,000 | $50 | 76 |
| 12519 Riad St | 0.54mi | 3/1.0 | 1,135 (-0%) | 0mo | $100,000 | $88 | 74 |
| 10318 Beaconsfield St | 0.52mi | 3/1.5 | 1,146 (+0%) | 1mo | $78,000 | $68 | 72 |
| 9722 Everts St | 0.54mi | 3/1.0 | 1,178 (+3%) | 1mo | $147,000 | $125 | 69 |
| 10830 Mckinney St | 0.47mi | 3/1.0 | 1,066 (-6%) | 1mo | $40,199 | $38 | 66 |
| 11545 Roxbury St | 0.32mi | 3/1.0 | 1,003 (-12%) | 1mo | $65,000 | $65 | 64 |
| 9988 Somerset Ave | 0.67mi | 3/1.0 | 1,206 (+6%) | 1mo | $130,000 | $108 | 58 |
| 10904 N Mogul St | 0.66mi | 3/1.0 | 1,045 (-8%) | 0mo | $113,000 | $108 | 55 |
| 10319 Mckinney St | 0.42mi | 4/1.0 (+1) | 990 (-13%) | 1mo | $25,000 | $25 | 53 |
| 10901 Worden St | 0.61mi | 3/1.5 | 1,271 (+12%) | 1mo | $43,000 | $34 | 49 |
| 12893 Payton St | 0.74mi | 3/1.0 | 1,020 (-10%) | 2mo | $75,000 | $74 | 47 |
| 11640 Somerset Ave | 0.70mi | 3/2.0 | 1,028 (-10%) | 0mo | $70,000 | $68 | 47 |
Match score weights: distance 35% · size 25% · config 20% · recency 20%. Top-matched comps best support the ARV.
Projected returns pro-forma
-3.0% appreciation · 0.73% rent growth · sell at horizon
- IRR
- -16.3%
- Equity multiple
- 0.43×
- Total profit
- $-22,224
- Equity at exit
- $20,874
- IRR
- -12.9%
- Equity multiple
- 0.32×
- Total profit
- $-26,558
- Equity at exit
- $12,105
Cash invested: $39,200 (down + closing). Projections, not guarantees.
Landlord ↔ Tenant lean methodology
- Overall (STATE)
- 62 Landlord-Friendly
- State Michigan
- 62 Landlord-Friendly · EVEN
- County
- — inherits STATE
- City
- — inherits STATE
ZIP-level market 48224
- Rents YoY
- 0.7%
- Active inventory
- 492
- Price-to-rent
- 8.7×
Monthly cashflow live
- Estimated rent
- $1,349 high interval (Pro) →
- Mortgage (P&I)
- −$734
- Tax from tax record
- −$219 /mo · $2,629/yr
- Insurance
- −$58
- HOA
- −$0
- Vacancy / Maint / Mgmt
- −$283
- Net cashflow
- $54
Break-even live
Sensitivity live
| Price | -10% $133 | -5% $93 | +0% $54 | +5% $14 | +10% $-25 |
|---|---|---|---|---|---|
| Rent | -10% $-53 | -5% $1 | +0% $54 | +5% $107 | +10% $160 |
| Rate | -1.0pp $124 | -0.5pp $89 | base $54 | +0.5pp $18 | +1.0pp $-19 |
UW: 25.0% down · 7.5% · 30yr · 1.5% tax · 5.0% vac · 8.0% maint · 8.0% mgmt
Financing live
Cash to close
- Down payment
- $35,000
- Closing costs
- $4,200
- Reserves months
- —
- Total cash needed
- —
Loan-product check · same deal, 3 products live
Conventional
25% down · 7.5% · 30yr
- Down + closing
- —
- Monthly P&I
- —
- Monthly cashflow
- —
- DSCR
- —
- Eligible?
- —
Personal DTI + credit; lowest rate.
DSCR
20% down · 8.5% · 30yr
- Down + closing
- —
- Monthly P&I
- —
- Monthly cashflow
- —
- DSCR
- —
- Eligible?
- —
No personal income docs; deal must DSCR.
Hard money
10% down · 12.0% · 12mo
- Down + closing
- —
- Monthly P&I
- —
- Monthly cashflow
- —
- DSCR
- —
- Eligible?
- —
Short-term bridge; refi at stabilization.
Rent comps 40 comps
| Address | Beds | Baths | Sqft | Rent | $/sqft | DOM | Units | Dist |
|---|---|---|---|---|---|---|---|---|
| 11235 Roxbury St Detroit, MI | 3.0 | 1.0 | 1062 | $1,325 | $1.25 | 19d | 1 | 0.10mi |
| 11689 Wayburn St Detroit, MI | 3.0 | 1.0 | 1142 | $1,350 | $1.18 | 45d | 1 | 0.22mi |
| 11620 Rossiter St Detroit, MI | 3.0 | 1.0 | 1140 | $1,200 | $1.05 | 19d | 1 | 0.22mi |
| 11611 Morang Ave Detroit, MI | 1.0–2.0 | 1.0 | 709 | $1,040 | $1.47 | 45d | 1 | 0.26mi |
| 10803 Roxbury St Detroit, MI | 3.0 | 1.0 | 1150 | $900 | $0.78 | 22d | 1 | 0.26mi |
| 11911 Lansdowne St Detroit, MI | 4.0 | 1.0 | 1350 | $1,400 | $1.04 | 45d | 1 | 0.27mi |
| 11529 Roxbury St Detroit, MI | 2.0 | 1.0 | 720 | $1,200 | $1.67 | 14d | 1 | 0.32mi |
| 11776 Rossiter St Detroit, MI | 3.0 | 1.0 | 964 | $1,150 | $1.19 | 13d | 1 | 0.36mi |
| 10404 Somerset Ave Detroit, MI | 3.0 | 1.0 | 1108 | $1,475 | $1.33 | 5d | 1 | 0.38mi |
| 10177 Boleyn St Detroit, MI | 3.0 | 1.0 | 767 | $1,250 | $1.63 | 45d | 1 | 0.47mi |
| 10400 Britain St Detroit, MI | 3.0 | 1.0 | 890 | $1,100 | $1.24 | 45d | 1 | 0.47mi |
| 11018 Whitehill St Detroit, MI | 3.0 | 1.0 | 1146 | $1,450 | $1.27 | 12d | 1 | 0.48mi |
| 10370 Britain St Detroit, MI | 3.0 | 1.0 | 1100 | $1,100 | $1.00 | 45d | 1 | 0.49mi |
| 10692 Meuse St Detroit, MI | 3.0 | 1.0 | 955 | $1,250 | $1.31 | 14d | 1 | 0.51mi |
| 10037 Grayton St Detroit, MI | 3.0 | 1.0 | 1000 | $1,400 | $1.40 | 5d | 1 | 0.51mi |
| 9313 Harvard Rd Detroit, MI | 3.0 | 1.5 | 1329 | $1,200 | $0.90 | 19d | 1 | 0.56mi |
| 12075 Rossiter St Detroit, MI | 3.0 | 1.0 | 1100 | $1,245 | $1.13 | 45d | 1 | 0.59mi |
| 12075 Rossiter St Detroit, MI | 3.0 | 1.0 | 1100 | $1,245 | $1.13 | 16d | 1 | 0.59mi |
| 9635 Everts St Detroit, MI | 4.0 | 2.0 | 1450 | $1,650 | $1.14 | 45d | 1 | 0.60mi |
| 9241 Boleyn St Detroit, MI | 3.0 | 1.0 | 1350 | $1,350 | $1.00 | 45d | 1 | 0.61mi |
| 10813 Whitehill St Detroit, MI | 3.0 | 1.0 | 1392 | $1,350 | $0.97 | 19d | 1 | 0.61mi |
| 10644 Stratman St Detroit, MI | 2.0 | 1.0 | 1000 | $1,200 | $1.20 | 19d | 1 | 0.62mi |
| 10724 Whitehill St Detroit, MI | 3.0 | 3.0 | 1425 | $1,550 | $1.09 | 19d | 1 | 0.65mi |
| 12716 Riad St Detroit, MI | 3.0 | 1.0 | 974 | $1,275 | $1.31 | 19d | 1 | 0.65mi |
| 19144 Moross Rd Detroit, MI | 2.0 | 1.0 | 900 | $1,050 | $1.17 | 45d | 1 | 0.69mi |
| 15494 Mapleridge St Detroit, MI | 3.0 | 1.0 | 937 | $1,275 | $1.36 | 45d | 1 | 0.70mi |
| 9984 Beaconsfield St Detroit, MI | 3.0 | 1.0 | 1222 | $1,575 | $1.29 | 45d | 1 | 0.72mi |
| 10141 Roxbury St Detroit, MI | 3.0 | 1.0 | 1115 | $1,000 | $0.90 | 45d | 1 | 0.73mi |
| 19639 Moross Rd Unit 1 Detroit, MI | 2.0 | 1.0 | 900 | $1,100 | $1.22 | 45d | 1 | 0.76mi |
| 15238 Seymour St Detroit, MI | 3.0 | 1.0 | 1064 | $1,300 | $1.22 | 0d | 1 | 0.76mi |
| 9927 Beaconsfield St Detroit, MI | 3.0 | 1.0 | 942 | $1,375 | $1.46 | 16d | 1 | 0.77mi |
| 10985 Peerless St Detroit, MI | 3.0 | 1.0 | 1000 | $1,364 | $1.36 | 6d | 1 | 0.78mi |
| 9747 Somerset Ave Detroit, MI | 2.0 | 1.0 | 797 | $1,100 | $1.38 | 45d | 1 | 0.78mi |
| 19435 McCormick St Detroit, MI | 3.0 | 2.0 | 1148 | $1,300 | $1.13 | 19d | 1 | 0.79mi |
| 19442 Kingsville St Harper Woods, MI | 3.0 | 1.0 | 1000 | $1,500 | $1.50 | 19d | 1 | 0.82mi |
| 10870 Marne St Detroit, MI | 3.0 | 1.0 | 1156 | $1,100 | $0.95 | 19d | 1 | 0.82mi |
| 15000 Mayfield St Detroit, MI | 3.0 | 1.0 | 1146 | $970 | $0.85 | 19d | 1 | 0.84mi |
| 19365 Kingsville St Harper Woods, MI | 4.0 | 1.5 | 996 | $1,650 | $1.66 | 16d | 1 | 0.84mi |
| 15857 Evanston St Detroit, MI | 3.0 | 1.5 | 1232 | $1,250 | $1.01 | 6d | 1 | 0.86mi |
| 9755 Wayburn St Detroit, MI | 3.0 | 2.0 | 1498 | $1,400 | $0.93 | 5d | 1 | 0.86mi |
Listing history 40 events
-
2026-05-01status Pending 287-char remark
Show marketing remark (287 chars)
Beautifully updated modern home featuring 3 spacious bedrooms and 2 full bathrooms. Enjoy a stylish kitchen with marble countertops, a cozy living room with fireplace, and a partially finished basement perfect for entertaining. Complete with a fenced backyard and garage - move-in ready!
-
2026-05-01status Pending
Show marketing remark (287 chars)
Beautifully updated modern home featuring 3 spacious bedrooms and 2 full bathrooms. Enjoy a stylish kitchen with marble countertops, a cozy living room with fireplace, and a partially finished basement perfect for entertaining. Complete with a fenced backyard and garage - move-in ready!
-
2026-04-26$140,000 Active 287-char remark
Show marketing remark (287 chars)
Beautifully updated modern home featuring 3 spacious bedrooms and 2 full bathrooms. Enjoy a stylish kitchen with marble countertops, a cozy living room with fireplace, and a partially finished basement perfect for entertaining. Complete with a fenced backyard and garage - move-in ready!
-
2026-04-26$140,000 Active
Show marketing remark (287 chars)
Beautifully updated modern home featuring 3 spacious bedrooms and 2 full bathrooms. Enjoy a stylish kitchen with marble countertops, a cozy living room with fireplace, and a partially finished basement perfect for entertaining. Complete with a fenced backyard and garage - move-in ready!
-
2026-04-25historical $140,000 287-char remark
Show marketing remark (287 chars)
Beautifully updated modern home featuring 3 spacious bedrooms and 2 full bathrooms. Enjoy a stylish kitchen with marble countertops, a cozy living room with fireplace, and a partially finished basement perfect for entertaining. Complete with a fenced backyard and garage - move-in ready!
-
2026-02-17historical
-
2026-02-17historical
-
2026-02-13price $139,999
-
2026-02-12price $139,999
-
2026-02-03historical
-
2026-02-03historical
-
2025-12-03price $150,000
-
2025-12-02price $150,000
-
2025-10-02$150,000 Active
-
2025-10-02$150,000 Active
-
2025-10-02$169,000 Active
-
2025-10-02$169,000 Active
-
2025-01-30soldstatus $65,000
-
2022-03-14soldstatus $65,000
-
2022-02-11soldstatus $45,000
-
2020-02-14historical
-
2019-11-05status Pending
-
2019-11-05status Pending
-
2019-11-05historical
-
2019-10-24price $45,000
-
2019-10-23price $45,000
-
2019-10-23status Active
-
2019-10-23status Active
-
2019-10-01status Pending
-
2019-09-30status Pending
-
2019-08-08$50,000 Active
-
2019-08-08$50,000 Active
-
2016-06-18historical
-
2016-06-18historical
-
2016-06-02$18,500 Active
-
2016-06-02$18,500 Active
-
2006-06-08soldstatus $85,000
-
2006-05-06historical
-
2005-11-06$99,900
-
2005-11-06$99,900
ⓘ Source: listings_history table (triggers on properties + properties_extension) + one-shot
backfill from property_details.listing_events for pre-trigger history.
Tax reassessment forecast MI · Partial reset (capped growth)
- Current annual tax
- $2,629 · $219/mo
- Projected year-2 tax
- $2,629 · $219/mo
- Expected delta
- $0/yr ($0/mo · 0.0%)
ⓘ Screening estimate from a state-policy table — verify with the county assessor before closing.
Climate risk First Street
- Flood 1/10 Low FEMA zone X (unshaded) · 0% chance over 30 yrs
- Wildfire 1/10 Low
- Heat 3/10 Moderate 7 d/yr ≥95°F today · 15 d/yr by 30 yrs out
- Wind 2/10 Low
- Air quality 3/10 Moderate 2 unhealthy d/yr today · 5 by 30 yrs out
Nearby sold comps map
Loading sold comps map…
Walkable amenities ~0.75 mi
Loading nearby amenities…
Taxation est. · year 1
- Rental income
- $16,183
- − Mortgage interest
- −$7,842
- − Property taxes
- −$2,629
- − Insurance
- −$700
- − Repairs & maintenance
- −$1,295
- − Management
- −$1,295
- − Depreciation
- −$4,073
- Taxable loss
- −$1,650
- Est. tax savings @ 24.0%
- +$396
- After-tax cash flow
- $1,042/yr
For passive investors: Depreciation is non-cash, so a rental often shows a tax loss while cash-flowing — sheltering income. Rental losses are passive: they offset passive income freely, and up to $25,000/yr can offset ordinary (W-2) income if you actively participate and your MAGI is under $100k (phasing out to $0 by $150k); unused losses carry forward. On sale, claimed depreciation is recaptured at up to 25%, and gains may owe capital-gains tax (a 1031 exchange can defer both). Figures are a year-1 estimate at your 24.0% rate — not tax advice; consult a CPA.
Schools (NCES district)
- District
- Detroit Public Schools Community District
- NCES district ID
- 2601103
- Math proficiency
- 10% ▼ -2.00%
- Reading proficiency
- 24% ▲ 6.00%
- Median HH income
- $25,815
- Composite
- 13.06/100
- National rank
- #9564
- State rank
- #499 of 540 in MI
Livability — Detroit
- Score
- 73/100
- State rank
- #218
- US rank
- #5427
Category grades
Schools grade is shown separately in the Schools card above.
Census & demographics
- Census place
- Detroit, MI
- County
- Wayne County · 1,562,939 people
- City population
- 572,865
- Metro
- Detroit-Warren-Dearborn, MI
- Population (ZIP)
- 39,668
- Household income
- $44,856
- Rent vs Own
- Severe rent burden
- 2515.0
Population outlook (Wayne County) Hauer SSP2
- Today (2025)
- 1,675,273 people
- By 2030
- 1,620,300 · -3.3%
- By 2040
- 1,502,341 · -10.3%
- By 2050
- 1,384,039 · -17.4%
- By 2075
- 1,124,592 · -32.9%
- By 2100
- 881,193 · -47.4%
Race, ethnicity, and origin ACS 2023
- Neighborhood character
- Predominantly Black (88%)
- Race & ethnicity
- Black 88% White 8% Two or more races 3% Hispanic / Latino 1%
- Common ancestry
- Iranian 1% Romanian 1% Lithuanian 1%
- Foreign-born
- 1%
- Languages at home
- 97% English-only · Spanish 2%
Political lean MEDSL · Wayne
- 2024 margin
- Strong D (+29.0) · D 62.7% · R 33.7% · Other 3.6%
- 2008→2024 swing
- -20.5pp toward R · 2008: 49.5pp · 2024: 29.0pp
- All cycles
- 2024: D+29.0 2020: D+38.1 2016: D+37.3 2012: D+46.9 2008: D+49.5
Not yet ingested
- Civics
- —
Market trends
- HPI YoY
- ▼ -226.38%
- Current HPI
- 161.886
- Rent YoY
- ▲ 0.73%
- Metro
- Detroit-Warren-Dearborn, MI
- State GDP YoY
- ▲ 1.37%
- F500 in state
- 28
Industry mix (Fortune 500 HQ in MI)
| Industry | F500 HQs | Revenue |
|---|---|---|
| Automotive Parts | 3 | $48B |
|
||
| Automotive | 2 | $372B |
|
||
| Chemicals | 1 | $45B |
|
||
| Automotive Retail | 1 | $29B |
|
||
| Healthcare / Medical Devices | 1 | $23B |
|
||
| Automotive Technology | 1 | $20B |
|
||
Price history
+40.1% since first listed40 events — show timeline
- 2026-05-01 Pending — MiRealSource-MiMLS
- 2026-05-01 Pending — REALCOMP
- 2026-04-26 Listed $140,000 MiRealSource-MiMLS
- 2026-04-26 Listed $140,000 REALCOMP
- 2026-04-25 Coming Soon $140,000 MiRealSource-MiMLS
- 2026-02-17 Listing Removed — REALCOMP
- 2026-02-17 Listing Removed — MiRealSource-MiMLS
- 2026-02-13 Price Changed $139,999 MiRealSource-MiMLS
- 2026-02-12 Price Changed $139,999 REALCOMP
- 2026-02-03 Listing Removed — MiRealSource-MiMLS
- 2026-02-03 Listing Removed — REALCOMP
- 2025-12-03 Price Changed $150,000 MiRealSource-MiMLS
- 2025-12-02 Price Changed $150,000 REALCOMP
- 2025-10-02 Listed $169,000 MiRealSource-MiMLS
- 2025-10-02 Listed $169,000 REALCOMP
- 2025-10-02 Listed $150,000 REALCOMP
- 2025-10-02 Listed $150,000 MiRealSource-MiMLS
- 2025-01-30 Sold (Public Records) $65,000 Public Records
- 2022-03-14 Sold (Public Records) $65,000 Public Records
- 2022-02-11 Sold (Public Records) $45,000 Public Records
- 2020-02-14 Listing Removed — REALCOMP
- 2019-11-05 Pending — MiRealSource-MiMLS
- 2019-11-05 Pending — REALCOMP
- 2019-11-05 Listing Removed — MiRealSource-MiMLS
- 2019-10-24 Price Changed $45,000 MiRealSource-MiMLS
- 2019-10-23 Price Changed $45,000 REALCOMP
- 2019-10-23 Relisted — MiRealSource-MiMLS
- 2019-10-23 Relisted — REALCOMP
- 2019-10-01 Pending — MiRealSource-MiMLS
- 2019-09-30 Pending — REALCOMP
- 2019-08-08 Listed $50,000 MiRealSource-MiMLS
- 2019-08-08 Listed $50,000 REALCOMP
- 2016-06-18 Listing Removed — MiRealSource-MiMLS
- 2016-06-18 Listing Removed — REALCOMP
- 2016-06-02 Listed $18,500 MiRealSource-MiMLS
- 2016-06-02 Listed $18,500 REALCOMP
- 2006-06-08 Sold (MLS) $85,000 REALCOMP
- 2006-05-06 Listing Removed — MiRealSource-MiMLS
- 2005-11-06 Listed $99,900 MiRealSource-MiMLS
- 2005-11-06 Listed $99,900 REALCOMP
Property tax history
+3.2%/yrLatest (2025): $2,629 · -54.6% YoY. Source: county tax records.
Cash-flow waterfall
monthlySold comps — $/sqft
last 12 mo · ≤1 miLoading sold comps…