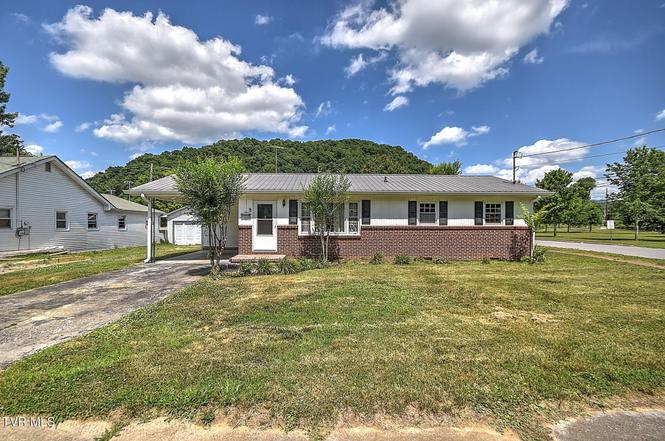
412 Main St · Elizabethton, TN
Flood risk 8/10 · Major
- FEMA flood zone
- AE
- Chance of flooding over 30 yrs
- 0.99%
- Est. flood insurance / yr
- $1,737 – $8,500
Fire risk 4/10 · Minor
- Est. fire insurance / yr
- $949 – $1,763
Heat risk 5/10 · Moderate
- Hot days now (above 97°F)
- 7 days/yr
- Hot days in 30 yrs
- 21 days/yr
Wind risk 2/10 · Minimal
- Chance of severe wind over 30 yrs
- —
Air-quality risk 2/10 · Minimal
- Unhealthy air days now
- 1 days/yr
- Unhealthy air days in 30 yrs
- 1 days/yr
Risk factors via First Street. Map © Google.
Why this score? — see what drove the B- grade
The composite is a weighted blend of 9 inputs, each scored 0–100. Each bar is that input's sub-score; the figure is the points it added to the 100-point composite (weight × sub-score).
- Cash flow +25.8/30.0
- ARV discount +15.0/15.0
- DSCR +8.6/10.0
- 1% rule +5.5/10.0
- Livability +3.3/5.0
- Schools +2.9/10.0
- Rent growth +2.5/5.0
- Condition / age +2.5/5.0
- Appreciation +0.0/10.0
$190,000
🖨 Deal sheet (PDF) 📄 Offer letter ✓ Due diligence
Listing remarks MLS
Nice one level home on dead-end street. Home offers 3 bedroom, 2 bath, great room and den. The den has a fireplace with gas logs. Hardwood flooring. Newer metal roof, central heat and air approx. 1 yr old, newer windows. Fenced back yard with over size patio. Nice large out building. One car carport attached. Information deemed reliable but not guaranteed. Buyers and buyers agent must confirm.
Key facts
- Metal roof
- Updated windows
- Gas fireplace
Tags
Property features AI
Finance
- Other: Property zoned residential; Topography: flood zone, level; Lot dimensions approximately 62M x 150 IRR
Exterior
- Parking: Has carport (1 carport space); Driveway with asphalt surface
- Utilities: Public water; Public sewer
- Home design: Single-family house; One level; Residential property in the Sanborn subdivision; Property listed in fixer condition; Corner lot (directions indicate home on left at corner)
- Construction: Brick and vinyl siding construction
- Exterior features: Back yard fencing; Outbuilding on the property; Metal roof
Interior
- Kitchen: Built-in electric oven; Cooktop; Dishwasher; Refrigerator
- Bedrooms: Total of 6 rooms (includes bedrooms and living areas)
- Flooring: Hardwood floors
- Bathrooms: 2 full bathrooms
- Heating & cooling: Heat pump for heating and cooling
- Interior features: Built-in electric oven, cooktop, dishwasher, refrigerator; Fireplace in den; Crawl space basement
Neighborhood map
What this means for you Summary
Snapshot
- This is a 3-bed/2.0-bath single-family listed at $190k.
Deal economics
- At list price, monthly cash flow is $34 ($413/yr) — positive.
- The deal already cash-flows at list — no discount required.
- Meets the 1% rule at list price ($2k rent vs $190k).
- Cap rate 9.2% vs local median 3.6% in Elizabethton — top-decile yield for the area; either an underpriced asset or a hidden risk that comps aren't pricing in. Stress-test before assuming the spread holds.
Location & tenants
- Location reads 66/100 on livability (#121 in TN) — a middle-class / working-renter tenant base. Strengths: cost of living A+, housing A, crime A-; Watch: amenities F, commute F, employment F.
- Elizabethton (suburban): math 36% / reading 35% proficiency, ranked #35 of 139 in TN (top 25%) — families likely to look elsewhere, expect single-tenant / working-renter base with shorter leases.
- Zoned schools: Harold Mccormick Elementary (math 27% / reading 32%, grade F, #423 of 952 statewide, top 48%, 380 students, 0% FRL); T A Dugger Junior High School (math 42% / reading 28%, grade F, #65 of 333 statewide, top 20%, 633 students, 0% FRL); Elizabethton High School (math 17% / reading 41%, grade F, #92 of 332 statewide, top 28%, 863 students, 0% FRL) — zoned schools average 0% FRL vs 43% district-wide (43 pts lower); this property's tenant base skews higher-income than the district average.
- Market conditions: 178 active listings in the ZIP; 1 comparable units currently listed for rent nearby; 184 units permitted in Carter County in 2024 (0 in 5+ unit buildings).
Forward outlook
- Local home prices are declining (-3.0%/yr); year-one equity from $1k of loan paydown is wiped out by about $6k of value loss. Plan a longer hold.
- Carter County population projected at -21% by 2050 — secular population decline; favor cash flow + early exit over multi-decade hold.
Negotiation context
- Only 7 days on market — expect competitive offers; lowballing is unlikely to land.
- 3 sale attempts since 10y ago with the ask held roughly flat each time — persistent listings suggest the price (not the market) is what's stuck; bring a comps-based counter.
- Current owner paid $126k; list at $190k implies a 51% gain — meaningful room to come down on a strong offer.
Risks & watch-outs
- Watch-outs: flood insurance adds $427/mo.
- Climate carrying-cost: in FEMA flood zone AE (mandatory federal flood insurance); extreme-heat days projected 7→21/yr by 2055 (HVAC capex compounding) — expect insurance premiums to compound above CPI over the hold.
Questions for the listing agent
- Built in 1961 — when were the roof, HVAC, electrical panel, plumbing, and water heater last replaced?
- What's the actual annual flood-insurance premium (NFIP or private), and is the property in a SFHA with mandatory coverage?
- Is there a deadline driving the sale (1031 exchange, divorce, estate, relocation)? That informs how much negotiation room exists.
- Schools are D-rated, which usually means shorter tenancies and higher turnover. Who's the typical renter profile here, and what's been the actual vacancy rate?
- What's the average days-on-market for RENTAL listings here right now (not sales)? A rising rental-DOM trend means longer vacancies and softer asking-rent achievability than the comps imply.
- What's the recent tenant-quality profile in this submarket — average credit score on applications, eviction rate, late-payment / NSF rate, and stable-employment percentage? A property-management company in the area should have these aggregated.
- How much new for-sale + rental construction is in the pipeline within 1–3 miles? Heavy new supply typically softens prices + rents 12–24 months out; constrained supply supports both.
Investment metrics
- 1% rule
- 1.05% ✓
- Cap rate
- 9.20%
- Cash-on-cash
- 10.40%
- DSCR
- 1.46
- GRM
- 7.9
CMA / ARV
- ARV (on-the-fly)
- $270,864
- Comps found
- 12
Show comp detail 12 sales within ~0.75 mi
| Address | Dist | Beds/Ba | Sqft | Sold | Price | $/sf | Match |
|---|---|---|---|---|---|---|---|
| 700a Johnson Ave | 0.40mi | 3/2.0 | 1,300 (-5%) | 2mo | $270,000 | $208 | 71 |
| 1313 Siam Rd | 0.73mi | 3/2.0 | 1,380 (+1%) | 3mo | $164,250 | $119 | 62 |
| 310 2nd St | 0.38mi | 2/1.0 (-1) | 1,325 (-3%) | 9mo | $179,900 | $136 | 61 |
| 816 Riverview Dr | 0.49mi | 3/1.5 | 1,260 (-8%) | 2mo | $257,500 | $204 | 60 |
| 1212 Thomas Boulevard Blvd | 0.64mi | 3/1.5 | 1,304 (-5%) | 4mo | $251,000 | $192 | 56 |
| 604 2nd St | 0.47mi | 3/2.0 | 1,482 (+8%) | 10mo | $257,000 | $173 | 56 |
| 1013 Siam Rd | 0.51mi | 3/2.0 | 1,188 (-13%) | 1mo | $160,000 | $135 | 54 |
| 910 Fairview St | 0.73mi | 3/1.0 | 1,308 (-4%) | 3mo | $222,000 | $170 | 52 |
| 1102 Broad St St | 0.65mi | 3/1.5 | 1,286 (-6%) | 10mo | $255,000 | $198 | 50 |
| 616 Pine St | 0.73mi | 3/2.0 | 1,250 (-9%) | 3mo | $295,900 | $237 | 49 |
| 218 Old Siam Rd | 0.74mi | 3/2.0 | 1,515 (+11%) | 1mo | $387,000 | $255 | 47 |
| 905 Central Ave | 0.70mi | 3/2.0 | 1,200 (-12%) | 11mo | $269,000 | $224 | 38 |
Match score weights: distance 35% · size 25% · config 20% · recency 20%. Top-matched comps best support the ARV.
Projected returns pro-forma
-3.0% appreciation · 3.0% rent growth · sell at horizon
- IRR
- -14.9%
- Equity multiple
- 0.47×
- Total profit
- $-28,423
- Equity at exit
- $28,330
- IRR
- -6.2%
- Equity multiple
- 0.60×
- Total profit
- $-21,225
- Equity at exit
- $16,428
Cash invested: $53,200 (down + closing). Projections, not guarantees.
Landlord ↔ Tenant lean methodology
- Overall (STATE)
- 87 Strongly Landlord-Friendly
- State Tennessee
- 87 Strongly Landlord-Friendly · R+13
- County
- — inherits STATE
- City
- — inherits STATE
ZIP-level market 37643
- Home prices YoY
- -19.3%
- Active inventory
- 178
- Price-to-rent
- 7.9×
Monthly cashflow live
- Estimated rent
- $2,000 medium interval (Pro) →
- Mortgage (P&I)
- −$996
- Tax from tax record
- −$44 /mo · $522/yr
- Insurance
- −$79
- Flood insurance flood zone
- −$427 /mo · $5,118/yr
- HOA
- −$0
- Vacancy / Maint / Mgmt
- −$420
- Net cashflow
- $34
Break-even live
Sensitivity live
| Price | -10% $142 | -5% $88 | +0% $34 | +5% $-19 | +10% $-73 |
|---|---|---|---|---|---|
| Rent | -10% $-124 | -5% $-45 | +0% $34 | +5% $113 | +10% $192 |
| Rate | -1.0pp $130 | -0.5pp $83 | base $34 | +0.5pp $-15 | +1.0pp $-65 |
UW: 25.0% down · 7.5% · 30yr · 1.5% tax · 5.0% vac · 8.0% maint · 8.0% mgmt
Financing live
Cash to close
- Down payment
- $47,500
- Closing costs
- $5,700
- Reserves months
- —
- Total cash needed
- —
Loan-product check · same deal, 3 products live
Conventional
25% down · 7.5% · 30yr
- Down + closing
- —
- Monthly P&I
- —
- Monthly cashflow
- —
- DSCR
- —
- Eligible?
- —
Personal DTI + credit; lowest rate.
DSCR
20% down · 8.5% · 30yr
- Down + closing
- —
- Monthly P&I
- —
- Monthly cashflow
- —
- DSCR
- —
- Eligible?
- —
No personal income docs; deal must DSCR.
Hard money
10% down · 12.0% · 12mo
- Down + closing
- —
- Monthly P&I
- —
- Monthly cashflow
- —
- DSCR
- —
- Eligible?
- —
Short-term bridge; refi at stabilization.
Rent comps 1 comps
| Address | Beds | Baths | Sqft | Rent | $/sqft | DOM | Units | Dist |
|---|---|---|---|---|---|---|---|---|
| 107 Ingram St Elizabethton, TN | 3.0 | 2.0 | 1500 | $2,000 | $1.33 | 15d | 1 | 0.25mi |
Listing history 17 events
-
2026-06-22days on market $190,000 Active 7 DOM
-
2026-06-19days on market $190,000 Active 5 DOM
-
2026-06-18days on market $190,000 Active 4 DOM
-
2026-06-17days on market $190,000 Active 3 DOM
-
2026-06-16days on market $190,000 Active 2 DOM
-
2026-06-15remarks 699-char remark
-
2026-06-15days on market $190,000 Active 1 DOM
-
2026-04-27price $190,000
-
2026-02-17price $194,900
-
2026-01-07$199,900 Active
-
2020-09-14soldstatus $126,000
-
2020-09-08soldstatus $126,000 396-char remark
Show marketing remark (396 chars)
Nice one level home on dead-end street. Home offers 3 bedroom, 2 bath, great room and den. The den has a fireplace with gas logs. Hardwood flooring. Newer metal roof, central heat and air approx. 1 yr old, newer windows. Fenced back yard with over size patio. Nice large out building. One car carport attached. Information deemed reliable but not guaranteed. Buyers and buyers agent must confirm.
-
2020-06-16$134,900 396-char remark
Show marketing remark (396 chars)
Nice one level home on dead-end street. Home offers 3 bedroom, 2 bath, great room and den. The den has a fireplace with gas logs. Hardwood flooring. Newer metal roof, central heat and air approx. 1 yr old, newer windows. Fenced back yard with over size patio. Nice large out building. One car carport attached. Information deemed reliable but not guaranteed. Buyers and buyers agent must confirm.
-
2017-02-06soldstatus $94,500
-
2017-02-03soldstatus $94,500 940-char remark
Show marketing remark (940 chars)
Located in the heart of downtown Elizabethton, within walking distance of the historic Covered Bridge, City Parks and Walking Trails, this all one level home is situated on a pretty level corner lot. Home has been very well maintained and features an updated metal roof. Open concept living room, that overlooks the river. kitchen and dining with original hardwood flooring. Three bedrooms. Two bathrooms. Large family room with hardwood flooring and a fireplace. Off the family room there is a large patio overlooking the level backyard which is chain link fenced, offering and ideal area for kids and pets. Large Laundry room. Attached one car carport and a good sized storage shed. Central heating and air conditioning. The convenience of this very nice home is very desirable and highly sought after. The well maintained condition of the home makes it move in ready. All info. taken from Tax Records. Buyer/Buyer s Agent to verify all.
-
2016-04-06$97,900 940-char remark
Show marketing remark (940 chars)
Located in the heart of downtown Elizabethton, within walking distance of the historic Covered Bridge, City Parks and Walking Trails, this all one level home is situated on a pretty level corner lot. Home has been very well maintained and features an updated metal roof. Open concept living room, that overlooks the river. kitchen and dining with original hardwood flooring. Three bedrooms. Two bathrooms. Large family room with hardwood flooring and a fireplace. Off the family room there is a large patio overlooking the level backyard which is chain link fenced, offering and ideal area for kids and pets. Large Laundry room. Attached one car carport and a good sized storage shed. Central heating and air conditioning. The convenience of this very nice home is very desirable and highly sought after. The well maintained condition of the home makes it move in ready. All info. taken from Tax Records. Buyer/Buyer s Agent to verify all.
-
1998-11-04soldstatus $50,000
ⓘ Source: listings_history table (triggers on properties + properties_extension) + one-shot
backfill from property_details.listing_events for pre-trigger history.
Tax reassessment forecast TN · Resets to sale price
- Current annual tax
- $522 · $44/mo
- Projected year-2 tax
- $1,349 · $112/mo
- Expected delta
- +$827/yr (+$69/mo · 158.4%)
ⓘ Screening estimate from a state-policy table — verify with the county assessor before closing.
Climate risk First Street
- Flood 8/10 Severe FEMA zone AE · 99% chance over 30 yrs
- Wildfire 4/10 Moderate
- Heat 5/10 Major 7 d/yr ≥97°F today · 21 d/yr by 30 yrs out
- Wind 2/10 Low
- Air quality 2/10 Low 1 unhealthy d/yr today · 1 by 30 yrs out
Nearby sold comps map
Loading sold comps map…
Walkable amenities ~0.75 mi
Loading nearby amenities…
Taxation est. · year 1
- Rental income
- $24,000
- − Mortgage interest
- −$10,643
- − Property taxes
- −$522
- − Insurance
- −$6,068
- − Repairs & maintenance
- −$1,920
- − Management
- −$1,920
- − Depreciation
- −$5,527
- Taxable loss
- −$2,601
- Est. tax savings @ 24.0%
- +$624
- After-tax cash flow
- $1,037/yr
For passive investors: Depreciation is non-cash, so a rental often shows a tax loss while cash-flowing — sheltering income. Rental losses are passive: they offset passive income freely, and up to $25,000/yr can offset ordinary (W-2) income if you actively participate and your MAGI is under $100k (phasing out to $0 by $150k); unused losses carry forward. On sale, claimed depreciation is recaptured at up to 25%, and gains may owe capital-gains tax (a 1031 exchange can defer both). Figures are a year-1 estimate at your 24.0% rate — not tax advice; consult a CPA.
Schools (NCES district)
- District
- Elizabethton
- NCES district ID
- 4701110
- Math proficiency
- 36% ▼ -12.00%
- Reading proficiency
- 35% ▼ -8.00%
- Median HH income
- $30,800
- Composite
- 28.94/100
- National rank
- #6630
- State rank
- #35 of 139 in TN
Livability — Elizabethton
- Score
- 66/100
- State rank
- #121
- US rank
- #11785
Category grades
Schools grade is shown separately in the Schools card above.
Census & demographics
- Census place
- Elizabethton, TN
- City population
- 513
- Population (ZIP)
- 33,690
Population outlook (Carter County) Hauer SSP2
- Today (2025)
- 54,493 people
- By 2030
- 52,639 · -3.4%
- By 2040
- 47,929 · -12.0%
- By 2050
- 42,877 · -21.3%
- By 2075
- 31,487 · -42.2%
- By 2100
- 21,979 · -59.7%
Race, ethnicity, and origin ACS 2023
- Neighborhood character
- Predominantly White (93%)
- Race & ethnicity
- White 93% Two or more races 3% Hispanic / Latino 3% Black 2%
- Common ancestry
- Serbian 3% Slovak 2% Italian 2%
- Foreign-born
- 2% · Canada
- Languages at home
- 98% English-only · Spanish 2%
Political lean MEDSL · Carter
- 2024 margin
- Solid R (+63.2) · D 17.9% · R 81.2%
- 2008→2024 swing
- -16.1pp toward R · 2008: -47.2pp · 2024: -63.2pp
- All cycles
- 2024: R+63.2 2020: R+61.5 2016: R+64.0 2012: R+52.0 2008: R+47.2
Not yet ingested
- Civics
- —
Market trends
- HPI YoY
- ▼ -77.08%
- Current HPI
- 321.4024
- Rent YoY
- —
- Metro
- —
- State GDP YoY
- ▲ 2.78%
- F500 in state
- 22
Industry mix (Fortune 500 HQ in TN)
| Industry | F500 HQs | Revenue |
|---|---|---|
| Healthcare | 3 | $91B |
|
||
| Retail | 3 | $72B |
|
||
| Transportation / Logistics | 1 | $88B |
|
||
| Paper / Packaging | 1 | $19B |
|
||
| Insurance | 1 | $13B |
|
||
| Energy | 1 | $12B |
|
||
Price history
+280.0% since first listed10 events — show timeline
- 2026-04-27 Price Changed $190,000 TVRMLS
- 2026-02-17 Price Changed $194,900 TVRMLS
- 2026-01-07 Listed $199,900 TVRMLS
- 2020-09-14 Sold (Public Records) $126,000 Public Records
- 2020-09-08 Sold (MLS) $126,000 TVRMLS
- 2020-06-16 Listed $134,900 TVRMLS
- 2017-02-06 Sold (Public Records) $94,500 Public Records
- 2017-02-03 Sold (MLS) $94,500 TVRMLS
- 2016-04-06 Listed $97,900 TVRMLS
- 1998-11-04 Sold (Public Records) $50,000 Public Records
Property tax history
-5.1%/yrLatest (2025): $522 · -56.3% YoY. Source: county tax records.
Cash-flow waterfall
monthlySold comps — $/sqft
last 12 mo · ≤1 miLoading sold comps…