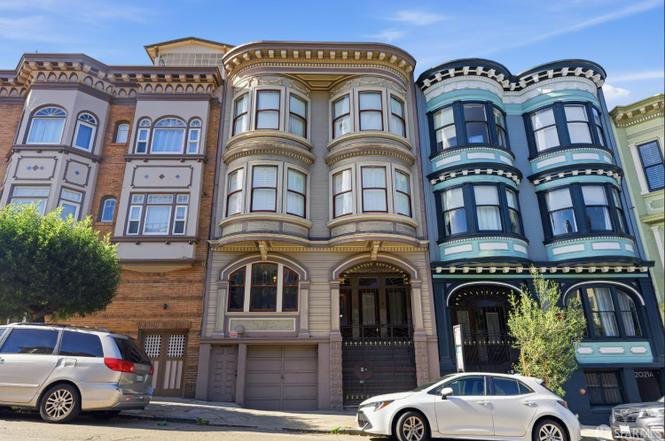
2011 Powell St · San Francisco, CA
Flood risk 1/10 · Minimal
- FEMA flood zone
- X (unshaded)
- Chance of flooding over 30 yrs
- 0.0%
- Est. flood insurance / yr
- $507 – $1,088
Fire risk 1/10 · Minimal
- Est. fire insurance / yr
- $659 – $1,223
Heat risk 3/10 · Minor
- Hot days now (above 79°F)
- 8 days/yr
- Hot days in 30 yrs
- 17 days/yr
Wind risk 1/10 · Minimal
- Chance of severe wind over 30 yrs
- —
Air-quality risk 8/10 · Major
- Unhealthy air days now
- 15 days/yr
- Unhealthy air days in 30 yrs
- 15 days/yr
Risk factors via First Street. Map © Google.
Why this score? — see what drove the D grade
The composite is a weighted blend of 9 inputs, each scored 0–100. Each bar is that input's sub-score; the figure is the points it added to the 100-point composite (weight × sub-score).
- Appreciation +8.2/10.0
- ARV discount +7.5/15.0
- Cash flow +7.0/30.0
- Rent growth +5.0/5.0
- Schools +5.0/10.0
- Livability +3.8/5.0
- 1% rule +2.8/10.0
- Condition / age +2.5/5.0
- DSCR +1.2/10.0
$899,000
🖨 Deal sheet (PDF) 📄 Offer letter ✓ Due diligence
Listing remarks
Welcome to classic San Francisco living in the heart of North Beach. This beautifully refreshed first floor condominium sits in a quiet three unit Edwardian building just steps from some of the city's most iconic neighborhoods and attractions. Recently remodeled, the home features new walls, updated flooring, fresh paint, and numerous thoughtful improvements throughout creating a bright and comfortable space that blends historic charm with modern livability. Large windows bring in natural light while the efficient layout makes everyday living feel easy and functional. The location truly shines with cafs, bakeries, and renowned restaurants of North Beach right outside your door and Chinatown
Key facts
- Large windows
- Natural light
- Efficient layout
Tags
Neighborhood map
What this means for you Summary
Snapshot
- This is a 3-bed/1.0-bath condo listed at $899k.
Deal economics
- At list price, monthly cash flow is $-1k ($-16k/yr) — negative.
- To cash-flow at today's rent, offer at most $665k (26.0% below list).
- To meet the 1% rule (rent ≥ 1% of price), the offer needs to be $702k (21.9% below list).
- Recommended offer: $665k (26.0% below list) — sets the bar for cash-flow.
- Cap rate 4.5% vs local median 2.1% in San Francisco — top-decile yield for the area; either an underpriced asset or a hidden risk that comps aren't pricing in. Stress-test before assuming the spread holds.
Location & tenants
- Location reads 76/100 on livability (#90 in CA, #3,143 nationally) — a middle-class / working-renter tenant base. Strengths: amenities A+, commute A+, employment A+; Watch: crime F, cost of living F.
- San Francisco Unified (urban): math 50% / reading 56% proficiency, ranked #322 of 1,400 in CA (top 23%) — acceptable for families but not a draw, mixed tenant base, ~2y average lease.
- Market conditions: Rents rising fast (+16.9%/yr); 60 active listings in the ZIP; 40 comparable units currently listed for rent nearby; rentals at typical pace (median 23d on market — plan ~3-4 weeks tenant-placement turnaround); solid renter incomes; 750 units permitted in San Francisco County in 2024 (688 in 5+ unit buildings).
- At $7,022/mo this rent would consume 97% of the median local household income ($87k/yr) (locally 2027% of renters already pay >50% of income on rent) — very limited rent-growth headroom before tenants either downsize or default.
Forward outlook
- In year one you build about $64k of equity ($6k loan paydown + $58k appreciation (6.4% local appreciation)).
- San Francisco County population projected at +39% by 2050 — long-run rental-demand tailwind backs the buy-and-hold thesis.
- By year 2, paydown + projected appreciation supports a ~$103k cash-out refi (75% LTV) — recoverable capital for the next deal without selling this one.
Negotiation context
- It's been on market 38 days — a 3% lower offer ($872k) is reasonable based on typical stale-listing flexibility.
- 3 sale attempts with the ask held roughly flat each time — persistent listings suggest the price (not the market) is what's stuck; bring a comps-based counter.
Risks & watch-outs
- Watch-outs: built in 1912 — expect roof / HVAC / electrical / plumbing capex.
Questions for the listing agent
- What do current leases actually rent for vs. the listed asking? Can we see a recent rent roll and the last 12 months of T-12 income?
- It's been on market 38 days. Have you received any prior offers? Is the seller open to a 26% concession, seller financing, or rate buy-down credit?
- Built in 1912 — when were the roof, HVAC, electrical panel, plumbing, and water heater last replaced?
- What does the HOA fee cover, when was the last increase, and are there any pending special assessments or reserve-fund shortfalls?
- Any open or pending special assessments — roof, HVAC, plumbing, elevator, façade? What's the per-unit balance and payoff schedule, and is the seller paying it off at close or rolling it to the buyer?
- Is there a deadline driving the sale (1031 exchange, divorce, estate, relocation)? That informs how much negotiation room exists.
- Schools are B-rated — typically a magnet for longer-tenancy family renters. What's the average tenant stay here, and is there a school-zone premium baked into asking?
- Crime grade is F in this area — have there been break-ins, vandalism, or insurance claims at this property in the last 3 years? What carrier currently insures it and at what premium?
- The area grade is low — what's the realistic commute time and amenity access for the typical tenant pool here? Any planned neighborhood developments (good or bad) we should know about?
- What's the average days-on-market for RENTAL listings here right now (not sales)? A rising rental-DOM trend means longer vacancies and softer asking-rent achievability than the comps imply.
- What's the recent tenant-quality profile in this submarket — average credit score on applications, eviction rate, late-payment / NSF rate, and stable-employment percentage? A property-management company in the area should have these aggregated.
- How much new apartment / multifamily construction is in the pipeline within 1–3 miles? Heavy new supply (>2% of stock underway) typically softens rents 12–24 months out; light construction supports rent growth.
Investment metrics
- 1% rule
- 0.78% ✗
- Cap rate
- 4.53%
- Cash-on-cash
- -6.31%
- DSCR
- 0.72
- GRM
- 10.7
CMA / ARV
No comps found within radius.
Projected returns pro-forma
6.44% appreciation · 8.0% rent growth · sell at horizon
- IRR
- 13.3%
- Equity multiple
- 1.94×
- Total profit
- $236,531
- Equity at exit
- $590,348
- IRR
- 15.5%
- Equity multiple
- 4.37×
- Total profit
- $849,217
- Equity at exit
- $1,093,022
Cash invested: $251,720 (down + closing). Projections, not guarantees.
Landlord ↔ Tenant lean methodology
- Overall (CITY)
- 0 Strongly Tenant-Friendly
- State California
- 18 Strongly Tenant-Friendly · D+13
- County
- — inherits STATE
- City San Francisco
- 0 Strongly Tenant-Friendly · D+57
ZIP-level market 94133
- Home prices YoY
- 4.0%
- Rents YoY
- 16.9%
- Active inventory
- 60
- Price-to-rent
- 10.7×
Monthly cashflow live
- Estimated rent
- $7,022 high interval (Pro) →
- Mortgage (P&I)
- −$4,714
- Tax from tax record
- −$1,482 /mo · $17,789/yr
- Insurance
- −$375
- HOA
- −$300
- Vacancy / Maint / Mgmt
- −$1,475
- Net cashflow
- $-1,324
Break-even live
Sensitivity live
| Price | -10% $-815 | -5% $-1,070 | +0% $-1,324 | +5% $-1,579 | +10% $-1,833 |
|---|---|---|---|---|---|
| Rent | -10% $-1,879 | -5% $-1,602 | +0% $-1,324 | +5% $-1,047 | +10% $-769 |
| Rate | -1.0pp $-871 | -0.5pp $-1,096 | base $-1,324 | +0.5pp $-1,557 | +1.0pp $-1,794 |
UW: 25.0% down · 7.5% · 30yr · 1.5% tax · 5.0% vac · 8.0% maint · 8.0% mgmt
Financing live
Cash to close
- Down payment
- $224,750
- Closing costs
- $26,970
- Reserves months
- —
- Total cash needed
- —
Loan-product check · same deal, 3 products live
Conventional
25% down · 7.5% · 30yr
- Down + closing
- —
- Monthly P&I
- —
- Monthly cashflow
- —
- DSCR
- —
- Eligible?
- —
Personal DTI + credit; lowest rate.
DSCR
20% down · 8.5% · 30yr
- Down + closing
- —
- Monthly P&I
- —
- Monthly cashflow
- —
- DSCR
- —
- Eligible?
- —
No personal income docs; deal must DSCR.
Hard money
10% down · 12.0% · 12mo
- Down + closing
- —
- Monthly P&I
- —
- Monthly cashflow
- —
- DSCR
- —
- Eligible?
- —
Short-term bridge; refi at stabilization.
Rent comps 40 comps
| Address | Beds | Baths | Sqft | Rent | $/sqft | DOM | Units | Dist |
|---|---|---|---|---|---|---|---|---|
| 600 Chestnut St #301 San Francisco, CA | 2.0 | 2.0 | 1098 | $5,600 | $5.10 | 44d | 1 | 0.11mi |
| 770 Filbert St Unit 3 San Francisco, CA | 2.0 | 1.0 | 1050 | $5,190 | $4.94 | 44d | 1 | 0.13mi |
| 650 Chestnut St #104 San Francisco, CA | 2.0 | 2.0 | 1080 | $6,500 | $6.02 | 8d | 1 | 0.14mi |
| 33 Vandewater St #103 San Francisco, CA | 2.0 | 2.0 | 950 | $6,900 | $7.26 | 19d | 1 | 0.15mi |
| 1255 Columbus Ave Unit 402 San Francisco, CA | 3.0 | 2.0 | 1505 | $7,250 | $4.82 | 2d | 1 | 0.38mi |
| 1127 Filbert St Apt 3 San Francisco, CA | 3.0 | 2.5 | 1700 | $11,900 | $7.00 | 44d | 1 | 0.39mi |
| 1808 Leavenworth St San Francisco, CA | 3.0 | 1.0 | 1100 | $6,475 | $5.89 | 44d | 1 | 0.44mi |
| 1142 Green St Unit 1146 San Francisco, CA | 2.0 | 1.0 | 1200 | $4,795 | $4.00 | 44d | 1 | 0.45mi |
| 1212 Pacific Ave Unit 3 San Francisco, CA | 3.0 | 2.0 | 1000 | $5,100 | $5.10 | 5d | 1 | 0.52mi |
| 2233 Larkin St San Francisco, CA | 2.0 | 1.0 | 1100 | $6,200 | $5.64 | 3d | 1 | 0.58mi |
| 1305 Lombard St San Francisco, CA | 2.0 | 2.0 | 1050 | $8,995 | $8.57 | 13d | 1 | 0.62mi |
| 990 Bay St San Francisco, CA | 2.0 | 1.0 | 1035 | $5,995 | $5.79 | 25d | 1 | 0.63mi |
| 1472 Filbert St San Francisco, CA | 2.0 | 1.0 | 941 | $7,895 | $8.39 | 12d | 1 | 0.67mi |
| 1310 Jones St San Francisco, CA | 2.0 | 2.0 | 1367 | $10,250 | $7.50 | 4d | 4 | 0.67mi |
| 288 Pacific Ave Unit 2H San Francisco, CA | 2.0 | 2.5 | 1248 | $13,000 | $10.42 | 44d | 1 | 0.71mi |
| 1369 Hyde St San Francisco, CA | 3.0 | 1.0–2.0 | 1435 | $6,695 | $4.67 | 22d | 1 | 0.74mi |
| 875 California St #202 San Francisco, CA | 2.0 | 2.0 | 1474 | $13,000 | $8.82 | 44d | 1 | 0.79mi |
| 1690 Broadway San Francisco, CA | 1.0–2.0 | 1.0 | 761 | $6,995 | $9.19 | 8d | 2 | 0.86mi |
| 460 Davis Ct San Francisco, CA | 3.0 | 1.0–2.5 | 907 | $10,233 | $11.28 | 2d | 17 | 0.87mi |
| 800 Bush St San Francisco, CA | 2.0 | 1.0 | 1020 | $4,650 | $4.56 | 44d | 1 | 0.89mi |
| 1535 Chestnut St Unit 203 San Francisco, CA | 2.0 | 2.0 | 1200 | $6,195 | $5.16 | 44d | 1 | 0.92mi |
| 1024 Bush St San Francisco, CA | 3.0 | 2.5 | 900 | $4,750 | $5.28 | 44d | 1 | 0.93mi |
| 1501-1519 Polk St San Francisco, CA | 2.0 | 1.0 | 1171 | $5,295 | $4.52 | 5d | 2 | 0.97mi |
| 333 Bush St #4006 San Francisco, CA | 2.0 | 2.0 | 1798 | $15,000 | $8.34 | 5d | 1 | 0.97mi |
| 1600 California St San Francisco, CA | 2.0 | 1.0 | 1171 | $5,295 | $4.52 | 5d | 1 | 0.98mi |
| 1735 Van Ness Ave San Francisco, CA | 2.0 | 1.0 | 1064 | $12,225 | $11.49 | 8d | 2 | 0.98mi |
| 333 Bush St San Francisco, CA | 2.0 | 2.0 | 1733 | $11,253 | $6.49 | 25d | 2 | 0.99mi |
| 333 Bush St San Francisco, CA | 2.0 | 2.0 | 1654 | $10,975 | $6.64 | 44d | 2 | 0.99mi |
| 2080 Gough St San Francisco, CA | 2.0 | 2.0 | 1000 | $7,495 | $7.50 | 25d | 1 | 1.05mi |
| 1545 Pine St San Francisco, CA | 2.0 | 2.0 | 1140 | $5,109 | $4.48 | 24d | 1 | 1.07mi |
| 1888 Green St San Francisco, CA | 3.0 | 2.0 | 1455 | $9,875 | $6.79 | 44d | 1 | 1.08mi |
| 2007 Pacific Ave Apt 6 San Francisco, CA | 3.0 | 2.0 | 1131 | $8,000 | $7.07 | 17d | 1 | 1.10mi |
| 3322 Buchanan St San Francisco, CA | 2.0 | 2.0 | 1030 | $7,995 | $7.76 | 4d | 2 | 1.13mi |
| 3322 Buchanan St San Francisco, CA | 2.0 | 2.0 | 1271 | $8,395 | $6.61 | 22d | 1 | 1.13mi |
| 2140 Pacific Ave San Francisco, CA | 2.0 | 2.0 | 1600 | $11,500 | $7.19 | 22d | 1 | 1.19mi |
| 1450 Franklin St #505 San Francisco, CA | 2.0 | 2.0 | 1326 | $7,600 | $5.73 | 11d | 1 | 1.21mi |
| 1285 Sutter St San Francisco, CA | 2.0 | 2.0 | 1122 | $6,868 | $6.12 | 4d | 3 | 1.21mi |
| 1961 California St San Francisco, CA | 3.0 | 2.0 | 1838 | $6,079 | $3.31 | 44d | 1 | 1.22mi |
| 765 Market St Unit 34 San Francisco, CA | 2.0 | 2.5 | 1453 | $9,200 | $6.33 | 44d | 1 | 1.22mi |
| 765 Market St Unit 34E San Francisco, CA | 2.0 | 2.5 | 1453 | $9,000 | $6.19 | 18d | 1 | 1.22mi |
HOA detail condo
- Monthly dues
- $300 · $3,600/yr
- Assessments
- None detected in remarks — confirm with the listing agent.
Listing history 6 events
-
2026-03-30status Pending
-
2026-03-17status Active
-
2026-03-09status Pending
-
2026-02-12$899,000 Active
-
2025-06-12price $1,100,000
-
2025-05-03$1,200,000 Active
ⓘ Source: listings_history table (triggers on properties + properties_extension) + one-shot
backfill from property_details.listing_events for pre-trigger history.
Tax reassessment forecast CA · Resets to sale price
- Current annual tax
- $17,789 · $1,482/mo
- Projected year-2 tax
- $17,789 · $1,482/mo
- Expected delta
- $0/yr ($0/mo · 0.0%)
ⓘ Screening estimate from a state-policy table — verify with the county assessor before closing.
Climate risk First Street
- Flood 1/10 Low FEMA zone X (unshaded) · 0% chance over 30 yrs
- Wildfire 1/10 Low
- Heat 3/10 Moderate 8 d/yr ≥79°F today · 17 d/yr by 30 yrs out
- Wind 1/10 Low
- Air quality 8/10 Severe 15 unhealthy d/yr today · 15 by 30 yrs out
Nearby sold comps map
Loading sold comps map…
Walkable amenities ~0.75 mi
Loading nearby amenities…
Taxation est. · year 1
- Rental income
- $84,262
- − Mortgage interest
- −$50,358
- − Property taxes
- −$17,789
- − Insurance
- −$4,495
- − Repairs & maintenance
- −$6,741
- − Management
- −$6,741
- − HOA
- −$3,600
- − Depreciation
- −$26,153
- Taxable loss
- −$31,614
- Est. tax savings @ 24.0%
- +$7,587
- After-tax cash flow
- $-8,303/yr
For passive investors: Depreciation is non-cash, so a rental often shows a tax loss while cash-flowing — sheltering income. Rental losses are passive: they offset passive income freely, and up to $25,000/yr can offset ordinary (W-2) income if you actively participate and your MAGI is under $100k (phasing out to $0 by $150k); unused losses carry forward. On sale, claimed depreciation is recaptured at up to 25%, and gains may owe capital-gains tax (a 1031 exchange can defer both). Figures are a year-1 estimate at your 24.0% rate — not tax advice; consult a CPA.
Schools (NCES district)
- District
- San Francisco Unified
- NCES district ID
- 0634410
- Math proficiency
- 50% ▬ 0.00%
- Reading proficiency
- 56% ▲ 1.00%
- Median HH income
- $81,249
- Composite
- 50.14/100
- National rank
- #4088
- State rank
- #322 of 1400 in CA
Livability — San Francisco
- Score
- 76/100
- State rank
- #90
- US rank
- #3143
Category grades
Schools grade is shown separately in the Schools card above.
Census & demographics
- Census place
- San Francisco, CA
- County
- San Francisco County · 827,552 people
- City population
- 827,552
- Metro
- San Francisco-Oakland-Berkeley, CA
- Population (ZIP)
- 23,804
- Household income
- $87,191
- Rent vs Own
- Severe rent burden
- 2027.0
Population outlook (San Francisco County) Hauer SSP2
- Today (2025)
- 1,030,936 people
- By 2030
- 1,110,409 · +7.7%
- By 2040
- 1,270,010 · +23.2%
- By 2050
- 1,435,001 · +39.2%
- By 2075
- 1,779,074 · +72.6%
- By 2100
- 1,966,767 · +90.8%
Race, ethnicity, and origin ACS 2023
- Neighborhood character
- Diverse neighborhood (Simpson 0.65)
- Race & ethnicity
- Asian 48% White 34% Hispanic / Latino 11% Two or more races 9% Black 3%
- Hispanic origin (detail)
- Mexican 5%
- Common ancestry
- Romanian 3% Slovak 2% Lithuanian 2%
- Foreign-born
- 40% · China, Canada, South Korea
- Languages at home
- 53% English-only · Chinese 34% Spanish 5% Other Indo-European 3%
Political lean MEDSL · San Francisco
- 2024 margin
- Solid D (+64.8) · D 80.3% · R 15.5% · Other 4.1%
- 2008→2024 swing
- -5.7pp toward R · 2008: 70.5pp · 2024: 64.8pp
- All cycles
- 2024: D+64.8 2020: D+72.5 2016: D+76.1 2012: D+70.2 2008: D+70.5
Not yet ingested
- Civics
- —
Market trends
- HPI YoY
- ▲ 6.44%
- Current HPI
- 168.565
- Rent YoY
- ▲ 16.95%
- Metro
- San Francisco-Oakland-Berkeley, CA
- State GDP YoY
- ▲ 3.21%
- F500 in state
- 116
Industry mix (Fortune 500 HQ in CA)
| Industry | F500 HQs | Revenue |
|---|---|---|
| Technology | 27 | $1,492B |
|
||
| Financial Services | 3 | $174B |
|
||
| Retail | 3 | $44B |
|
||
| Insurance | 3 | $26B |
|
||
| Media / Entertainment | 2 | $115B |
|
||
| Pharmaceuticals / Biotech | 2 | $62B |
|
||
Price history
-25.1% since first listed6 events — show timeline
- 2026-03-30 Pending — San Francisco MLS
- 2026-03-17 Relisted — San Francisco MLS
- 2026-03-09 Pending — San Francisco MLS
- 2026-02-12 Listed $899,000 San Francisco MLS
- 2025-06-12 Price Changed $1,100,000 San Francisco MLS
- 2025-05-03 Listed $1,200,000 San Francisco MLS
Property tax history
+24.2%/yrLatest (2025): $17,789 · +3.0% YoY. Source: county tax records.
Cash-flow waterfall
monthlySold comps — $/sqft
last 12 mo · ≤1 miLoading sold comps…