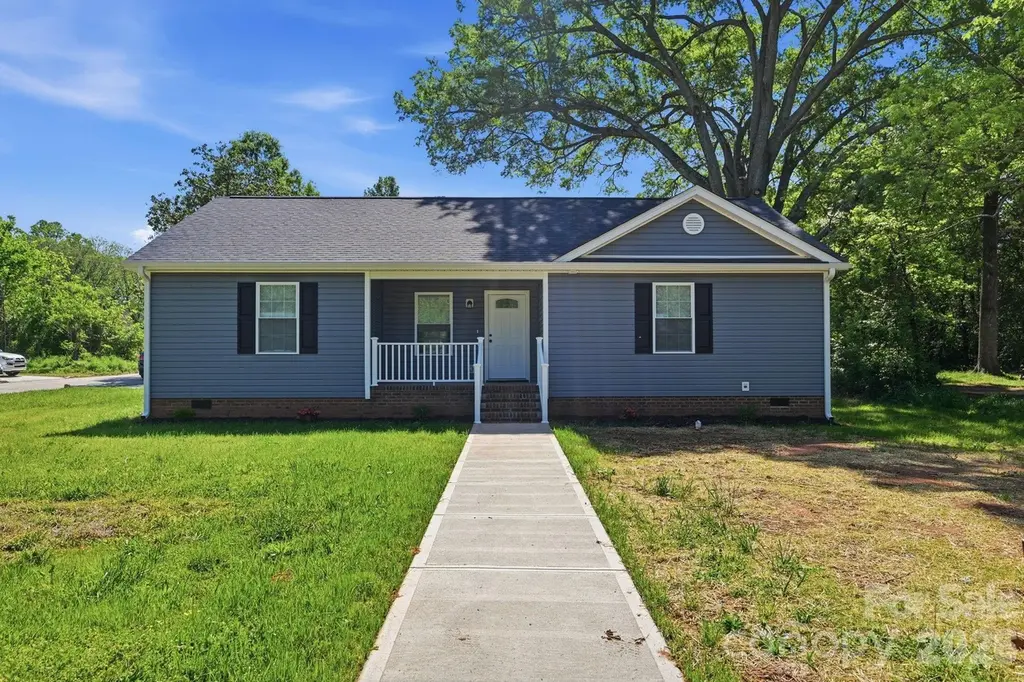
63 Pinckney St · York, SC
Flood risk No data
- FEMA flood zone
- —
- Chance of flooding over 30 yrs
- —
- Est. flood insurance / yr
- —
Fire risk No data
- Est. fire insurance / yr
- —
Heat risk No data
- Hot days now (above threshold)
- —
- Hot days in 30 yrs
- —
Wind risk No data
- Chance of severe wind over 30 yrs
- —
Air-quality risk No data
- Unhealthy air days now
- —
- Unhealthy air days in 30 yrs
- —
Risk factors via First Street. Map © Google.
Why this score? — see what drove the D+ grade
The composite is a weighted blend of 9 inputs, each scored 0–100. Each bar is that input's sub-score; the figure is the points it added to the 100-point composite (weight × sub-score).
- ARV discount +13.8/15.0
- Cash flow +12.4/30.0
- Condition / age +4.0/5.0
- DSCR +3.7/10.0
- 1% rule +3.5/10.0
- Livability +3.2/5.0
- Schools +3.0/10.0
- Rent growth +2.5/5.0
- Appreciation +0.0/10.0
$279,500
🖨 Deal sheet 📄 Offer letter ✓ Due diligence
Listing remarks
Discover comfort, space, and value in this brand-new 1,364 sqft home located in a quiet area of York. With modern construction, an open floor plan, and a generous lot, this property is a great opportunity for first-time buyers or investors seeking a low-maintenance, move-in ready home. Inside, the open layout creates a seamless flow between the living, dining, and kitchen areas, making it ideal for everyday living and entertaining. The home features durable vinyl siding for easy upkeep and long-term value. Step outside to a spacious back deck overlooking a large backyard, perfect for relaxing, hosting, or enjoying outdoor activities. Situated on a double-sized lot of just over a third of an
Key facts
- Spacious back deck
- Open floor plan
- Double-sized lot
Tags
Property features AI
Finance
- HOA & community: No HOA
Exterior
- Parking: Driveway (no main-level garage)
- Utilities: City water; Public sewer
- Home design: Single family residence; Residential property; One story; Site built; New construction; Zoned R-7; Facing elevation 1000
- Construction: Vinyl exterior; Crawl space foundation
- Exterior features: Deck; Concrete and paved roads; Publicly maintained road
Interior
- Kitchen: Dishwasher; Electric oven; Electric range; Microwave; Refrigerator
- Bedrooms: 3 bedrooms on the main level
- Bathrooms: 2 full bathrooms on the main level
- Heating & cooling: Heat pump heating; Electric cooling
- Interior features: 7 total rooms; Under construction / Proposed completion May 7, 2026
- Laundry & utility: Laundry closet
Neighborhood map
What this means for you Summary
Snapshot
- This is a 3-bed/2.0-bath single-family listed at $280k. Condition is rated good.
Deal economics
- At list price, monthly cash flow is $-44 ($-530/yr) — negative.
- To cash-flow at today's rent, offer at most $273k (2.3% below list).
- To meet the 1% rule (rent ≥ 1% of price), the offer needs to be $239k (14.5% below list).
- Recommended offer: $239k (14.5% below list) — sets the bar for 1% rule.
- Cap rate 6.1% vs local median 4.6% in York — top-decile yield for the area; either an underpriced asset or a hidden risk that comps aren't pricing in. Stress-test before assuming the spread holds.
Location & tenants
- Location reads 65/100 on livability (#139 in SC) — a middle-class / working-renter tenant base. Strengths: cost of living A+, housing A+, health & safety A+; Watch: crime F, amenities F, commute F.
- York 01 (rural): math 31% / reading 40% proficiency, ranked #41 of 80 in SC (top 51%) — families likely to look elsewhere, expect single-tenant / working-renter base with shorter leases.
- Zoned schools: Jefferson Elementary (math 37% / reading 37%, grade F, #315 of 597 statewide, top 55%, 418 students, 100% FRL); York Comprehensive High (math 39% / reading 82%, grade C+, #108 of 196 statewide, top 55%, 1,493 students, 68% FRL) — zoned schools average 84% FRL vs 54% district-wide (31 pts higher); higher-poverty schools than district average — tighter screening recommended.
- Zoned-school proficiency averages 49% at this address vs 36% district-wide (+13 pts) — the actual schools serving this property are materially stronger than the York 01 average implies; a family-tenant draw the district grade alone would hide.
- Market conditions: 541 active listings in the ZIP; 2 comparable units currently listed for rent nearby; solid renter incomes; 2,550 units permitted in York County in 2024 (350 in 5+ unit buildings).
- This rent runs 36% of the median local income ($79k/yr) — at the standard rent-burdened threshold; future hikes will face affordability resistance.
Forward outlook
- Local home prices are declining (-3.0%/yr); year-one equity from $2k of loan paydown is wiped out by about $8k of value loss. Plan a longer hold.
- York County population projected at +44% by 2050 — long-run rental-demand tailwind backs the buy-and-hold thesis.
Negotiation context
- It's been on market 19 days — a 2% lower offer ($275k) is reasonable based on typical stale-listing flexibility.
Questions for the listing agent
- What do current leases actually rent for vs. the listed asking? Can we see a recent rent roll and the last 12 months of T-12 income?
- Is there a deadline driving the sale (1031 exchange, divorce, estate, relocation)? That informs how much negotiation room exists.
- Schools are D-rated, which usually means shorter tenancies and higher turnover. Who's the typical renter profile here, and what's been the actual vacancy rate?
- Crime grade is F in this area — have there been break-ins, vandalism, or insurance claims at this property in the last 3 years? What carrier currently insures it and at what premium?
- The area grade is low — what's the realistic commute time and amenity access for the typical tenant pool here? Any planned neighborhood developments (good or bad) we should know about?
- What's the average days-on-market for RENTAL listings here right now (not sales)? A rising rental-DOM trend means longer vacancies and softer asking-rent achievability than the comps imply.
- What's the recent tenant-quality profile in this submarket — average credit score on applications, eviction rate, late-payment / NSF rate, and stable-employment percentage? A property-management company in the area should have these aggregated.
- How much new for-sale + rental construction is in the pipeline within 1–3 miles? Heavy new supply typically softens prices + rents 12–24 months out; constrained supply supports both.
Investment metrics
- 1% rule
- 0.85% ✗
- Cap rate
- 6.10%
- Cash-on-cash
- -0.68%
- DSCR
- 0.97
- GRM
- 9.7
CMA / ARV
- ARV (on-the-fly)
- $324,632
- Comps found
- 12
Show comp detail 12 sales within ~0.75 mi
| Address | Dist | Beds/Ba | Sqft | Sold | Price | $/sf | Match |
|---|---|---|---|---|---|---|---|
| 63 Pinckney St | 0.00mi | 3/2.0 | 1,364 (0%) | 0mo | $279,500 | $205 | 100 |
| 326 Sharon Rd | 0.40mi | 3/2.0 | 1,333 (-2%) | 1mo | $329,900 | $247 | 77 |
| 433 Merry Go Dr | 0.21mi | 3/2.0 | 1,265 (-7%) | 8mo | $255,500 | $202 | 72 |
| 308 New St | 0.55mi | 3/2.0 | 1,242 (-9%) | 1mo | $294,900 | $237 | 59 |
| 27 Maiden Ln | 0.53mi | 3/2.0 | 1,242 (-9%) | 3mo | $295,000 | $238 | 58 |
| 280 Old Pinckney Rd | 0.69mi | 3/2.0 | 1,326 (-3%) | 6mo | $319,000 | $241 | 58 |
| 246 Old Pinckney Rd | 0.64mi | 3/2.0 | 1,287 (-6%) | 7mo | $336,500 | $261 | 55 |
| 254 Old Pinckney Rd | 0.64mi | 3/2.0 | 1,276 (-6%) | 6mo | $309,900 | $243 | 54 |
| 29 Wainwright Ave | 0.67mi | 3/2.0 | 1,248 (-8%) | 9mo | $285,000 | $228 | 47 |
| 31 Southbrook Dr | 0.71mi | 3/2.0 | 1,219 (-11%) | 4mo | $273,900 | $225 | 46 |
| 240 Old Pinckney Rd | 0.63mi | 3/2.0 | 1,526 (+12%) | 7mo | $370,000 | $242 | 45 |
| 217 Wiley Ave | 0.64mi | 2/1.0 (-1) | 1,204 (-12%) | 8mo | $230,000 | $191 | 35 |
Match score weights: distance 35% · size 25% · config 20% · recency 20%. Top-matched comps best support the ARV.
Projected returns pro-forma
-3.0% appreciation · 3.0% rent growth · sell at horizon
- IRR
- -17.4%
- Equity multiple
- 0.39×
- Total profit
- $-48,070
- Equity at exit
- $41,674
- IRR
- -9.4%
- Equity multiple
- 0.42×
- Total profit
- $-45,338
- Equity at exit
- $24,166
Cash invested: $78,260 (down + closing). Projections, not guarantees.
Landlord ↔ Tenant lean methodology
- Overall (STATE)
- 90 Strongly Landlord-Friendly
- State South Carolina
- 90 Strongly Landlord-Friendly · R+6
- County
- — inherits STATE
- City
- — inherits STATE
ZIP-level market 29745
- Home prices YoY
- -30.3%
- Active inventory
- 541
- Price-to-rent
- 9.7×
Monthly cashflow live
- Estimated rent
- $2,389 medium interval (Pro) →
- Mortgage (P&I)
- −$1,466
- Tax est. 1.5%
- −$349 /mo · $4,192/yr
- Insurance
- −$116
- HOA
- −$0
- Vacancy / Maint / Mgmt
- −$502
- Net cashflow
- $-44
Break-even live
UW: 25.0% down · 7.5% · 30yr · 1.5% tax · 5.0% vac · 8.0% maint · 8.0% mgmt
Financing live
Cash to close
- Down payment
- $69,875
- Closing costs
- $8,385
- Reserves months
- —
- Total cash needed
- —
Loan-product check · same deal, 3 products live
Conventional
25% down · 7.5% · 30yr
- Down + closing
- —
- Monthly P&I
- —
- Monthly cashflow
- —
- DSCR
- —
- Eligible?
- —
Personal DTI + credit; lowest rate.
DSCR
20% down · 8.5% · 30yr
- Down + closing
- —
- Monthly P&I
- —
- Monthly cashflow
- —
- DSCR
- —
- Eligible?
- —
No personal income docs; deal must DSCR.
Hard money
10% down · 12.0% · 12mo
- Down + closing
- —
- Monthly P&I
- —
- Monthly cashflow
- —
- DSCR
- —
- Eligible?
- —
Short-term bridge; refi at stabilization.
Rent comps 2 comps
| Address | Beds | Baths | Sqft | Rent | $/sqft | DOM | Units | Dist |
|---|---|---|---|---|---|---|---|---|
| 53 Travora Cir York, SC | 3.0 | 2.0 | 1156 | $1,995 | $1.73 | 17d | 1 | 0.52mi |
| 106 Eaves Way York, SC | 2.0–3.0 | 1.5–2.0 | 1161 | $1,708 | $1.47 | 1d | 1 | 0.83mi |
Listing history 2 events
-
2026-05-05status Pending
-
2026-04-16$279,500 Active
ⓘ Source: listings_history table (triggers on properties + properties_extension) + one-shot
backfill from property_details.listing_events for pre-trigger history.
Nearby sold comps map
Loading sold comps map…
Walkable amenities ~0.75 mi
Loading nearby amenities…
Taxation est. · year 1
- Rental income
- $28,669
- − Mortgage interest
- −$15,656
- − Property taxes
- −$4,192
- − Insurance
- −$1,398
- − Repairs & maintenance
- −$2,293
- − Management
- −$2,293
- − Depreciation
- −$8,131
- Taxable loss
- −$5,296
- Est. tax savings @ 24.0%
- +$1,271
- After-tax cash flow
- $740/yr
For passive investors: Depreciation is non-cash, so a rental often shows a tax loss while cash-flowing — sheltering income. Rental losses are passive: they offset passive income freely, and up to $25,000/yr can offset ordinary (W-2) income if you actively participate and your MAGI is under $100k (phasing out to $0 by $150k); unused losses carry forward. On sale, claimed depreciation is recaptured at up to 25%, and gains may owe capital-gains tax (a 1031 exchange can defer both). Figures are a year-1 estimate at your 24.0% rate — not tax advice; consult a CPA.
Condition & rehab AI · 12 photos
This move-in ready home offers a modern, open floor plan and a spacious backyard, making it an excellent opportunity for first-time buyers or investors seeking a low-maintenance property.
Value-add opportunities
- Resale Paint exterior siding — Fresh paint can enhance curb appeal and property value
- Both Replace ceiling fans with energy-efficient models — Energy-efficient fans can save on energy costs and improve comfort
- Both Install smart home devices — Smart home devices can increase property value and attract tech-savvy buyers
Renovation cost estimate screening
Value-add ROI direction
- Resale Paint exterior siding — Fresh paint can enhance curb appeal and property value ↑
- Both Replace ceiling fans with energy-efficient models — Energy-efficient fans can save on energy costs and improve comfort ↑
- Both Install smart home devices — Smart home devices can increase property value and attract tech-savvy buyers ↑
ⓘ Cost ranges are severity-bucket heuristics (US national rule-of-thumb). Get contractor quotes + a written scope before underwriting a rehab budget.
Schools (NCES district)
- District
- York 01
- NCES district ID
- 4503810
- Math proficiency
- 31% ▼ -16.00%
- Reading proficiency
- 40% ▬ 0.00%
- Median HH income
- $44,491
- Composite
- 30.21/100
- National rank
- #6305
- State rank
- #41 of 80 in SC
Livability — York
- Score
- 65/100
- State rank
- #139
- US rank
- #13425
Category grades
Schools grade is shown separately in the Schools card above.
Census & demographics
- Census place
- York, SC
- County
- York County · 281,758 people
- City population
- 34,909
- Metro
- Charlotte-Concord-Gastonia, NC-SC
- Population (ZIP)
- 34,909
- Household income
- $79,117
- Rent vs Own
- Severe rent burden
- 321.0
Population outlook (York County) Hauer SSP2
- Today (2025)
- 307,757 people
- By 2030
- 335,979 · +9.2%
- By 2040
- 391,378 · +27.2%
- By 2050
- 443,234 · +44.0%
- By 2075
- 557,102 · +81.0%
- By 2100
- 625,837 · +103.4%
Race, ethnicity, and origin ACS 2023
- Neighborhood character
- Predominantly White (75%)
- Race & ethnicity
- White 75% Black 12% Two or more races 6% Hispanic / Latino 6% Asian 1%
- Hispanic origin (detail)
- Mexican 4%
- Common ancestry
- Romanian 3% Serbian 3% Italian 2%
- Foreign-born
- 4% · Canada
- Languages at home
- 94% English-only · Spanish 4%
Political lean MEDSL · York
- 2024 margin
- R (+19.1) · D 39.7% · R 58.8% · Other 1.5%
- 2008→2024 swing
- -1.4pp toward R · 2008: -17.7pp · 2024: -19.1pp
- All cycles
- 2024: R+19.1 2020: R+16.5 2016: R+22.1 2012: R+20.5 2008: R+17.7
Not yet ingested
- Civics
- —
Market trends
- HPI YoY
- ▼ -109.42%
- Current HPI
- 251.6848
- Rent YoY
- —
- Metro
- Charlotte-Concord-Gastonia, NC-SC
- State GDP YoY
- ▲ 4.51%
- F500 in state
- 2
Industry mix (Fortune 500 HQ in SC)
| Industry | F500 HQs | Revenue |
|---|---|---|
| Packaging | 1 | $7B |
|
||
Price history
2 events — show timeline
- 2026-05-05 Pending — CANOPYMLS as Distributed by MLS Grid
- 2026-04-16 Listed $279,500 CANOPYMLS as Distributed by MLS Grid
Cash-flow waterfall
monthlySold comps — $/sqft
last 12 mo · ≤1 miLoading sold comps…