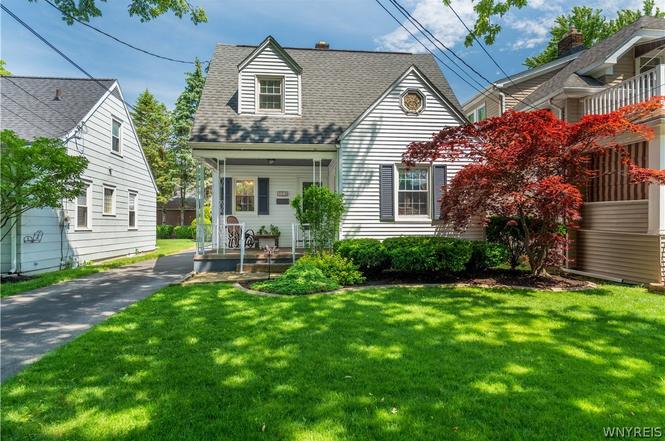
564 Locust St · North Tonawanda, NY
Flood risk 6/10 · Moderate
- FEMA flood zone
- X (unshaded)
- Chance of flooding over 30 yrs
- 0.73%
- Est. flood insurance / yr
- $473 – $860
Fire risk 1/10 · Minimal
- Est. fire insurance / yr
- $691 – $1,283
Heat risk 2/10 · Minimal
- Hot days now (above 94°F)
- 7 days/yr
- Hot days in 30 yrs
- 15 days/yr
Wind risk 1/10 · Minimal
- Chance of severe wind over 30 yrs
- —
Air-quality risk 3/10 · Minor
- Unhealthy air days now
- 3 days/yr
- Unhealthy air days in 30 yrs
- 4 days/yr
Risk factors via First Street. Map © Google.
Why this score? — see what drove the C- grade
The composite is a weighted blend of 9 inputs, each scored 0–100. Each bar is that input's sub-score; the figure is the points it added to the 100-point composite (weight × sub-score).
- ARV discount +15.0/15.0
- Cash flow +12.6/30.0
- Schools +4.2/10.0
- Livability +4.2/5.0
- Rent growth +4.0/5.0
- DSCR +3.8/10.0
- 1% rule +3.7/10.0
- Condition / age +2.5/5.0
- Appreciation +0.0/10.0
$165,000
🖨 Deal sheet (PDF) 📄 Offer letter ✓ Due diligence
Listing remarks MLS
Beautifully maintained, refinished hardwood floors, 2007 windows, glass block in basement, charming garden yard
Key facts
- Tree lined street
- Full basement
- Delightful backyard
Tags
Property features AI
Exterior
- Parking: Detached garage; Approximately 1.5 garage spaces
- Utilities: Electricity connected; Public water connected; Sewer connected; Cable available
- Home design: Single-story building (per public record); Resale property; City street frontage
- Construction: Aluminum and vinyl siding; Copper plumbing; Asphalt roof; Poured foundation; Existing construction
- Exterior features: Blacktop driveway; Partial fence; Porch (open); Fenced yard
Interior
- Kitchen: Gas range; Gas oven; Refrigerator; Eat-in kitchen; Appliances negotiable
- Bedrooms: Bedroom 1 on second level (16.0 x 10.0); Bedroom 2 on second level (15.0 x 13.0)
- Flooring: Hardwood; Varies
- Bathrooms: 1 full bathroom
- Heating & cooling: Gas forced-air heating; Central air conditioning
- Interior features: Thermal windows; Separate/formal living room; Separate/formal dining room; Eat-in kitchen
- Laundry & utility: Washer; Dryer; Gas water heater
Neighborhood map
What this means for you Summary
Snapshot
- This is a 2-bed/1.0-bath single-family listed at $165k.
Deal economics
- At list price, monthly cash flow is $-20 ($-243/yr) — negative.
- To cash-flow at today's rent, offer at most $161k (2.2% below list).
- To meet the 1% rule (rent ≥ 1% of price), the offer needs to be $144k (12.7% below list).
- Recommended offer: $144k (12.7% below list) — sets the bar for 1% rule.
- Cap rate 6.1% vs local median 4.0% in North Tonawanda — top-decile yield for the area; either an underpriced asset or a hidden risk that comps aren't pricing in. Stress-test before assuming the spread holds.
Location & tenants
- Location reads 85/100 on livability (#30 in NY, #518 nationally) — a professional / high-income tenant draw. Strengths: commute A+, housing A+, health & safety A+.
- North Tonawanda City School District (suburban): math 42% / reading 57% proficiency, ranked #398 of 590 in NY (top 68%) — families likely to look elsewhere, expect single-tenant / working-renter base with shorter leases.
- Zoned schools: Spruce School (math 34% / reading 54%, grade F, #1,277 of 2,108 statewide, top 64%, 313 students, 68% FRL); North Tonawanda Middle School (math 27% / reading 52%, grade F, #418 of 729 statewide, top 59%, 447 students, 50% FRL); North Tonawanda High School (math 93% / reading 64%, grade A-, #562 of 1,100 statewide, top 51%, 1,001 students, 46% FRL) — zoned schools average 55% FRL vs 34% district-wide (20 pts higher); higher-poverty schools than district average — tighter screening recommended.
- Market conditions: Rents rising fast (+6.0%/yr); 180 active listings in the ZIP; 12 comparable units currently listed for rent nearby; rentals leasing fast (median 13d on market — plan ~1-2 weeks tenant-placement turnaround); 167 units permitted in Niagara County in 2024 (0 in 5+ unit buildings).
Forward outlook
- Local home prices are declining (-3.0%/yr); year-one equity from $1k of loan paydown is wiped out by about $5k of value loss. Plan a longer hold.
- Niagara County population projected at -19% by 2050 — secular population decline; favor cash flow + early exit over multi-decade hold.
Negotiation context
- Only 6 days on market — expect competitive offers; lowballing is unlikely to land.
- 2 sale attempts since 17y ago with the ask held roughly flat each time — persistent listings suggest the price (not the market) is what's stuck; bring a comps-based counter.
- Current owner paid $78k; list at $165k implies a 112% gain — meaningful room to come down on a strong offer.
Risks & watch-outs
- Watch-outs: built in 1941 — expect roof / HVAC / electrical / plumbing capex.
- Climate carrying-cost: major flood risk — expect insurance premiums to compound above CPI over the hold.
Questions for the listing agent
- What do current leases actually rent for vs. the listed asking? Can we see a recent rent roll and the last 12 months of T-12 income?
- Built in 1941 — when were the roof, HVAC, electrical panel, plumbing, and water heater last replaced?
- Is there a deadline driving the sale (1031 exchange, divorce, estate, relocation)? That informs how much negotiation room exists.
- Schools are B-rated — typically a magnet for longer-tenancy family renters. What's the average tenant stay here, and is there a school-zone premium baked into asking?
- What's the average days-on-market for RENTAL listings here right now (not sales)? A rising rental-DOM trend means longer vacancies and softer asking-rent achievability than the comps imply.
- What's the recent tenant-quality profile in this submarket — average credit score on applications, eviction rate, late-payment / NSF rate, and stable-employment percentage? A property-management company in the area should have these aggregated.
- How much new for-sale + rental construction is in the pipeline within 1–3 miles? Heavy new supply typically softens prices + rents 12–24 months out; constrained supply supports both.
Investment metrics
- 1% rule
- 0.87% ✗
- Cap rate
- 6.15%
- Cash-on-cash
- -0.53%
- DSCR
- 0.98
- GRM
- 9.6
CMA / ARV
- ARV (on-the-fly)
- $208,848
- Comps found
- 12
Show comp detail 12 sales within ~0.75 mi
| Address | Dist | Beds/Ba | Sqft | Sold | Price | $/sf | Match |
|---|---|---|---|---|---|---|---|
| 525 E Thompson St | 0.07mi | 2/1.0 | 888 (-3%) | 19mo | $220,000 | $248 | 76 |
| 120 Rumbold Ave | 0.19mi | 3/1.0 (+1) | 998 (+9%) | 13mo | $230,000 | $230 | 60 |
| 169 Rumbold Ave | 0.23mi | 2/1.0 | 780 (-14%) | 9mo | $142,500 | $183 | 58 |
| 31 Cramer St | 0.37mi | 2/1.0 | 994 (+9%) | 14mo | $182,000 | $183 | 56 |
| 447 Robinson St | 0.35mi | 3/1.0 (+1) | 960 (+5%) | 19mo | $165,000 | $172 | 54 |
| 226 Schenck St | 0.68mi | 2/1.5 | 930 (+2%) | 14mo | $150,000 | $161 | 52 |
| 354 Falconer St | 0.48mi | 2/1.0 | 816 (-10%) | 11mo | $162,500 | $199 | 51 |
| 271 Roncroff Dr | 0.58mi | 2/1.0 | 840 (-8%) | 12mo | $192,000 | $229 | 50 |
| 283 Roncroff Dr | 0.57mi | 2/1.0 | 840 (-8%) | 15mo | $202,000 | $240 | 48 |
| 355 Bryant St | 0.53mi | 3/1.0 (+1) | 1,003 (+10%) | 10mo | $191,400 | $191 | 45 |
| 57 Donald Dr | 0.72mi | 3/1.0 (+1) | 1,014 (+11%) | 8mo | $252,500 | $249 | 36 |
| 78 Donald Dr | 0.74mi | 3/1.0 (+1) | 1,014 (+11%) | 12mo | $235,000 | $232 | 32 |
Match score weights: distance 35% · size 25% · config 20% · recency 20%. Top-matched comps best support the ARV.
Projected returns pro-forma
-3.0% appreciation · 5.96% rent growth · sell at horizon
- IRR
- -13.8%
- Equity multiple
- 0.49×
- Total profit
- $-23,580
- Equity at exit
- $24,602
- IRR
- -0.8%
- Equity multiple
- 0.94×
- Total profit
- $-2,812
- Equity at exit
- $14,266
Cash invested: $46,200 (down + closing). Projections, not guarantees.
Landlord ↔ Tenant lean methodology
- Overall (STATE)
- 15 Strongly Tenant-Friendly
- State New York
- 15 Strongly Tenant-Friendly · D+10
- County
- — inherits STATE
- City
- — inherits STATE
ZIP-level market 14120
- Rents YoY
- 6.0%
- Active inventory
- 180
- Price-to-rent
- 9.6×
Monthly cashflow live
- Estimated rent
- $1,440 high interval (Pro) →
- Mortgage (P&I)
- −$865
- Tax from tax record
- −$224 /mo · $2,683/yr
- Insurance
- −$69
- HOA
- −$0
- Vacancy / Maint / Mgmt
- −$302
- Net cashflow
- $-20
Break-even live
Sensitivity live
| Price | -10% $73 | -5% $26 | +0% $-20 | +5% $-67 | +10% $-114 |
|---|---|---|---|---|---|
| Rent | -10% $-134 | -5% $-77 | +0% $-20 | +5% $37 | +10% $93 |
| Rate | -1.0pp $63 | -0.5pp $22 | base $-20 | +0.5pp $-63 | +1.0pp $-107 |
UW: 25.0% down · 7.5% · 30yr · 1.5% tax · 5.0% vac · 8.0% maint · 8.0% mgmt
Financing live
Cash to close
- Down payment
- $41,250
- Closing costs
- $4,950
- Reserves months
- —
- Total cash needed
- —
Loan-product check · same deal, 3 products live
Conventional
25% down · 7.5% · 30yr
- Down + closing
- —
- Monthly P&I
- —
- Monthly cashflow
- —
- DSCR
- —
- Eligible?
- —
Personal DTI + credit; lowest rate.
DSCR
20% down · 8.5% · 30yr
- Down + closing
- —
- Monthly P&I
- —
- Monthly cashflow
- —
- DSCR
- —
- Eligible?
- —
No personal income docs; deal must DSCR.
Hard money
10% down · 12.0% · 12mo
- Down + closing
- —
- Monthly P&I
- —
- Monthly cashflow
- —
- DSCR
- —
- Eligible?
- —
Short-term bridge; refi at stabilization.
Rent comps 12 comps
| Address | Beds | Baths | Sqft | Rent | $/sqft | DOM | Units | Dist |
|---|---|---|---|---|---|---|---|---|
| 166 Spruce St Unit 5 North Tonawanda, NY | 2.0 | 1.0 | 1000 | $1,300 | $1.30 | 25d | 1 | 0.34mi |
| 399 Miller St North Tonawanda, NY | 2.0 | 1.0 | 750 | $1,250 | $1.67 | 25d | 1 | 0.59mi |
| 900 E Robinson St North Tonawanda, NY | 2.0 | 1.0 | 900 | $1,350 | $1.50 | 0d | 1 | 0.61mi |
| 705 Sandra Ln North Tonawanda, NY | 1.0–2.0 | 1.0 | 725 | $1,895 | $2.61 | 0d | 14 | 0.63mi |
| 330 E Niagara St Tonawanda, NY | 2.0 | 2.0 | 1075 | $1,775 | $1.65 | 0d | 1 | 0.71mi |
| 125 3rd Ave North Tonawanda, NY | 2.0 | 1.0 | 900 | $1,100 | $1.22 | 45d | 1 | 1.06mi |
| 317 Hedwig Dr Unit N North Tonawanda, NY | 3.0 | 1.0 | 864 | $1,350 | $1.56 | 12d | 1 | 1.18mi |
| 109 6th Ave Unit 1 North Tonawanda, NY | 1.0 | 1.0 | 620 | $1,100 | $1.77 | 0d | 1 | 1.20mi |
| 103 Raintree Is Tonawanda, NY | 1.0–2.0 | 1.0 | 700 | $1,800 | $2.57 | 0d | 26 | 1.31mi |
| 600 River Rd North Tonawanda, NY | 1.0–3.0 | 1.0–2.5 | 1320 | $3,470 | $2.63 | 0d | 12 | 1.37mi |
| 5 7th Ave North Tonawanda, NY | 1.0 | 1.0 | 600 | $1,050 | $1.75 | 25d | 1 | 1.37mi |
| 175 12th Ave North Tonawanda, NY | 3.0 | 1.0 | 1000 | $1,600 | $1.60 | 45d | 1 | 1.42mi |
Listing history 5 events
-
2026-06-21days on market $165,000 Active 6 DOM
-
2026-06-18days on market $165,000 Active 3 DOM
-
2026-06-17days on market $165,000 Active 2 DOM
-
2026-06-15remarks 699-char remark
-
2026-06-15$165,000 Active 1 DOM
ⓘ Source: listings_history table (triggers on properties + properties_extension) + one-shot
backfill from property_details.listing_events for pre-trigger history.
Tax reassessment forecast NY · Partial reset (capped growth)
- Current annual tax
- $2,683 · $224/mo
- Projected year-2 tax
- $2,736 · $228/mo
- Expected delta
- +$53/yr (+$4/mo · 2.0%)
ⓘ Screening estimate from a state-policy table — verify with the county assessor before closing.
Climate risk First Street
- Flood 6/10 Major FEMA zone X (unshaded) · 73% chance over 30 yrs
- Wildfire 1/10 Low
- Heat 2/10 Low 7 d/yr ≥94°F today · 15 d/yr by 30 yrs out
- Wind 1/10 Low
- Air quality 3/10 Moderate 3 unhealthy d/yr today · 4 by 30 yrs out
Nearby sold comps map
Loading sold comps map…
Walkable amenities ~0.75 mi
Loading nearby amenities…
Taxation est. · year 1
- Rental income
- $17,276
- − Mortgage interest
- −$9,243
- − Property taxes
- −$2,683
- − Insurance
- −$825
- − Repairs & maintenance
- −$1,382
- − Management
- −$1,382
- − Depreciation
- −$4,800
- Taxable loss
- −$3,038
- Est. tax savings @ 24.0%
- +$729
- After-tax cash flow
- $486/yr
For passive investors: Depreciation is non-cash, so a rental often shows a tax loss while cash-flowing — sheltering income. Rental losses are passive: they offset passive income freely, and up to $25,000/yr can offset ordinary (W-2) income if you actively participate and your MAGI is under $100k (phasing out to $0 by $150k); unused losses carry forward. On sale, claimed depreciation is recaptured at up to 25%, and gains may owe capital-gains tax (a 1031 exchange can defer both). Figures are a year-1 estimate at your 24.0% rate — not tax advice; consult a CPA.
Schools (NCES district)
- District
- North Tonawanda City School District
- NCES district ID
- 3621240
- Math proficiency
- 42% ▼ -16.00%
- Reading proficiency
- 57% ▲ 4.00%
- Median HH income
- $48,348
- Composite
- 42.15/100
- National rank
- #3301
- State rank
- #398 of 590 in NY
Livability — North Tonawanda
- Score
- 85/100
- State rank
- #30
- US rank
- #518
Category grades
Schools grade is shown separately in the Schools card above.
Census & demographics
- Census place
- North Tonawanda, NY
- County
- Niagara County · 157,377 people
- City population
- 44,241
- Metro
- Buffalo-Cheektowaga, NY
- Population (ZIP)
- 44,241
- Household income
- $74,871
- Rent vs Own
- Severe rent burden
- 1303.0
Population outlook (Niagara County) Hauer SSP2
- Today (2025)
- 204,149 people
- By 2030
- 197,900 · -3.1%
- By 2040
- 182,239 · -10.7%
- By 2050
- 165,198 · -19.1%
- By 2075
- 129,416 · -36.6%
- By 2100
- 96,222 · -52.9%
Race, ethnicity, and origin ACS 2023
- Neighborhood character
- Predominantly White (91%)
- Race & ethnicity
- White 91% Two or more races 4% Hispanic / Latino 3% Black 2%
- Common ancestry
- Romanian 15% Lithuanian 2% Slovak 2%
- Foreign-born
- 4% · Canada, China
- Languages at home
- 95% English-only · Russian/Polish/Slavic 2% Spanish 1% Other Indo-European 1%
Political lean MEDSL · Niagara
- 2024 margin
- R (+14.9) · D 42.5% · R 57.5%
- 2008→2024 swing
- -15.9pp toward R · 2008: 1.0pp · 2024: -14.9pp
- All cycles
- 2024: R+14.9 2020: R+9.7 2016: R+19.0 2012: D+0.6 2008: D+1.0
Not yet ingested
- Civics
- —
Market trends
- HPI YoY
- ▼ -260.39%
- Current HPI
- 303.1744
- Rent YoY
- ▲ 5.96%
- Metro
- Buffalo-Cheektowaga, NY
- State GDP YoY
- ▲ 2.60%
- F500 in state
- 92
Industry mix (Fortune 500 HQ in NY)
| Industry | F500 HQs | Revenue |
|---|---|---|
| Financial Services | 10 | $950B |
|
||
| Consumer Goods | 9 | $162B |
|
||
| Insurance | 4 | $225B |
|
||
| Telecommunications | 2 | $144B |
|
||
| Pharmaceuticals | 2 | $112B |
|
||
| Media / Entertainment | 2 | $69B |
|
||
Price history
+114.6% since first listed5 events — show timeline
- 2026-06-15 Listed $165,000 WNYREIS
- 2009-12-30 Sold (MLS) $77,900 WNYREIS
- 2009-12-01 Sold (Public Records) $77,900 Public Records
- 2009-12-01 Sold (Public Records) $77,900 Public Records
- 2009-10-06 Listed $76,900 WNYREIS
Property tax history
+4.1%/yrLatest (2025): $2,683 · +2.1% YoY. Source: county tax records.
Cash-flow waterfall
monthlySold comps — $/sqft
last 12 mo · ≤1 miLoading sold comps…