324 Etna Street St · Russell, KY
Flood risk 8/10 · Major
- FEMA flood zone
- —
- Chance of flooding over 30 yrs
- 0.78%
- Est. flood insurance / yr
- —
Fire risk 3/10 · Minor
- Est. fire insurance / yr
- $839 – $1,559
Heat risk 5/10 · Moderate
- Hot days now (above 102°F)
- 7 days/yr
- Hot days in 30 yrs
- 20 days/yr
Wind risk 2/10 · Minimal
- Chance of severe wind over 30 yrs
- 2.0%
Air-quality risk 2/10 · Minimal
- Unhealthy air days now
- 0 days/yr
- Unhealthy air days in 30 yrs
- 2 days/yr
Risk factors via First Street. Map © Google.
Why this score? — see what drove the B- grade
The composite is a weighted blend of 9 inputs, each scored 0–100. Each bar is that input's sub-score; the figure is the points it added to the 100-point composite (weight × sub-score).
- Cash flow +24.7/30.0
- ARV discount +15.0/15.0
- DSCR +8.0/10.0
- 1% rule +6.5/10.0
- Schools +3.8/10.0
- Livability +3.8/5.0
- Rent growth +2.5/5.0
- Condition / age +2.5/5.0
- Appreciation +0.0/10.0
$115,000
🖨 Deal sheet 📄 Offer letter ✓ Due diligence
Listing remarks
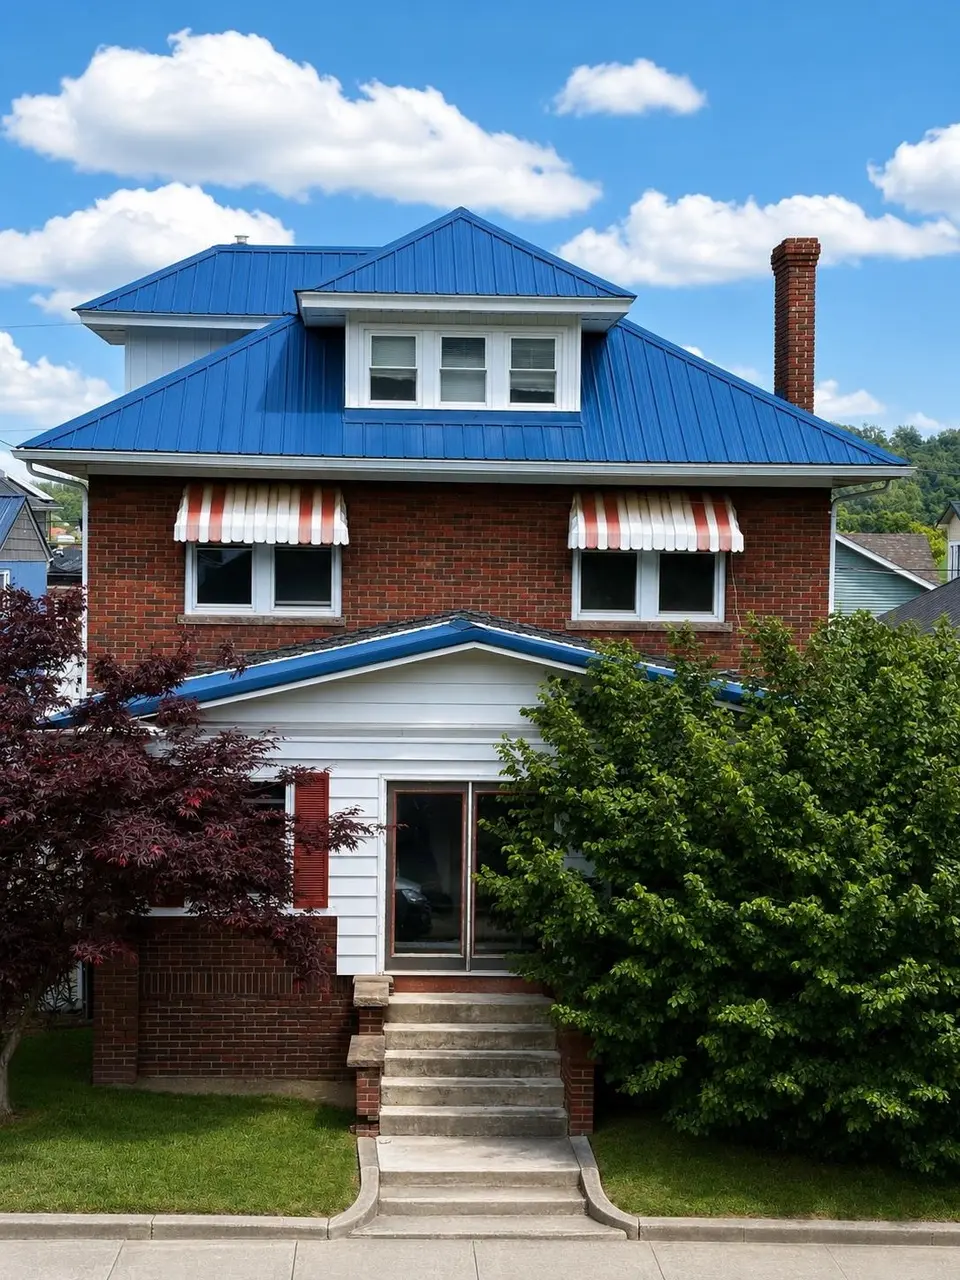
Here is your opportunity to revitalize an older 2 story home in Downtown Russell. This home is full of potential and ready for renovation. 4 Bd, 2 bath. Additional space on 3rd floor attic that could be used for small office. This property features a detached 2 car garage in the rear with extra space to park 3 - 4 cars. Being sold "as-is". Great opportunity for investors, flippers or buyers looking to build sweat equity.
Key facts
- 2 garage spots
- Listed 30 days
Tags
Property features AI
Exterior
- Parking: Detached 2-car garage
- Utilities: Public water; Public sewer
- Home design: Single-family residence; 2 stories
- Construction: Brick veneer exterior; Block foundation; Built above grade with finished area (approx. 1,898)
- Exterior features: Metal roof; Level lot; Greenbo Lake nearby
Interior
- Kitchen: Dishwasher; Gas range; Refrigerator
- Bathrooms: 2 full bathrooms
- Heating & cooling: Forced air heating; Central air conditioning
- Interior features: Dishwasher; Dryer; Gas range; Refrigerator; Gas water heater; Unfinished basement; 9 total rooms
- Laundry & utility: Dryer; Gas water heater
Neighborhood map
What this means for you Summary
Snapshot
- This is a 4-bed/2.0-bath single-family listed at $115k.
Deal economics
- At list price, monthly cash flow is $240 ($3k/yr) — positive.
- The deal already cash-flows at list — no discount required.
- Meets the 1% rule at list price ($1k rent vs $115k).
- Recommended offer: $113k (1.5% below list) — sets the bar for market timing.
Location & tenants
- Location reads 76/100 on livability (#91 in KY, #3,643 nationally) — a middle-class / working-renter tenant base. Strengths: cost of living A+, housing A+, schools A; Watch: amenities F, commute F.
- Russell Independent (suburban): math 40% / reading 49% proficiency, ranked #22 of 165 in KY (top 13%) — families likely to look elsewhere, expect single-tenant / working-renter base with shorter leases.
- Market conditions: 44 active listings in the ZIP; 20 units permitted in Greenup County in 2024 (0 in 5+ unit buildings).
Forward outlook
- Local home prices are declining (-3.0%/yr); year-one equity from $795 of loan paydown is wiped out by about $3k of value loss. Plan a longer hold.
- Greenup County population projected at -19% by 2050 — secular population decline; favor cash flow + early exit over multi-decade hold.
Negotiation context
- It's been on market 30 days — a 2% lower offer ($113k) is reasonable based on typical stale-listing flexibility.
- 2 sale attempts since 4y ago with the ask held roughly flat each time — persistent listings suggest the price (not the market) is what's stuck; bring a comps-based counter.
Risks & watch-outs
- Climate carrying-cost: severe flood risk; extreme-heat days projected 7→20/yr by 2055 (HVAC capex compounding) — expect insurance premiums to compound above CPI over the hold.
Questions for the listing agent
- Is there a deadline driving the sale (1031 exchange, divorce, estate, relocation)? That informs how much negotiation room exists.
- Schools are A-rated — typically a magnet for longer-tenancy family renters. What's the average tenant stay here, and is there a school-zone premium baked into asking?
- What's the average days-on-market for RENTAL listings here right now (not sales)? A rising rental-DOM trend means longer vacancies and softer asking-rent achievability than the comps imply.
- What's the recent tenant-quality profile in this submarket — average credit score on applications, eviction rate, late-payment / NSF rate, and stable-employment percentage? A property-management company in the area should have these aggregated.
- How much new for-sale + rental construction is in the pipeline within 1–3 miles? Heavy new supply typically softens prices + rents 12–24 months out; constrained supply supports both.
Investment metrics
- 1% rule
- 1.15% ✓
- Cap rate
- 8.79%
- Cash-on-cash
- 8.93%
- DSCR
- 1.40
- GRM
- 7.2
CMA / ARV
- ARV (on-the-fly)
- $186,004
- Comps found
- 7
Show comp detail 7 sales within ~0.75 mi
| Address | Dist | Beds/Ba | Sqft | Sold | Price | $/sf | Match |
|---|---|---|---|---|---|---|---|
| 506 Etna St | 0.21mi | 3/1.5 (-1) | 1,912 (+1%) | 10mo | $140,000 | $73 | 73 |
| 105 South St | 0.24mi | 3/2.0 (-1) | 2,016 (+6%) | 9mo | $152,000 | $75 | 66 |
| 415 Kenwood Dr | 0.53mi | 4/2.0 | 1,800 (-5%) | 4mo | $225,000 | $125 | 64 |
| 812 S 5th St | 0.68mi | 3/1.5 (-1) | 1,917 (+1%) | 1mo | $273,000 | $142 | 59 |
| 724 S 4th St | 0.61mi | 4/1.0 | 1,656 (-13%) | 2mo | $162,000 | $98 | 45 |
| 108 Seaton Dr | 0.71mi | 3/2.0 (-1) | 2,002 (+6%) | 16mo | $202,000 | $101 | 39 |
| 116 N 5th St | 0.64mi | 3/1.5 (-1) | 1,614 (-15%) | 21mo | $54,000 | $33 | 21 |
Match score weights: distance 35% · size 25% · config 20% · recency 20%. Top-matched comps best support the ARV.
Projected returns pro-forma
-3.0% appreciation · 3.0% rent growth · sell at horizon
- IRR
- -2.8%
- Equity multiple
- 0.90×
- Total profit
- $-3,350
- Equity at exit
- $17,147
- IRR
- 7.0%
- Equity multiple
- 1.52×
- Total profit
- $16,838
- Equity at exit
- $9,943
Cash invested: $32,200 (down + closing). Projections, not guarantees.
Landlord ↔ Tenant lean methodology
- Overall (STATE)
- 83 Strongly Landlord-Friendly
- State Kentucky
- 83 Strongly Landlord-Friendly · R+16
- County
- — inherits STATE
- City
- — inherits STATE
ZIP-level market 41169
- Active inventory
- 44
- Price-to-rent
- 7.2×
Monthly cashflow live
- Estimated rent
- $1,323 medium interval (Pro) →
- Mortgage (P&I)
- −$603
- Tax from tax record
- −$155 /mo · $1,855/yr
- Insurance
- −$48
- HOA
- −$0
- Vacancy / Maint / Mgmt
- −$278
- Net cashflow
- $240
Break-even live
UW: 25.0% down · 7.5% · 30yr · 1.5% tax · 5.0% vac · 8.0% maint · 8.0% mgmt
Financing live
Cash to close
- Down payment
- $28,750
- Closing costs
- $3,450
- Reserves months
- —
- Total cash needed
- —
Loan-product check · same deal, 3 products live
Conventional
25% down · 7.5% · 30yr
- Down + closing
- —
- Monthly P&I
- —
- Monthly cashflow
- —
- DSCR
- —
- Eligible?
- —
Personal DTI + credit; lowest rate.
DSCR
20% down · 8.5% · 30yr
- Down + closing
- —
- Monthly P&I
- —
- Monthly cashflow
- —
- DSCR
- —
- Eligible?
- —
No personal income docs; deal must DSCR.
Hard money
10% down · 12.0% · 12mo
- Down + closing
- —
- Monthly P&I
- —
- Monthly cashflow
- —
- DSCR
- —
- Eligible?
- —
Short-term bridge; refi at stabilization.
Listing history 19 events
-
2026-06-18days on market $115,000 Active 30 DOM
-
2026-06-17days on market $115,000 Active 29 DOM
-
2026-06-16days on market $115,000 Active 28 DOM
-
2026-06-15days on market $115,000 Active 27 DOM
-
2026-06-13days on market $115,000 Active 25 DOM
-
2026-06-12days on market $115,000 Active 24 DOM
-
2026-06-09days on market $115,000 Active 21 DOM
-
2026-06-08days on market $115,000 Active 20 DOM
-
2026-06-07days on market $115,000 Active 19 DOM
-
2026-06-07days on market $115,000 Active 18 DOM
-
2026-06-04days on market $115,000 Active 15 DOM
-
2026-06-02days on market $115,000 Active 14 DOM
-
2026-06-01days on market $115,000 Active 13 DOM
-
2026-05-31days on market $115,000 Active 12 DOM
-
2026-05-31days on market $115,000 Active 11 DOM
-
2026-05-19$115,000 Active
-
2022-10-24price $130,000
-
2022-09-19price $141,500
-
2022-07-09$146,500 Active
ⓘ Source: listings_history table (triggers on properties + properties_extension) + one-shot
backfill from property_details.listing_events for pre-trigger history.
Tax reassessment forecast KY · Resets to sale price
- Current annual tax
- $1,855 · $155/mo
- Projected year-2 tax
- $1,855 · $155/mo
- Expected delta
- $0/yr ($0/mo · 0.0%)
ⓘ Screening estimate from a state-policy table — verify with the county assessor before closing.
Climate risk First Street
- Flood 8/10 Severe 78% chance over 30 yrs
- Wildfire 3/10 Moderate
- Heat 5/10 Major 7 d/yr ≥102°F today · 20 d/yr by 30 yrs out
- Wind 2/10 Low 2% chance of damaging wind over 30 yrs
- Air quality 2/10 Low 0 unhealthy d/yr today · 2 by 30 yrs out
Nearby sold comps map
Loading sold comps map…
Walkable amenities ~0.75 mi
Loading nearby amenities…
Taxation est. · year 1
- Rental income
- $15,875
- − Mortgage interest
- −$6,442
- − Property taxes
- −$1,855
- − Insurance
- −$575
- − Repairs & maintenance
- −$1,270
- − Management
- −$1,270
- − Depreciation
- −$3,345
- Taxable income
- $1,118
- Est. tax owed @ 24.0%
- −$268
- After-tax cash flow
- $2,606/yr
For passive investors: Depreciation is non-cash, so a rental often shows a tax loss while cash-flowing — sheltering income. Rental losses are passive: they offset passive income freely, and up to $25,000/yr can offset ordinary (W-2) income if you actively participate and your MAGI is under $100k (phasing out to $0 by $150k); unused losses carry forward. On sale, claimed depreciation is recaptured at up to 25%, and gains may owe capital-gains tax (a 1031 exchange can defer both). Figures are a year-1 estimate at your 24.0% rate — not tax advice; consult a CPA.
Schools (NCES district)
- District
- Russell Independent
- NCES district ID
- 2105130
- Math proficiency
- 40% ▼ -22.00%
- Reading proficiency
- 49% ▼ -18.00%
- Median HH income
- $49,382
- Composite
- 38.14/100
- National rank
- #4268
- State rank
- #22 of 165 in KY
Livability — Russell
- Score
- 76/100
- State rank
- #91
- US rank
- #3643
Category grades
Schools grade is shown separately in the Schools card above.
Census & demographics
- Census place
- Russell, KY
- Population (ZIP)
- 5,527
Population outlook (Greenup County) Hauer SSP2
- Today (2025)
- 34,374 people
- By 2030
- 33,145 · -3.6%
- By 2040
- 30,407 · -11.5%
- By 2050
- 27,702 · -19.4%
- By 2075
- 21,970 · -36.1%
- By 2100
- 16,670 · -51.5%
Race, ethnicity, and origin ACS 2023
- Neighborhood character
- Predominantly White (94%)
- Race & ethnicity
- White 94% Two or more races 5%
- Common ancestry
- Italian 2% Serbian 2% Subsaharan African 1%
- Foreign-born
- 0%
Political lean MEDSL · Greenup
- 2024 margin
- Solid R (+50.5) · D 24.1% · R 74.6% · Other 1.3%
- 2008→2024 swing
- -36.4pp toward R · 2008: -14.1pp · 2024: -50.5pp
- All cycles
- 2024: R+50.5 2020: R+45.1 2016: R+45.5 2012: R+18.6 2008: R+14.1
Not yet ingested
- Civics
- —
Market trends
- HPI YoY
- ▼ -97.88%
- Current HPI
- 171.1405
- Rent YoY
- —
- Metro
- —
- State GDP YoY
- ▲ 1.81%
- F500 in state
- 4
Industry mix (Fortune 500 HQ in KY)
| Industry | F500 HQs | Revenue |
|---|---|---|
| Healthcare | 1 | $118B |
|
||
| Food / Beverage | 1 | $7B |
|
||
Price history
-21.5% since first listed4 events — show timeline
- 2026-05-19 Listed $115,000 AABOR
- 2022-10-24 Price Changed $130,000 AABOR
- 2022-09-19 Price Changed $141,500 AABOR
- 2022-07-09 Listed $146,500 AABOR
Property tax history
+1.4%/yrLatest (2025): $1,855 · +6.6% YoY. Source: county tax records.
Cash-flow waterfall
monthlySold comps — $/sqft
last 12 mo · ≤1 miLoading sold comps…