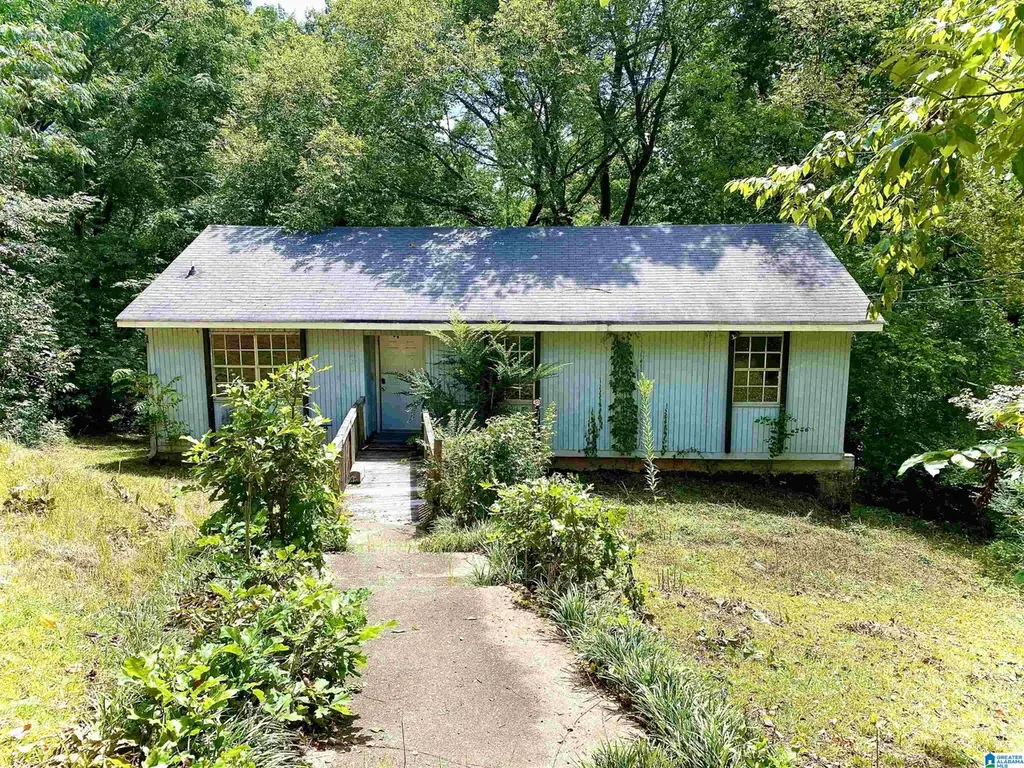
4023 Saint John Way NW · Pinson, AL
Flood risk 1/10 · Minimal
- FEMA flood zone
- X (unshaded)
- Chance of flooding over 30 yrs
- 0.0%
- Est. flood insurance / yr
- $473 – $860
Fire risk 4/10 · Minor
- Est. fire insurance / yr
- $916 – $1,700
Heat risk 5/10 · Moderate
- Hot days now (above 106°F)
- 7 days/yr
- Hot days in 30 yrs
- 19 days/yr
Wind risk 6/10 · Moderate
- Chance of severe wind over 30 yrs
- 27.0%
Air-quality risk 5/10 · Moderate
- Unhealthy air days now
- 6 days/yr
- Unhealthy air days in 30 yrs
- 11 days/yr
Risk factors via First Street. Map © Google.
Why this score? — see what drove the B grade
The composite is a weighted blend of 9 inputs, each scored 0–100. Each bar is that input's sub-score; the figure is the points it added to the 100-point composite (weight × sub-score).
- Cash flow +30.0/30.0
- ARV discount +15.0/15.0
- DSCR +10.0/10.0
- 1% rule +9.1/10.0
- Rent growth +3.3/5.0
- Livability +3.0/5.0
- Condition / age +2.5/5.0
- Schools +1.8/10.0
- Appreciation +0.0/10.0
$104,000
🖨 Deal sheet 📄 Offer letter ✓ Due diligence
Listing remarks MLS
Great opportunity in Pinson! This 3 bedroom, 1 bath home offers strong potential for both investors and homebuyers. Whether you're looking to build your rental portfolio or customize your first home, this property is full of value. Located in a quiet neighborhood with convenient access to local schools, shopping, and major highways. Don’t miss your chance to take advantage of this affordable property in a growing area.
Key facts
- Convenient access
- Local schools
- Shopping
Tags
Neighborhood map
What this means for you Summary
Snapshot
- This is a 3-bed/2.0-bath single-family listed at $104k.
Deal economics
- At list price, monthly cash flow is $515 ($6k/yr) — positive.
- The deal already cash-flows at list — no discount required.
- Meets the 1% rule at list price ($1k rent vs $104k).
- Recommended offer: $92k (12.0% below list) — sets the bar for market timing.
- Cap rate 12.2% vs local median 5.3% in Pinson — top-decile yield for the area; either an underpriced asset or a hidden risk that comps aren't pricing in. Stress-test before assuming the spread holds.
Location & tenants
- Location reads 60/100 on livability (#289 in AL) — a middle-class / working-renter tenant base. Strengths: cost of living A+, housing A+, crime B+; Watch: schools D+, amenities F, commute F.
- Jefferson County (suburban): math 9% / reading 32% proficiency, ranked #104 of 129 in AL (top 81%) — low school quality limits family demand, transient renter base, plan for 1-2y turnover.
- Market conditions: Rents rising (+3.0%/yr); 334 active listings in the ZIP; 10 comparable units currently listed for rent nearby; rentals at typical pace (median 16d on market — plan ~3-4 weeks tenant-placement turnaround); 2,114 units permitted in Jefferson County in 2024 (556 in 5+ unit buildings).
- This rent runs 33% of the median local income ($53k/yr) — at the standard rent-burdened threshold; future hikes will face affordability resistance.
Forward outlook
- Local home prices are declining (-3.0%/yr); year-one equity from $719 of loan paydown is wiped out by about $3k of value loss. Plan a longer hold.
- Jefferson County population projected to shrink 4% by 2050 — rents likely to lag national; underwrite the cash flow, not the appreciation.
- At projected returns (-3.0% appreciation + 3.0% rent growth), your $29k cash investment doubles in ~6 years — after that, you're playing with house money.
Negotiation context
- It's been on market 322 days — a 12% lower offer ($92k) is reasonable based on typical stale-listing flexibility.
Risks & watch-outs
- Climate carrying-cost: major wind risk, 27% chance of damaging wind over 30y; extreme-heat days projected 7→19/yr by 2055 (HVAC capex compounding) — expect insurance premiums to compound above CPI over the hold.
Questions for the listing agent
- It's been on market 322 days. Have you received any prior offers? Is the seller open to a 12% concession, seller financing, or rate buy-down credit?
- Built in 1976 — when were the roof, HVAC, electrical panel, plumbing, and water heater last replaced?
- Why hasn't it sold? Are there any deal-killer items the seller is aware of (foundation, flood, title, zoning, code violations)?
- Is there a deadline driving the sale (1031 exchange, divorce, estate, relocation)? That informs how much negotiation room exists.
- Schools are D-rated, which usually means shorter tenancies and higher turnover. Who's the typical renter profile here, and what's been the actual vacancy rate?
- What's the average days-on-market for RENTAL listings here right now (not sales)? A rising rental-DOM trend means longer vacancies and softer asking-rent achievability than the comps imply.
- What's the recent tenant-quality profile in this submarket — average credit score on applications, eviction rate, late-payment / NSF rate, and stable-employment percentage? A property-management company in the area should have these aggregated.
- How much new for-sale + rental construction is in the pipeline within 1–3 miles? Heavy new supply typically softens prices + rents 12–24 months out; constrained supply supports both.
Investment metrics
- 1% rule
- 1.41% ✓
- Cap rate
- 12.23%
- Cash-on-cash
- 21.22%
- DSCR
- 1.94
- GRM
- 5.9
CMA / ARV
- ARV (median comp)
- $194,182
- List price
- $104,000
- Delta
- -46.44%
- Verdict
- UNDERPRICED
- Comps
- 20 within 1.0 mi
Show comp detail 12 sales within ~0.75 mi
| Address | Dist | Beds/Ba | Sqft | Sold | Price | $/sf | Match |
|---|---|---|---|---|---|---|---|
| 321 Saint John Rd NW | 0.12mi | 3/2.0 | 1,182 (+8%) | 1mo | $191,900 | $162 | 82 |
| 3914 Caylan Cv | 0.21mi | 2/2.0 (-1) | 1,171 (+6%) | 3mo | $185,000 | $158 | 72 |
| 5947 Princess Blvd | 0.19mi | 2/2.0 (-1) | 1,171 (+6%) | 10mo | $160,000 | $137 | 67 |
| 3861 Caylan Cv | 0.33mi | 2/2.0 (-1) | 1,121 (+2%) | 12mo | $185,000 | $165 | 67 |
| 4111 Main St | 0.53mi | 3/2.0 | 1,152 (+5%) | 4mo | $185,000 | $161 | 64 |
| 229 Saint John Dr NW | 0.24mi | 2/2.0 (-1) | 1,171 (+6%) | 13mo | $183,000 | $156 | 62 |
| 204 Saint John Dr NW | 0.19mi | 2/2.0 (-1) | 1,253 (+14%) | 6mo | $168,000 | $134 | 58 |
| 5841 Princess Blvd | 0.18mi | 2/2.0 (-1) | 1,253 (+14%) | 7mo | $150,000 | $120 | 58 |
| 149 Martin Dr | 0.52mi | 3/2.0 | 1,164 (+6%) | 11mo | $159,000 | $137 | 57 |
| 3029 Apple Valley Ln | 0.74mi | 3/1.0 | 1,008 (-8%) | 2mo | $88,250 | $88 | 45 |
| 3031 Apple Valley Ln | 0.74mi | 3/1.0 | 1,008 (-8%) | 4mo | $109,000 | $108 | 44 |
| 3204 Sweeney Hollow Rd | 0.67mi | 3/1.0 | 1,008 (-8%) | 8mo | $93,900 | $93 | 44 |
Match score weights: distance 35% · size 25% · config 20% · recency 20%. Top-matched comps best support the ARV.
Projected returns pro-forma
-3.0% appreciation · 3.04% rent growth · sell at horizon
- IRR
- 13.7%
- Equity multiple
- 1.55×
- Total profit
- $15,974
- Equity at exit
- $15,507
- IRR
- 22.6%
- Equity multiple
- 2.93×
- Total profit
- $56,279
- Equity at exit
- $8,992
Cash invested: $29,120 (down + closing). Projections, not guarantees.
Landlord ↔ Tenant lean methodology
- Overall (STATE)
- 90 Strongly Landlord-Friendly
- State Alabama
- 90 Strongly Landlord-Friendly · R+15
- County
- — inherits STATE
- City
- — inherits STATE
ZIP-level market 35215
- Home prices YoY
- -34.4%
- Rents YoY
- 3.0%
- Active inventory
- 334
- Price-to-rent
- 5.9×
Monthly cashflow live
- Estimated rent
- $1,466 high interval (Pro) →
- Mortgage (P&I)
- −$545
- Tax from tax record
- −$54 /mo · $651/yr
- Insurance
- −$43
- HOA
- −$0
- Vacancy / Maint / Mgmt
- −$308
- Net cashflow
- $515
Break-even live
UW: 25.0% down · 7.5% · 30yr · 1.5% tax · 5.0% vac · 8.0% maint · 8.0% mgmt
Financing live
Cash to close
- Down payment
- $26,000
- Closing costs
- $3,120
- Reserves months
- —
- Total cash needed
- —
Loan-product check · same deal, 3 products live
Conventional
25% down · 7.5% · 30yr
- Down + closing
- —
- Monthly P&I
- —
- Monthly cashflow
- —
- DSCR
- —
- Eligible?
- —
Personal DTI + credit; lowest rate.
DSCR
20% down · 8.5% · 30yr
- Down + closing
- —
- Monthly P&I
- —
- Monthly cashflow
- —
- DSCR
- —
- Eligible?
- —
No personal income docs; deal must DSCR.
Hard money
10% down · 12.0% · 12mo
- Down + closing
- —
- Monthly P&I
- —
- Monthly cashflow
- —
- DSCR
- —
- Eligible?
- —
Short-term bridge; refi at stabilization.
Rent comps 10 comps
| Address | Beds | Baths | Sqft | Rent | $/sqft | DOM | Units | Dist |
|---|---|---|---|---|---|---|---|---|
| 212 Saint John Dr NW Birmingham, AL | 2.0 | 2.0 | 1445 | $1,423 | $0.98 | 14d | 1 | 0.20mi |
| 5992 Princess Blvd Birmingham, AL | 3.0 | 2.0 | 1454 | $1,661 | $1.14 | 43d | 1 | 0.30mi |
| 149 Martin Dr Birmingham, AL | 3.0 | 2.0 | 1164 | $1,485 | $1.28 | 23d | 1 | 0.52mi |
| 4205 Silver Lake Rd Unit 4205 Pinson, AL | 2.0 | 1.0 | 1210 | $1,200 | $0.99 | 14d | 1 | 0.84mi |
| 4246 Centerwood Dr Birmingham, AL | 3.0 | 2.0 | 1336 | $1,450 | $1.09 | 16d | 1 | 0.89mi |
| 202 Westchester Dr Birmingham, AL | 4.0 | 2.0 | 1374 | $1,300 | $0.95 | 23d | 1 | 1.00mi |
| 3073 Panorama E Birmingham, AL | 1.0–3.0 | 1.0–2.0 | 975 | $1,275 | $1.31 | 1d | 20 | 1.03mi |
| 232 Glenvalley Ln NW Birmingham, AL | 4.0 | 2.0 | 954 | $1,610 | $1.69 | 3d | 1 | 1.12mi |
| 3309 Chase Ln Unit 3309 Birmingham, AL | 2.0 | 2.0 | 1068 | $1,000 | $0.94 | 43d | 1 | 1.20mi |
| 1104 Oak Creek Trl NE Birmingham, AL | 3.0 | 2.0 | 1233 | $1,543 | $1.25 | 2d | 1 | 1.49mi |
Listing history 19 events
-
2026-06-18days on market $104,000 Active 322 DOM
-
2026-06-17days on market $104,000 Active 321 DOM
-
2026-06-16days on market $104,000 Active 320 DOM
-
2026-06-15days on market $104,000 Active 319 DOM
-
2026-06-13days on market $104,000 Active 317 DOM
-
2026-06-10days on market $104,000 Active 314 DOM
-
2026-06-09days on market $104,000 Active 313 DOM
-
2026-06-08days on market $104,000 Active 312 DOM
-
2026-06-07days on market $104,000 Active 311 DOM
-
2026-06-03days on market $104,000 Active 307 DOM
-
2026-06-02days on market $104,000 Active 306 DOM
-
2026-06-01days on market $104,000 Active 305 DOM
-
2026-05-31days on market $104,000 Active 304 DOM
-
2025-09-26price $104,000 428-char remark
Show marketing remark (428 chars)
Great opportunity in Pinson! This 3 bedroom, 1 bath home offers strong potential for both investors and homebuyers. Whether you're looking to build your rental portfolio or customize your first home, this property is full of value. Located in a quiet neighborhood with convenient access to local schools, shopping, and major highways. Don’t miss your chance to take advantage of this affordable property in a growing area.
-
2025-07-31$105,000 Active 428-char remark
Show marketing remark (428 chars)
Great opportunity in Pinson! This 3 bedroom, 1 bath home offers strong potential for both investors and homebuyers. Whether you're looking to build your rental portfolio or customize your first home, this property is full of value. Located in a quiet neighborhood with convenient access to local schools, shopping, and major highways. Don’t miss your chance to take advantage of this affordable property in a growing area.
-
2022-07-28soldstatus $465,000
-
2022-07-28soldstatus $679,000
-
2015-01-29soldstatus $46,500
-
1991-11-08soldstatus $45,900
ⓘ Source: listings_history table (triggers on properties + properties_extension) + one-shot
backfill from property_details.listing_events for pre-trigger history.
Tax reassessment forecast AL · Resets to sale price
- Current annual tax
- $651 · $54/mo
- Projected year-2 tax
- $651 · $54/mo
- Expected delta
- $0/yr ($0/mo · 0.0%)
ⓘ Screening estimate from a state-policy table — verify with the county assessor before closing.
Climate risk First Street
- Flood 1/10 Low FEMA zone X (unshaded) · 0% chance over 30 yrs
- Wildfire 4/10 Moderate
- Heat 5/10 Major 7 d/yr ≥106°F today · 19 d/yr by 30 yrs out
- Wind 6/10 Major 27% chance of damaging wind over 30 yrs
- Air quality 5/10 Major 6 unhealthy d/yr today · 11 by 30 yrs out
Nearby sold comps map
Loading sold comps map…
Walkable amenities ~0.75 mi
Loading nearby amenities…
Taxation est. · year 1
- Rental income
- $17,588
- − Mortgage interest
- −$5,826
- − Property taxes
- −$651
- − Insurance
- −$520
- − Repairs & maintenance
- −$1,407
- − Management
- −$1,407
- − Depreciation
- −$3,025
- Taxable income
- $4,751
- Est. tax owed @ 24.0%
- −$1,140
- After-tax cash flow
- $5,038/yr
For passive investors: Depreciation is non-cash, so a rental often shows a tax loss while cash-flowing — sheltering income. Rental losses are passive: they offset passive income freely, and up to $25,000/yr can offset ordinary (W-2) income if you actively participate and your MAGI is under $100k (phasing out to $0 by $150k); unused losses carry forward. On sale, claimed depreciation is recaptured at up to 25%, and gains may owe capital-gains tax (a 1031 exchange can defer both). Figures are a year-1 estimate at your 24.0% rate — not tax advice; consult a CPA.
Schools (NCES district)
- District
- Jefferson County
- NCES district ID
- 0101920
- Math proficiency
- 9% ▼ -24.00%
- Reading proficiency
- 32% ▼ -5.00%
- Median HH income
- $51,712
- Composite
- 18.4/100
- National rank
- #8937
- State rank
- #104 of 129 in AL
Livability — Pinson
- Score
- 60/100
- State rank
- #289
- US rank
- #18763
Category grades
Schools grade is shown separately in the Schools card above.
Census & demographics
- County
- Jefferson County · 527,445 people
- City population
- 22,599
- Metro
- Birmingham-Hoover, AL
- Population (ZIP)
- 43,903
- Household income
- $52,793
- Rent vs Own
- Severe rent burden
- 1729.0
Population outlook (Jefferson County) Hauer SSP2
- Today (2025)
- 669,185 people
- By 2030
- 669,694 · +0.1%
- By 2040
- 661,388 · -1.2%
- By 2050
- 643,086 · -3.9%
- By 2075
- 577,267 · -13.7%
- By 2100
- 474,758 · -29.1%
Race, ethnicity, and origin ACS 2023
- Neighborhood character
- Predominantly Black (75%)
- Race & ethnicity
- Black 75% White 15% Hispanic / Latino 7% Two or more races 3%
- Hispanic origin (detail)
- Mexican 4%
- Common ancestry
- Lithuanian 1% Italian 1% Slovak 1%
- Foreign-born
- 4% · Canada
- Languages at home
- 92% English-only · Spanish 7%
Political lean MEDSL · Jefferson
- 2024 margin
- D (+10.4) · D 54.6% · R 44.2% · Other 1.2%
- 2008→2024 swing
- +5.4pp toward D · 2008: 5.1pp · 2024: 10.4pp
- All cycles
- 2024: D+10.4 2020: D+13.2 2016: D+7.2 2012: D+6.0 2008: D+5.1
Not yet ingested
- Civics
- —
Market trends
- HPI YoY
- ▼ -112.97%
- Current HPI
- 215.0607
- Rent YoY
- ▲ 3.04%
- Metro
- Birmingham-Hoover, AL
- State GDP YoY
- ▲ 2.94%
- F500 in state
- 4
Industry mix (Fortune 500 HQ in AL)
| Industry | F500 HQs | Revenue |
|---|---|---|
| Financial Services | 1 | $8B |
|
||
| Healthcare | 1 | $5B |
|
||
Price history
+126.6% since first listed6 events — show timeline
- 2025-09-26 Price Changed $104,000 Greater Alabama MLS
- 2025-07-31 Listed $105,000 Greater Alabama MLS
- 2022-07-28 Sold (Public Records) $679,000 Public Records
- 2022-07-28 Sold (Public Records) $465,000 Public Records
- 2015-01-29 Sold (Public Records) $46,500 Public Records
- 1991-11-08 Sold (Public Records) $45,900 Public Records
Property tax history
-1.2%/yrLatest (2025): $651 · +0.0% YoY. Source: county tax records.
Cash-flow waterfall
monthlySold comps — $/sqft
last 12 mo · ≤1 miLoading sold comps…