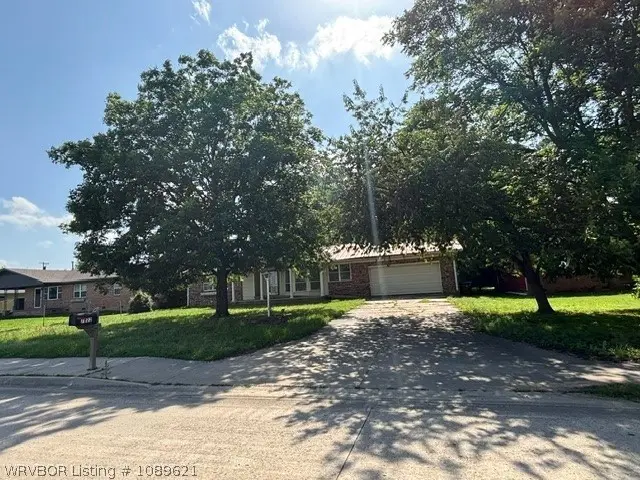
7222 Jenny Lind Rd · Fort Smith, AR
Flood risk 1/10 · Minimal
- FEMA flood zone
- X (unshaded)
- Chance of flooding over 30 yrs
- 0.0%
- Est. flood insurance / yr
- $507 – $1,088
Fire risk 4/10 · Minor
- Est. fire insurance / yr
- $1,499 – $2,785
Heat risk 7/10 · Major
- Hot days now (above 111°F)
- 7 days/yr
- Hot days in 30 yrs
- 20 days/yr
Wind risk 2/10 · Minimal
- Chance of severe wind over 30 yrs
- 2.0%
Air-quality risk 2/10 · Minimal
- Unhealthy air days now
- 0 days/yr
- Unhealthy air days in 30 yrs
- 1 days/yr
Risk factors via First Street. Map © Google.
Why this score? — see what drove the B- grade
The composite is a weighted blend of 9 inputs, each scored 0–100. Each bar is that input's sub-score; the figure is the points it added to the 100-point composite (weight × sub-score).
- Cash flow +26.8/30.0
- ARV discount +15.0/15.0
- DSCR +9.2/10.0
- 1% rule +6.3/10.0
- Livability +3.2/5.0
- Schools +3.1/10.0
- Rent growth +2.5/5.0
- Condition / age +2.5/5.0
- Appreciation +0.0/10.0
$142,000
🖨 Deal sheet 📄 Offer letter ✓ Due diligence
Listing remarks
Nice tree shaded lot, oversized home offering living room and den, metal roof, handicap ramp in front and garage. Central location with easy access to interstate. HUD Case# 031-447963 * "HUD homes are Sold As Is" * www. olympusams-at.com * www. HudHomeStore. gov * Owner Occupants, Nonprofits, and Government Agencies only for first 10 days of listing.
Key facts
- Metal roof
- Central location
- Tree shaded lot
Tags
Property features AI
Exterior
- Parking: Attached garage with 2 covered spaces; Gravel driveway
- Utilities: Public water; Sewer available; Electricity available; Phone available
- Home design: Single-family house; One story
- Construction: Brick construction; Metal roof
- Exterior features: Front porch; Back yard fencing; Level lot; Publicly maintained road
Interior
- Kitchen: Microwave; Electric water heater
- Flooring: Laminate; Wood
- Bathrooms: 2 full bathrooms
- Heating & cooling: Central heating; Central air; Ceiling fan(s)
- Interior features: Ceiling fan(s); Fireplace in the family room
- Laundry & utility: Washer hookup; Electric dryer hookup
Neighborhood map
What this means for you Summary
Snapshot
- This is a 4-bed/2.0-bath single-family listed at $142k.
Deal economics
- At list price, monthly cash flow is $387 ($5k/yr) — positive.
- The deal already cash-flows at list — no discount required.
- Meets the 1% rule at list price ($2k rent vs $142k).
- Cap rate 9.6% vs local median 4.3% in Fort Smith — top-decile yield for the area; either an underpriced asset or a hidden risk that comps aren't pricing in. Stress-test before assuming the spread holds.
Location & tenants
- Location reads 65/100 on livability (#151 in AR) — a middle-class / working-renter tenant base. Strengths: cost of living A+, housing A+, health & safety A+; Watch: crime F, amenities F, commute F.
- Fort Smith School District (urban): math 35% / reading 39% proficiency, ranked #106 of 238 in AR (top 44%) — families likely to look elsewhere, expect single-tenant / working-renter base with shorter leases; 64% free/reduced lunch — lower-income household profile, screen leases tightly.
- Zoned schools: Beard Elementary School (math 42% / reading 52%, grade D-, #119 of 454 statewide, top 28%, 309 students, 77% FRL); Ramsey Junior High School (math 37% / reading 47%, grade D-, #78 of 201 statewide, top 40%, 832 students, 67% FRL); Southside High School (math 36% / reading 53%, grade F, #31 of 292 statewide, top 12%, 1,956 students, 47% FRL) — zoned schools at 64% FRL track the district average.
- Market conditions: 97 active listings in the ZIP; 388 units permitted in Sebastian County in 2024 (16 in 5+ unit buildings).
Forward outlook
- Local home prices are declining (-3.0%/yr); year-one equity from $982 of loan paydown is wiped out by about $4k of value loss. Plan a longer hold.
- Sebastian County population projected at +7% by 2050 — modest demand growth; plan on rents tracking national, not racing it.
- At projected returns (-3.0% appreciation + 3.0% rent growth), your $40k cash investment doubles in ~10 years — after that, you're playing with house money.
Negotiation context
- Only 9 days on market — expect competitive offers; lowballing is unlikely to land.
Risks & watch-outs
- Climate carrying-cost: extreme-heat days projected 7→20/yr by 2055 (HVAC capex compounding) — expect insurance premiums to compound above CPI over the hold.
Questions for the listing agent
- Built in 1973 — when were the roof, HVAC, electrical panel, plumbing, and water heater last replaced?
- Is there a deadline driving the sale (1031 exchange, divorce, estate, relocation)? That informs how much negotiation room exists.
- Schools are D-rated, which usually means shorter tenancies and higher turnover. Who's the typical renter profile here, and what's been the actual vacancy rate?
- Crime grade is F in this area — have there been break-ins, vandalism, or insurance claims at this property in the last 3 years? What carrier currently insures it and at what premium?
- What's the average days-on-market for RENTAL listings here right now (not sales)? A rising rental-DOM trend means longer vacancies and softer asking-rent achievability than the comps imply.
- What's the recent tenant-quality profile in this submarket — average credit score on applications, eviction rate, late-payment / NSF rate, and stable-employment percentage? A property-management company in the area should have these aggregated.
- How much new for-sale + rental construction is in the pipeline within 1–3 miles? Heavy new supply typically softens prices + rents 12–24 months out; constrained supply supports both.
Investment metrics
- 1% rule
- 1.13% ✓
- Cap rate
- 9.56%
- Cash-on-cash
- 11.69%
- DSCR
- 1.52
- GRM
- 7.4
CMA / ARV
- ARV (on-the-fly)
- $257,240
- Comps found
- 3
Show comp detail 3 sales within ~0.75 mi
| Address | Dist | Beds/Ba | Sqft | Sold | Price | $/sf | Match |
|---|---|---|---|---|---|---|---|
| 8005 Hermitage Dr | 0.41mi | 4/2.0 | 2,240 (+3%) | 12mo | $243,500 | $109 | 66 |
| 8305 Meadow Dr | 0.68mi | 3/2.0 (-1) | 2,340 (+7%) | 7mo | $308,000 | $132 | 45 |
| 7811 Meadow Dr | 0.41mi | 3/2.0 (-1) | 1,862 (-15%) | 17mo | $219,000 | $118 | 38 |
Match score weights: distance 35% · size 25% · config 20% · recency 20%. Top-matched comps best support the ARV.
Projected returns pro-forma
-3.0% appreciation · 3.0% rent growth · sell at horizon
- IRR
- 1.1%
- Equity multiple
- 1.04×
- Total profit
- $1,613
- Equity at exit
- $21,173
- IRR
- 10.7%
- Equity multiple
- 1.83×
- Total profit
- $33,013
- Equity at exit
- $12,278
Cash invested: $39,760 (down + closing). Projections, not guarantees.
Landlord ↔ Tenant lean methodology
- Overall (STATE)
- 92 Strongly Landlord-Friendly
- State Arkansas
- 92 Strongly Landlord-Friendly · R+14
- County
- — inherits STATE
- City
- — inherits STATE
ZIP-level market 72908
- Active inventory
- 97
- Price-to-rent
- 7.4×
Monthly cashflow live
- Estimated rent
- $1,609 medium interval (Pro) →
- Mortgage (P&I)
- −$745
- Tax from tax record
- −$80 /mo · $963/yr
- Insurance
- −$59
- HOA
- −$0
- Vacancy / Maint / Mgmt
- −$338
- Net cashflow
- $387
Break-even live
UW: 25.0% down · 7.5% · 30yr · 1.5% tax · 5.0% vac · 8.0% maint · 8.0% mgmt
Financing live
Cash to close
- Down payment
- $35,500
- Closing costs
- $4,260
- Reserves months
- —
- Total cash needed
- —
Loan-product check · same deal, 3 products live
Conventional
25% down · 7.5% · 30yr
- Down + closing
- —
- Monthly P&I
- —
- Monthly cashflow
- —
- DSCR
- —
- Eligible?
- —
Personal DTI + credit; lowest rate.
DSCR
20% down · 8.5% · 30yr
- Down + closing
- —
- Monthly P&I
- —
- Monthly cashflow
- —
- DSCR
- —
- Eligible?
- —
No personal income docs; deal must DSCR.
Hard money
10% down · 12.0% · 12mo
- Down + closing
- —
- Monthly P&I
- —
- Monthly cashflow
- —
- DSCR
- —
- Eligible?
- —
Short-term bridge; refi at stabilization.
Listing history 9 events
-
2026-06-18status $142,000 Pending 9 DOM
-
2026-06-18days on market $142,000 Active 9 DOM
-
2026-06-17days on market $142,000 Active 8 DOM
-
2026-06-16days on market $142,000 Active 7 DOM
-
2026-06-15days on market $142,000 Active 6 DOM
-
2026-06-14days on market $142,000 Active 4 DOM
-
2026-06-13days on market $142,000 Active 3 DOM
-
2026-06-10remarks 359-char remark
-
2026-06-10$142,000 Active 1 DOM
ⓘ Source: listings_history table (triggers on properties + properties_extension) + one-shot
backfill from property_details.listing_events for pre-trigger history.
Tax reassessment forecast AR · Resets to sale price
- Current annual tax
- $963 · $80/mo
- Projected year-2 tax
- $963 · $80/mo
- Expected delta
- $0/yr ($0/mo · 0.0%)
ⓘ Screening estimate from a state-policy table — verify with the county assessor before closing.
Climate risk First Street
- Flood 1/10 Low FEMA zone X (unshaded) · 0% chance over 30 yrs
- Wildfire 4/10 Moderate
- Heat 7/10 Severe 7 d/yr ≥111°F today · 20 d/yr by 30 yrs out
- Wind 2/10 Low 2% chance of damaging wind over 30 yrs
- Air quality 2/10 Low 0 unhealthy d/yr today · 1 by 30 yrs out
Nearby sold comps map
Loading sold comps map…
Walkable amenities ~0.75 mi
Loading nearby amenities…
Taxation est. · year 1
- Rental income
- $19,310
- − Mortgage interest
- −$7,954
- − Property taxes
- −$963
- − Insurance
- −$710
- − Repairs & maintenance
- −$1,545
- − Management
- −$1,545
- − Depreciation
- −$4,131
- Taxable income
- $2,462
- Est. tax owed @ 24.0%
- −$591
- After-tax cash flow
- $4,055/yr
For passive investors: Depreciation is non-cash, so a rental often shows a tax loss while cash-flowing — sheltering income. Rental losses are passive: they offset passive income freely, and up to $25,000/yr can offset ordinary (W-2) income if you actively participate and your MAGI is under $100k (phasing out to $0 by $150k); unused losses carry forward. On sale, claimed depreciation is recaptured at up to 25%, and gains may owe capital-gains tax (a 1031 exchange can defer both). Figures are a year-1 estimate at your 24.0% rate — not tax advice; consult a CPA.
Schools (NCES district)
- District
- Fort Smith School District
- NCES district ID
- 0506330
- Math proficiency
- 35% ▼ -11.00%
- Reading proficiency
- 39% ▼ -7.00%
- Median HH income
- $36,066
- Composite
- 30.66/100
- National rank
- #6183
- State rank
- #106 of 238 in AR
Livability — Fort Smith
- Score
- 65/100
- State rank
- #151
- US rank
- #13185
Category grades
Schools grade is shown separately in the Schools card above.
Census & demographics
- Census place
- Fort Smith, AR
- County
- Sebastian County · 99,312 people
- City population
- 94,356
- Metro
- Fort Smith, AR-OK
- Population (ZIP)
- 14,288
- Household income
- $72,732
- Rent vs Own
- Severe rent burden
- 354.0
Population outlook (Sebastian County) Hauer SSP2
- Today (2025)
- 133,992 people
- By 2030
- 136,620 · +2.0%
- By 2040
- 140,832 · +5.1%
- By 2050
- 143,301 · +6.9%
- By 2075
- 147,964 · +10.4%
- By 2100
- 145,848 · +8.8%
Race, ethnicity, and origin ACS 2023
- Neighborhood character
- Predominantly White (74%)
- Race & ethnicity
- White 74% Two or more races 11% Hispanic / Latino 9% Asian 6% Black 2% Native American 2%
- Hispanic origin (detail)
- Mexican 6%
- Common ancestry
- Slovak 4% Lithuanian 4% Italian 1%
- Foreign-born
- 5% · Vietnam, Canada
- Languages at home
- 90% English-only · Spanish 4% Vietnamese 3% Other Asian/Pacific 2%
Political lean MEDSL · Sebastian
- 2024 margin
- Solid R (+37.5) · D 30.0% · R 67.6% · Other 2.4%
- 2008→2024 swing
- -2.9pp toward R · 2008: -34.6pp · 2024: -37.5pp
- All cycles
- 2024: R+37.5 2020: R+35.5 2016: R+38.1 2012: R+37.1 2008: R+34.6
Not yet ingested
- Civics
- —
Market trends
- HPI YoY
- ▼ -136.01%
- Current HPI
- 202.0886
- Rent YoY
- —
- Metro
- Fort Smith, AR-OK
- State GDP YoY
- ▲ 3.80%
- F500 in state
- 10
Industry mix (Fortune 500 HQ in AR)
| Industry | F500 HQs | Revenue |
|---|---|---|
| Retail | 1 | $681B |
|
||
| Food / Agriculture | 1 | $53B |
|
||
| Retail / Energy | 1 | $22B |
|
||
| Transportation / Logistics | 1 | $12B |
|
||
| Energy | 1 | $4B |
|
||
Price history
1 event — show timeline
- 2026-06-09 Listed $142,000 WRVBOR
Property tax history
-0.4%/yrLatest (2025): $963 · -4.0% YoY. Source: county tax records.
Cash-flow waterfall
monthlySold comps — $/sqft
last 12 mo · ≤1 miLoading sold comps…