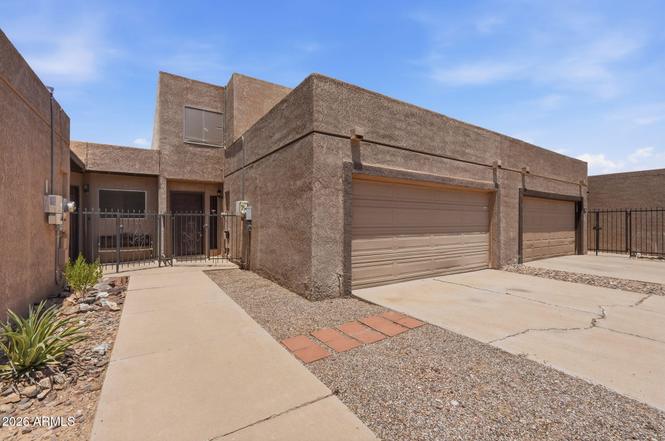
742 E Pepper Dr · Casa Grande, AZ
Flood risk 1/10 · Minimal
- FEMA flood zone
- X (unshaded)
- Chance of flooding over 30 yrs
- 0.0%
- Est. flood insurance / yr
- $507 – $1,088
Fire risk 6/10 · Moderate
- Est. fire insurance / yr
- $610 – $1,132
Heat risk 9/10 · Severe
- Hot days now (above 113°F)
- 7 days/yr
- Hot days in 30 yrs
- 19 days/yr
Wind risk 1/10 · Minimal
- Chance of severe wind over 30 yrs
- —
Air-quality risk 1/10 · Minimal
- Unhealthy air days now
- 0 days/yr
- Unhealthy air days in 30 yrs
- 0 days/yr
Risk factors via First Street. Map © Google.
Why this score? — see what drove the D- grade
The composite is a weighted blend of 9 inputs, each scored 0–100. Each bar is that input's sub-score; the figure is the points it added to the 100-point composite (weight × sub-score).
- Cash flow +15.6/30.0
- DSCR +4.8/10.0
- Rent growth +3.7/5.0
- 1% rule +3.5/10.0
- Livability +2.9/5.0
- Condition / age +2.5/5.0
- ARV discount +1.9/15.0
- Schools +1.5/10.0
- Appreciation +0.0/10.0
$235,000
🖨 Deal sheet (PDF) 📄 Offer letter ✓ Due diligence
Listing remarks
Home, sweet home in Casa Grande Townhomes! This inviting residence features a semi-open floor plan with a spacious living room highlighted by exposed beams, designer paint, tile flooring, and wood laminate in all the right places. The kitchen offers stainless steel appliances, granite countertops, rich wood cabinetry, and a peninsula with breakfast bar seating. Upstairs, you'll find comfortable bedrooms, including a primary suite with dual closets and an ensuite bath featuring double sinks. Step outside to your private patio--ideal for morning coffee, evening relaxation, or weekend BBQs. Enjoy easy access to the community pool and a convenient Casa Grande location near shopping, dining, and
Key facts
- Rich wood cabinetry
- Semi-open floor plan
- Granite countertops
Tags
Property features AI
Finance
- HOA & community: Community pool; HOA with monthly fee of $100 covering grounds maintenance
Exterior
- Parking: Covered parking for 2; 2-car garage with direct access and garage door opener
- Utilities: Private water company; Public sewer (connected)
- Home design: Attached townhouse; Fee simple ownership; Asphalt road frontage
- Construction: Stucco and wood frame construction; Painted exterior; Foam roof
- Exterior features: Block fencing; Gravel/stone front; City-maintained road
Interior
- Kitchen: Dishwasher; Disposal; Built-in electric oven; Pantry; Eat-in kitchen with breakfast bar; Granite counters
- Bedrooms: 3 possible bedrooms
- Flooring: Laminate flooring; Tile flooring
- Bathrooms: 2 full bathrooms; 1 half bathroom
- Heating & cooling: Electric heating; Central air conditioning; Ceiling fans
- Interior features: High-speed internet; Granite counters; Double vanity in bathroom; Upstairs living area; Eat-in kitchen; Breakfast bar; 9+ foot flat ceilings; Pantry; Master bedroom with 3/4 bath; Solar panels
- Laundry & utility: Laundry in garage
Neighborhood map
What this means for you Summary
Snapshot
- This is a 3-bed/2.5-bath townhouse listed at $235k.
Deal economics
- At list price, monthly cash flow is $101 ($1k/yr) — positive.
- The deal already cash-flows at list — no discount required.
- To meet the 1% rule (rent ≥ 1% of price), the offer needs to be $200k (15.1% below list).
- Recommended offer: $200k (15.1% below list) — sets the bar for 1% rule.
- Cap rate 6.8% vs local median 4.0% in Casa Grande — top-decile yield for the area; either an underpriced asset or a hidden risk that comps aren't pricing in. Stress-test before assuming the spread holds.
Location & tenants
- Location reads 58/100 on livability (#220 in AZ) — a working-class tenant base; expect higher turnover. Strengths: cost of living A+, housing A+; Watch: crime D+, employment D+, amenities F.
- Casa Grande Union High School District (4453) (suburban): math 14% / reading 21% proficiency, ranked #193 of 249 in AZ (top 78%) — low school quality limits family demand, transient renter base, plan for 1-2y turnover.
- Zoned schools: Evergreen Elementary School (math 13% / reading 18%, grade F, #864 of 1,109 statewide, top 78%, 51 students, 82% FRL); Casa Grande Middle School (math 7% / reading 12%, grade F, #197 of 218 statewide, top 91%, 645 students, 84% FRL); Casa Grande Union High School (math 18% / reading 25%, grade F, #217 of 381 statewide, top 57%, 2,132 students, 52% FRL).
- Market conditions: Rents rising fast (+4.6%/yr); 632 active listings in the ZIP; 34 comparable units currently listed for rent nearby; rentals at typical pace (median 17d on market — plan ~3-4 weeks tenant-placement turnaround); 9,504 units permitted in Pinal County in 2024 (776 in 5+ unit buildings).
- This rent runs 35% of the median local income ($68k/yr) — at the standard rent-burdened threshold; future hikes will face affordability resistance.
Forward outlook
- Local home prices are declining (-3.0%/yr); year-one equity from $2k of loan paydown is wiped out by about $7k of value loss. Plan a longer hold.
Negotiation context
- Only 11 days on market — expect competitive offers; lowballing is unlikely to land.
- 13 sale attempts since 22y ago with the ask held roughly flat each time — persistent listings suggest the price (not the market) is what's stuck; bring a comps-based counter.
Risks & watch-outs
- Climate carrying-cost: major wildfire risk; extreme-heat days projected 7→19/yr by 2055 (HVAC capex compounding) — expect insurance premiums to compound above CPI over the hold.
Questions for the listing agent
- What does the HOA fee cover, when was the last increase, and are there any pending special assessments or reserve-fund shortfalls?
- Is there a deadline driving the sale (1031 exchange, divorce, estate, relocation)? That informs how much negotiation room exists.
- Schools are F-rated, which usually means shorter tenancies and higher turnover. Who's the typical renter profile here, and what's been the actual vacancy rate?
- Crime grade is D in this area — have there been break-ins, vandalism, or insurance claims at this property in the last 3 years? What carrier currently insures it and at what premium?
- The area grade is low — what's the realistic commute time and amenity access for the typical tenant pool here? Any planned neighborhood developments (good or bad) we should know about?
- What's the average days-on-market for RENTAL listings here right now (not sales)? A rising rental-DOM trend means longer vacancies and softer asking-rent achievability than the comps imply.
- What's the recent tenant-quality profile in this submarket — average credit score on applications, eviction rate, late-payment / NSF rate, and stable-employment percentage? A property-management company in the area should have these aggregated.
- How much new for-sale + rental construction is in the pipeline within 1–3 miles? Heavy new supply typically softens prices + rents 12–24 months out; constrained supply supports both.
Investment metrics
- 1% rule
- 0.85% ✗
- Cap rate
- 6.81%
- Cash-on-cash
- 1.84%
- DSCR
- 1.08
- GRM
- 9.8
CMA / ARV
- ARV (on-the-fly)
- $209,170
- Comps found
- 7
Show comp detail 7 sales within ~0.75 mi
| Address | Dist | Beds/Ba | Sqft | Sold | Price | $/sf | Match |
|---|---|---|---|---|---|---|---|
| 711 E Laurel Dr #21 | 0.07mi | 3/2.0 | 1,600 (-1%) | 15mo | $199,000 | $124 | 82 |
| 711 E Laurel Dr #7 | 0.07mi | 3/2.0 | 1,600 (-1%) | 23mo | $198,000 | $124 | 75 |
| 711 E Laurel Dr #13 | 0.07mi | 3/2.0 | 1,470 (-9%) | 8mo | $138,000 | $94 | 74 |
| 766 E Pepper Dr | 0.06mi | 2/1.5 (-1) | 1,443 (-10%) | 22mo | $240,000 | $166 | 53 |
| 742 E Laurel Dr | 0.09mi | 2/2.0 (-1) | 1,375 (-14%) | 22mo | $179,000 | $130 | 46 |
| 746 E Laurel Dr | 0.08mi | 2/2.0 (-1) | 1,374 (-15%) | 24mo | $199,900 | $145 | 45 |
| 846 N Pueblo Dr #119 | 0.55mi | 3/2.0 | 1,412 (-12%) | 14mo | $220,000 | $156 | 41 |
Match score weights: distance 35% · size 25% · config 20% · recency 20%. Top-matched comps best support the ARV.
Projected returns pro-forma
-3.0% appreciation · 4.6% rent growth · sell at horizon
- IRR
- -11.8%
- Equity multiple
- 0.57×
- Total profit
- $-28,464
- Equity at exit
- $35,039
- IRR
- -0.6%
- Equity multiple
- 0.96×
- Total profit
- $-2,943
- Equity at exit
- $20,319
Cash invested: $65,800 (down + closing). Projections, not guarantees.
Landlord ↔ Tenant lean methodology
- Overall (STATE)
- 87 Strongly Landlord-Friendly
- State Arizona
- 87 Strongly Landlord-Friendly · R+3
- County
- — inherits STATE
- City
- — inherits STATE
ZIP-level market 85122
- Home prices YoY
- -22.4%
- Rents YoY
- 4.6%
- Active inventory
- 632
- Price-to-rent
- 9.8×
Monthly cashflow live
- Estimated rent
- $1,995 high interval (Pro) →
- Mortgage (P&I)
- −$1,232
- Tax from tax record
- −$45 /mo · $541/yr
- Insurance
- −$98
- HOA
- −$100
- Vacancy / Maint / Mgmt
- −$419
- Net cashflow
- $101
Break-even live
Sensitivity live
| Price | -10% $234 | -5% $167 | +0% $101 | +5% $34 | +10% $-32 |
|---|---|---|---|---|---|
| Rent | -10% $-57 | -5% $22 | +0% $101 | +5% $180 | +10% $258 |
| Rate | -1.0pp $219 | -0.5pp $160 | base $101 | +0.5pp $40 | +1.0pp $-22 |
UW: 25.0% down · 7.5% · 30yr · 1.5% tax · 5.0% vac · 8.0% maint · 8.0% mgmt
Financing live
Cash to close
- Down payment
- $58,750
- Closing costs
- $7,050
- Reserves months
- —
- Total cash needed
- —
Loan-product check · same deal, 3 products live
Conventional
25% down · 7.5% · 30yr
- Down + closing
- —
- Monthly P&I
- —
- Monthly cashflow
- —
- DSCR
- —
- Eligible?
- —
Personal DTI + credit; lowest rate.
DSCR
20% down · 8.5% · 30yr
- Down + closing
- —
- Monthly P&I
- —
- Monthly cashflow
- —
- DSCR
- —
- Eligible?
- —
No personal income docs; deal must DSCR.
Hard money
10% down · 12.0% · 12mo
- Down + closing
- —
- Monthly P&I
- —
- Monthly cashflow
- —
- DSCR
- —
- Eligible?
- —
Short-term bridge; refi at stabilization.
Rent comps 34 comps
| Address | Beds | Baths | Sqft | Rent | $/sqft | DOM | Units | Dist |
|---|---|---|---|---|---|---|---|---|
| 1100 N Brown Ave Casa Grande, AZ | 3.0 | 2.0 | 1609 | $1,950 | $1.21 | 0d | 1 | 0.22mi |
| 1131 E Trinity Pl Casa Grande, AZ | 4.0 | 2.5 | 1600 | $1,650 | $1.03 | 26d | 1 | 0.31mi |
| 919 N Gilbert Ave Casa Grande, AZ | 3.0 | 2.0 | 1630 | $1,850 | $1.13 | 0d | 1 | 0.31mi |
| 928 N Pueblo Dr Casa Grande, AZ | 3.0 | 2.0 | 1300 | $1,550 | $1.19 | 26d | 1 | 0.46mi |
| 846 N Pueblo Dr #138 Casa Grande, AZ | 3.0 | 2.0 | 1324 | $1,700 | $1.28 | 16d | 1 | 0.52mi |
| 1025 N Menze St Casa Grande, AZ | 3.0 | 1.5 | 1301 | $1,695 | $1.30 | 14d | 1 | 0.53mi |
| 1007 N Menze St Casa Grande, AZ | 4.0 | 2.0 | 1539 | $1,580 | $1.03 | 7d | 1 | 0.54mi |
| 1620 N Trekell Rd Casa Grande, AZ | 1.0–3.0 | 1.0–2.5 | 1090 | $2,640 | $2.42 | 0d | 1 | 0.63mi |
| 1642 N Cameron St Casa Grande, AZ | 3.0 | 2.5 | 1577 | $3,250 | $2.06 | 26d | 1 | 0.65mi |
| 1640 N Cameron St Unit 1640 Casa Grande, AZ | 3.0 | 2.5 | 1577 | $3,250 | $2.06 | 26d | 1 | 0.65mi |
| 1640 N Cameron St Casa Grande, AZ | 3.0 | 2.0 | 1577 | $3,250 | $2.06 | 25d | 1 | 0.65mi |
| 1640 N Cameron St Casa Grande, AZ | 3.0 | 2.0 | 1577 | $3,250 | $2.06 | 23d | 1 | 0.65mi |
| 920 E 4th St Casa Grande, AZ | 3.0 | 2.0 | 1073 | $1,295 | $1.21 | 5d | 1 | 0.71mi |
| 1161 E O'Neil Dr Casa Grande, AZ | 2.0–4.0 | 2.0 | 1144 | $1,498 | $1.31 | 0d | 13 | 0.90mi |
| 801 E 2nd St Casa Grande, AZ | 3.0 | 2.0 | 1200 | $1,650 | $1.38 | 26d | 1 | 0.91mi |
| 1775 N Terrace Cir Casa Grande, AZ | 3.0 | 2.0 | 1628 | $1,699 | $1.04 | 16d | 1 | 0.96mi |
| 1437 E 12th St Casa Grande, AZ | 3.0 | 2.5 | 1963 | $1,900 | $0.97 | 26d | 1 | 0.99mi |
| 1153 E Gabrilla Dr Casa Grande, AZ | 4.0 | 2.0 | 1689 | $1,795 | $1.06 | 21d | 1 | 1.00mi |
| 1013 E Doan St Casa Grande, AZ | 4.0 | 2.0 | 1120 | $1,700 | $1.52 | 26d | 1 | 1.02mi |
| 1467 E 12th St Casa Grande, AZ | 3.0 | 2.0 | 1604 | $1,725 | $1.08 | 26d | 1 | 1.04mi |
| 541 W Melrose Dr Casa Grande, AZ | 3.0 | 2.0 | 1101 | $1,600 | $1.45 | 26d | 1 | 1.15mi |
| 75 S Trekell Rd Casa Grande, AZ | 2.0–3.0 | 2.0 | 1035 | $1,750 | $1.69 | 0d | 18 | 1.17mi |
| 1251 E Jahns Dr Casa Grande, AZ | 4.0 | 2.0 | 1810 | $1,995 | $1.10 | 0d | 1 | 1.18mi |
| 344 N Pottebaum Rd Casa Grande, AZ | 2.0–3.0 | 2.0 | 1162 | $1,519 | $1.31 | 0d | 4 | 1.20mi |
| 1256 E Jahns Dr Casa Grande, AZ | 4.0 | 3.0 | 2094 | $2,199 | $1.05 | 7d | 1 | 1.21mi |
| 1846 N Princeton Ave Casa Grande, AZ | 4.0 | 2.0 | 1786 | $1,750 | $0.98 | 6d | 1 | 1.22mi |
| 1858 N Center Ave Casa Grande, AZ | 2.0 | 2.0 | 1146 | $1,500 | $1.31 | 26d | 1 | 1.30mi |
| 1926 N Avenida de Palmas Casa Grande, AZ | 2.0 | 2.0 | 1106 | $1,199 | $1.08 | 23d | 3 | 1.30mi |
| 1715 N Peart Rd Casa Grande, AZ | 2.0–4.0 | 1.0–2.0 | 1221 | $1,710 | $1.40 | 0d | 43 | 1.30mi |
| 351 N Peart Rd Casa Grande, AZ | 1.0–3.0 | 1.0–2.0 | 962 | $1,687 | $1.75 | 0d | 12 | 1.32mi |
| 1584 N Wood St Casa Grande, AZ | 4.0 | 2.0 | 1928 | $1,800 | $0.93 | 16d | 1 | 1.33mi |
| 1936 N Trekell Rd Casa Grande, AZ | 1.0–4.0 | 1.0–2.0 | 1033 | $1,723 | $1.67 | 0d | 31 | 1.40mi |
| 1979 N Vista Ln Casa Grande, AZ | 4.0 | 2.0 | 1636 | $2,200 | $1.34 | 26d | 1 | 1.47mi |
| 1565 N Wildflower Dr Casa Grande, AZ | 1.0–3.0 | 1.0–2.0 | 998 | $1,550 | $1.55 | 0d | 8 | 1.49mi |
HOA detail
- Monthly dues
- $100 · $1,200/yr
- Likely covers
- pool
Listing history 8 events
-
2026-06-21days on market $235,000 Active 11 DOM
-
2026-06-18days on market $235,000 Active 8 DOM
-
2026-06-17days on market $235,000 Active 7 DOM
-
2026-06-16days on market $235,000 Active 6 DOM
-
2026-06-15days on market $235,000 Active 5 DOM
-
2026-06-13days on market $235,000 Active 3 DOM
-
2026-06-13remarks 699-char remark
-
2026-06-13$235,000 Active 2 DOM
ⓘ Source: listings_history table (triggers on properties + properties_extension) + one-shot
backfill from property_details.listing_events for pre-trigger history.
Tax reassessment forecast AZ · Resets to sale price
- Current annual tax
- $541 · $45/mo
- Projected year-2 tax
- $1,551 · $129/mo
- Expected delta
- +$1,010/yr (+$84/mo · 186.7%)
ⓘ Screening estimate from a state-policy table — verify with the county assessor before closing.
Climate risk First Street
- Flood 1/10 Low FEMA zone X (unshaded) · 0% chance over 30 yrs
- Wildfire 6/10 Major
- Heat 9/10 Extreme 7 d/yr ≥113°F today · 19 d/yr by 30 yrs out
- Wind 1/10 Low
- Air quality 1/10 Low 0 unhealthy d/yr today · 0 by 30 yrs out
Nearby sold comps map
Loading sold comps map…
Walkable amenities ~0.75 mi
Loading nearby amenities…
Taxation est. · year 1
- Rental income
- $23,940
- − Mortgage interest
- −$13,164
- − Property taxes
- −$541
- − Insurance
- −$1,175
- − Repairs & maintenance
- −$1,915
- − Management
- −$1,915
- − HOA
- −$1,200
- − Depreciation
- −$6,836
- Taxable loss
- −$2,806
- Est. tax savings @ 24.0%
- +$673
- After-tax cash flow
- $1,882/yr
For passive investors: Depreciation is non-cash, so a rental often shows a tax loss while cash-flowing — sheltering income. Rental losses are passive: they offset passive income freely, and up to $25,000/yr can offset ordinary (W-2) income if you actively participate and your MAGI is under $100k (phasing out to $0 by $150k); unused losses carry forward. On sale, claimed depreciation is recaptured at up to 25%, and gains may owe capital-gains tax (a 1031 exchange can defer both). Figures are a year-1 estimate at your 24.0% rate — not tax advice; consult a CPA.
Schools (NCES district)
- District
- Casa Grande Union High School District (4453)
- NCES district ID
- 0401740
- Math proficiency
- 14% ▼ -15.00%
- Reading proficiency
- 21% ▼ -10.00%
- Median HH income
- $45,373
- Composite
- 15.38/100
- National rank
- #9319
- State rank
- #193 of 249 in AZ
Livability — Casa Grande
- Score
- 58/100
- State rank
- #220
- US rank
- #21534
Category grades
Schools grade is shown separately in the Schools card above.
Census & demographics
- Census place
- Casa Grande, AZ
- County
- Pinal County · 399,947 people
- City population
- 69,701
- Metro
- Phoenix-Mesa-Chandler, AZ
- Population (ZIP)
- 61,624
- Household income
- $68,443
- Rent vs Own
- Severe rent burden
- 1250.0
Population outlook (Pinal County) Hauer SSP2
- Today (2025)
- 437,574 people
- By 2030
- 446,903 · +2.1%
- By 2040
- 452,589 · +3.4%
- By 2050
- 444,126 · +1.5%
- By 2075
- 430,300 · -1.7%
- By 2100
- 393,536 · -10.1%
Race, ethnicity, and origin ACS 2023
- Neighborhood character
- Diverse neighborhood (Simpson 0.63)
- Race & ethnicity
- Hispanic / Latino 44% White 42% Two or more races 21% Black 4% Native American 4% Asian 1%
- Hispanic origin (detail)
- Mexican 40%
- Common ancestry
- Lithuanian 1% Slovak 1% Portuguese 1%
- Foreign-born
- 12% · Canada
- Languages at home
- 75% English-only · Spanish 23% Tagalog/Filipino 1% Other Indo-European 1%
Political lean MEDSL · Pinal
- 2024 margin
- Strong R (+22.1) · D 38.5% · R 60.6%
- 2008→2024 swing
- -7.6pp toward R · 2008: -14.5pp · 2024: -22.1pp
- All cycles
- 2024: R+22.1 2020: R+17.3 2016: R+19.3 2012: R+17.1 2008: R+14.5
Not yet ingested
- Civics
- —
Market trends
- HPI YoY
- ▼ -67.32%
- Current HPI
- 233.148
- Rent YoY
- ▲ 4.60%
- Metro
- Phoenix-Mesa-Chandler, AZ
- State GDP YoY
- ▲ 4.54%
- F500 in state
- 20
Industry mix (Fortune 500 HQ in AZ)
| Industry | F500 HQs | Revenue |
|---|---|---|
| Technology | 2 | $13B |
|
||
| Mining / Metals | 1 | $23B |
|
||
| Environmental Services | 1 | $16B |
|
||
| Metals / Steel | 1 | $14B |
|
||
| Technology Distribution | 1 | $9B |
|
||
| Homebuilding | 1 | $8B |
|
||
Price history
+224.1% since first listed50 events — show timeline
- 2026-06-10 Listed $235,000 ARMLS
- 2024-01-22 Listing Removed — ARMLS
- 2024-01-13 Price Changed $252,000 ARMLS
- 2023-12-21 Price Changed $259,999 ARMLS
- 2023-11-13 Price Changed $260,000 ARMLS
- 2023-10-18 Listed $264,999 ARMLS
- 2023-10-11 Listing Removed — ARMLS
- 2023-09-25 Price Changed $264,400 ARMLS
- 2023-07-21 Listed $269,900 ARMLS
- 2021-11-02 Sold (Public Records) $235,000 Public Records
- 2021-11-01 Sold (MLS) $235,000 ARMLS
- 2021-10-02 Contingent — ARMLS
- 2021-09-28 Listed $240,000 ARMLS
- 2011-12-19 Listing Removed — ARMLS
- 2011-12-16 Sold (Public Records) $67,900 Public Records
- 2011-12-16 Sold (MLS) $67,900 ARMLS
- 2011-12-10 Pending — ARMLS
- 2011-12-09 Sold (MLS) $67,900 ARMLS
- 2011-12-03 Pending — ARMLS
- 2011-11-23 Listed $67,900 ARMLS
- 2011-09-02 Sold (Public Records) $28,000 Public Records
- 2011-09-02 Sold (MLS) $28,000 ARMLS
- 2011-07-18 Contingent — ARMLS
- 2011-07-18 Listed $28,000 ARMLS
- 2011-07-15 Sold (MLS) $28,000 ARMLS
- 2011-04-30 Contingent — ARMLS
- 2011-04-29 Pending — ARMLS
- 2011-04-20 Contingent — ARMLS
- 2011-04-19 Relisted — ARMLS
- 2011-04-09 Contingent — ARMLS
- 2011-04-08 Price Changed $28,000 ARMLS
- 2011-04-07 Listed $49,000 ARMLS
- 2011-03-01 Sold (MLS) $28,000 ARMLS
- 2011-01-03 Pending — ARMLS
- 2010-12-01 Relisted — ARMLS
- 2010-10-22 Contingent — ARMLS
- 2010-10-18 Listed $49,000 ARMLS
- 2010-10-06 Listing Removed — ARMLS
- 2010-10-05 Listed $49,000 ARMLS
- 2010-06-18 Pending — ARMLS
- 2010-05-31 Price Changed $49,000 ARMLS
- 2010-04-07 Price Changed $55,000 ARMLS
- 2010-01-29 Listed $75,000 ARMLS
- 2007-04-02 Sold (Public Records) $145,000 Public Records
- 2005-03-24 Sold (Public Records) $86,000 Public Records
- 2005-03-24 Sold (MLS) $86,000 ARMLS
- 2005-02-15 Listing Removed — ARMLS
- 2004-09-01 Listed $83,000 ARMLS
- 1994-05-16 Sold (Public Records) $64,809 Public Records
- 1986-08-07 Sold (Public Records) $72,500 Public Records
Property tax history
-3.5%/yrLatest (2025): $541 · +7.3% YoY. Source: county tax records.
Cash-flow waterfall
monthlySold comps — $/sqft
last 12 mo · ≤1 miLoading sold comps…