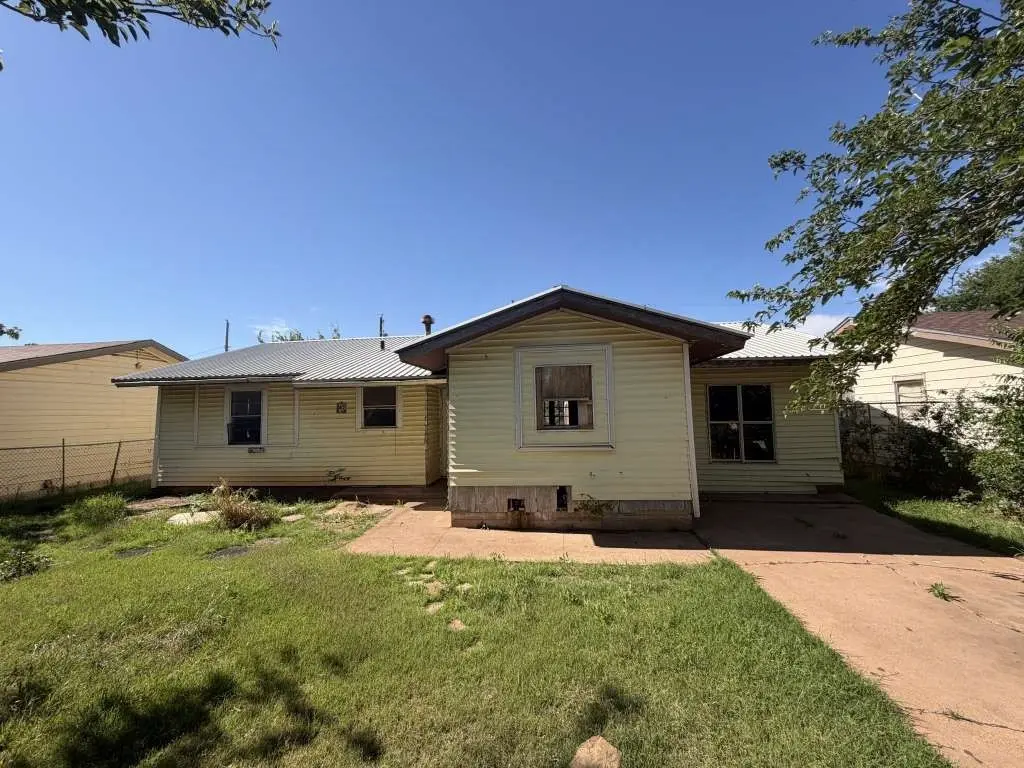
5517 Congress Ave · Abilene, TX
Flood risk 1/10 · Minimal
- FEMA flood zone
- X (unshaded)
- Chance of flooding over 30 yrs
- 0.0%
- Est. flood insurance / yr
- $507 – $1,088
Fire risk 8/10 · Major
- Est. fire insurance / yr
- $1,222 – $2,270
Heat risk 7/10 · Major
- Hot days now (above 104°F)
- 7 days/yr
- Hot days in 30 yrs
- 23 days/yr
Wind risk 4/10 · Minor
- Chance of severe wind over 30 yrs
- 13.0%
Air-quality risk 1/10 · Minimal
- Unhealthy air days now
- 0 days/yr
- Unhealthy air days in 30 yrs
- 0 days/yr
Risk factors via First Street. Map © Google.
Why this score? — see what drove the B grade
The composite is a weighted blend of 9 inputs, each scored 0–100. Each bar is that input's sub-score; the figure is the points it added to the 100-point composite (weight × sub-score).
- Cash flow +30.0/30.0
- 1% rule +10.0/10.0
- DSCR +10.0/10.0
- ARV discount +7.5/15.0
- Rent growth +5.0/5.0
- Livability +3.8/5.0
- Schools +2.8/10.0
- Condition / age +2.5/5.0
- Appreciation +0.0/10.0
$79,999
🖨 Deal sheet 📄 Offer letter ✓ Due diligence
Listing remarks
NEW LISTING! Welcome to 5517 Congress Ave in Abilene, TX, a well-located home offering comfort, functionality, and convenience. Situated in an established neighborhood, this property provides easy access to schools, shopping, dining, and major roadways, making daily living simple and stress-free. Whether you’re a first-time buyer, growing household, or investor looking for a solid opportunity, this property offers strong potential and value in a desirable Abilene location. WE MAKE IT EASY TO OWN. This is a great opportunity! Don't wait, call us today to get more information on the owner's easy terms and smooth process that may be able to put the deed in your name and make this your dr
Key facts
- 6,786 sq ft lot
- Built 1959
- Listed 20 days
Tags
Property features AI
Finance
- Financial info: Annual taxes listed for 2025
Exterior
- Utilities: Water and sewer utilities not specified; Power not specified
- Home design: Residential property; Built in 1959
- Construction: Construction materials: Unknown
- Exterior features: Lot includes other features
Interior
- Bathrooms: 1 full bathroom
- Interior features: Total of 3 rooms
Neighborhood map
What this means for you Summary
Snapshot
- This is a 3-bed/1.0-bath single-family listed at $80k.
Deal economics
- At list price, monthly cash flow is $1k ($14k/yr) — positive.
- The deal already cash-flows at list — no discount required.
- Meets the 1% rule at list price ($2k rent vs $80k).
- Recommended offer: $79k (1.5% below list) — sets the bar for market timing.
- Cap rate 23.5% vs local median 6.7% in Abilene — top-decile yield for the area; either an underpriced asset or a hidden risk that comps aren't pricing in. Stress-test before assuming the spread holds.
Location & tenants
- Location reads 75/100 on livability (#142 in TX, #4,037 nationally) — a middle-class / working-renter tenant base. Strengths: cost of living A+, housing A+, health & safety A+; Watch: crime D, commute F.
- Abilene ISD (urban): math 32% / reading 34% proficiency, ranked #575 of 826 in TX (top 70%) — families likely to look elsewhere, expect single-tenant / working-renter base with shorter leases.
- Zoned schools: Clack Middle (math 26% / reading 31%, grade F, #1,122 of 1,662 statewide, top 69%, 707 students, 73% FRL); Cooper H S (math 33% / reading 39%, grade F, #930 of 1,632 statewide, top 57%, 1,716 students, 64% FRL).
- Market conditions: Rents rising fast (+40.2%/yr); 86 active listings in the ZIP; 5 comparable units currently listed for rent nearby; rentals at typical pace (median 21d on market — plan ~3-4 weeks tenant-placement turnaround); 508 units permitted in Taylor County in 2024 (0 in 5+ unit buildings).
- At $2,332/mo this rent would consume 52% of the median local household income ($54k/yr) (locally 662% of renters already pay >50% of income on rent) — very limited rent-growth headroom before tenants either downsize or default.
Forward outlook
- Local home prices are declining (-3.0%/yr); year-one equity from $553 of loan paydown is wiped out by about $2k of value loss. Plan a longer hold.
- Taylor County population projected at +16% by 2050 — long-run rental-demand tailwind backs the buy-and-hold thesis.
- At projected returns (-3.0% appreciation + 8.0% rent growth), your $22k cash investment doubles in ~2 years — after that, you're playing with house money.
Negotiation context
- It's been on market 20 days — a 2% lower offer ($79k) is reasonable based on typical stale-listing flexibility.
Risks & watch-outs
- Watch-outs: property tax is 3.6% of price; built in 1959 — expect roof / HVAC / electrical / plumbing capex.
- Climate carrying-cost: severe wildfire risk; extreme-heat days projected 7→23/yr by 2055 (HVAC capex compounding) — expect insurance premiums to compound above CPI over the hold.
Questions for the listing agent
- Built in 1959 — when were the roof, HVAC, electrical panel, plumbing, and water heater last replaced?
- Property tax is high relative to price — has the assessment been appealed recently, and will the sale trigger a re-assessment?
- Is there a deadline driving the sale (1031 exchange, divorce, estate, relocation)? That informs how much negotiation room exists.
- Schools are D-rated, which usually means shorter tenancies and higher turnover. Who's the typical renter profile here, and what's been the actual vacancy rate?
- Crime grade is D in this area — have there been break-ins, vandalism, or insurance claims at this property in the last 3 years? What carrier currently insures it and at what premium?
- What's the average days-on-market for RENTAL listings here right now (not sales)? A rising rental-DOM trend means longer vacancies and softer asking-rent achievability than the comps imply.
- What's the recent tenant-quality profile in this submarket — average credit score on applications, eviction rate, late-payment / NSF rate, and stable-employment percentage? A property-management company in the area should have these aggregated.
- How much new for-sale + rental construction is in the pipeline within 1–3 miles? Heavy new supply typically softens prices + rents 12–24 months out; constrained supply supports both.
Investment metrics
- 1% rule
- 2.91% ✓
- Cap rate
- 23.51%
- Cash-on-cash
- 61.48%
- DSCR
- 3.74
- GRM
- 2.9
CMA / ARV
- ARV (on-the-fly)
- $203,786
- Comps found
- 12
Show comp detail 12 sales within ~0.75 mi
| Address | Dist | Beds/Ba | Sqft | Sold | Price | $/sf | Match |
|---|---|---|---|---|---|---|---|
| 5509 N 10th St | 0.12mi | 3/2.0 | 1,280 (-1%) | 3mo | $203,000 | $159 | 86 |
| 5501 N 10th St | 0.13mi | 3/2.0 | 1,280 (-1%) | 3mo | $203,000 | $159 | 86 |
| 5449 N 10th St | 0.13mi | 3/2.0 | 1,280 (-1%) | 4mo | $203,000 | $159 | 84 |
| 5457 N 10th St | 0.13mi | 3/2.0 | 1,270 (-2%) | 3mo | $203,000 | $160 | 84 |
| 5517 N 10th | 0.12mi | 3/2.0 | 1,280 (-1%) | 6mo | $199,999 | $156 | 83 |
| 5525 N 10th | 0.12mi | 3/2.0 | 1,270 (-2%) | 7mo | $199,900 | $157 | 82 |
| 5301 North 10th St | 0.24mi | 3/2.0 | 1,270 (-2%) | 0mo | $203,000 | $160 | 81 |
| 5433 N 10th St | 0.14mi | 3/2.0 | 1,270 (-2%) | 8mo | $199,900 | $157 | 80 |
| 5441 N 10th St | 0.13mi | 3/2.0 | 1,270 (-2%) | 8mo | $199,900 | $157 | 79 |
| 5208 Aztec Dr | 0.73mi | 3/2.0 | 1,300 (+0%) | 0mo | $189,000 | $145 | 62 |
| 933 N Danville Dr | 0.54mi | 4/1.0 (+1) | 1,258 (-3%) | 7mo | $179,900 | $143 | 59 |
| 409 N Bowie Dr | 0.68mi | 3/1.0 | 1,128 (-13%) | 3mo | $169,900 | $151 | 44 |
Match score weights: distance 35% · size 25% · config 20% · recency 20%. Top-matched comps best support the ARV.
Projected returns pro-forma
-3.0% appreciation · 8.0% rent growth · sell at horizon
- IRR
- 66.4%
- Equity multiple
- 4.24×
- Total profit
- $72,578
- Equity at exit
- $11,928
- IRR
- 72.4%
- Equity multiple
- 10.55×
- Total profit
- $213,903
- Equity at exit
- $6,917
Cash invested: $22,400 (down + closing). Projections, not guarantees.
Landlord ↔ Tenant lean methodology
- Overall (STATE)
- 87 Strongly Landlord-Friendly
- State Texas
- 87 Strongly Landlord-Friendly · R+5
- County
- — inherits STATE
- City
- — inherits STATE
ZIP-level market 79603
- Home prices YoY
- -32.5%
- Rents YoY
- 40.2%
- Active inventory
- 86
- Price-to-rent
- 2.9×
Monthly cashflow live
- Estimated rent
- $2,332 high interval (Pro) →
- Mortgage (P&I)
- −$420
- Tax from tax record
- −$242 /mo · $2,898/yr
- Insurance
- −$33
- HOA
- −$0
- Vacancy / Maint / Mgmt
- −$490
- Net cashflow
- $1,148
Break-even live
UW: 25.0% down · 7.5% · 30yr · 1.5% tax · 5.0% vac · 8.0% maint · 8.0% mgmt
Financing live
Cash to close
- Down payment
- $20,000
- Closing costs
- $2,400
- Reserves months
- —
- Total cash needed
- —
Loan-product check · same deal, 3 products live
Conventional
25% down · 7.5% · 30yr
- Down + closing
- —
- Monthly P&I
- —
- Monthly cashflow
- —
- DSCR
- —
- Eligible?
- —
Personal DTI + credit; lowest rate.
DSCR
20% down · 8.5% · 30yr
- Down + closing
- —
- Monthly P&I
- —
- Monthly cashflow
- —
- DSCR
- —
- Eligible?
- —
No personal income docs; deal must DSCR.
Hard money
10% down · 12.0% · 12mo
- Down + closing
- —
- Monthly P&I
- —
- Monthly cashflow
- —
- DSCR
- —
- Eligible?
- —
Short-term bridge; refi at stabilization.
Rent comps 5 comps
| Address | Beds | Baths | Sqft | Rent | $/sqft | DOM | Units | Dist |
|---|---|---|---|---|---|---|---|---|
| 5441 N 10th St Abilene, TX | 3.0 | 2.0 | 1270 | $2,500 | $1.97 | 13d | 1 | 0.14mi |
| 728 Redbird Ln Abilene, TX | 2.0 | 1.5 | 994 | $1,695 | $1.71 | 13d | 1 | 1.27mi |
| 438 Benjamin Ln Abilene, TX | 3.0 | 2.0 | 1216 | $2,299 | $1.89 | 21d | 1 | 1.30mi |
| 402 Arnold Blvd Abilene, TX | 3.0 | 2.0 | 1216 | $2,299 | $1.89 | 21d | 1 | 1.31mi |
| 841 S San Jose Dr Abilene, TX | 2.0 | 1.0 | 1122 | $3,000 | $2.67 | 21d | 1 | 1.42mi |
Listing history 14 events
-
2026-06-15status $79,999 Pending 20 DOM
-
2026-06-15days on market $79,999 Active 20 DOM
-
2026-06-14days on market $79,999 Active 18 DOM
-
2026-06-13days on market $79,999 Active 17 DOM
-
2026-06-10days on market $79,999 Active 15 DOM
-
2026-06-09days on market $79,999 Active 14 DOM
-
2026-06-08days on market $79,999 Active 13 DOM
-
2026-06-07days on market $79,999 Active 12 DOM
-
2026-06-03days on market $79,999 Active 8 DOM
-
2026-06-02days on market $79,999 Active 7 DOM
-
2026-06-01days on market $79,999 Active 6 DOM
-
2026-05-31days on market $79,999 Active 5 DOM
-
2026-05-30days on market $79,999 Active 4 DOM
-
2026-05-26$79,999 Active
ⓘ Source: listings_history table (triggers on properties + properties_extension) + one-shot
backfill from property_details.listing_events for pre-trigger history.
Tax reassessment forecast TX · Resets to sale price
- Current annual tax
- $2,898 · $242/mo
- Projected year-2 tax
- $2,898 · $242/mo
- Expected delta
- $0/yr ($0/mo · 0.0%)
ⓘ Screening estimate from a state-policy table — verify with the county assessor before closing.
Climate risk First Street
- Flood 1/10 Low FEMA zone X (unshaded) · 0% chance over 30 yrs
- Wildfire 8/10 Severe
- Heat 7/10 Severe 7 d/yr ≥104°F today · 23 d/yr by 30 yrs out
- Wind 4/10 Moderate 13% chance of damaging wind over 30 yrs
- Air quality 1/10 Low 0 unhealthy d/yr today · 0 by 30 yrs out
Nearby sold comps map
Loading sold comps map…
Walkable amenities ~0.75 mi
Loading nearby amenities…
Taxation est. · year 1
- Rental income
- $27,980
- − Mortgage interest
- −$4,481
- − Property taxes
- −$2,898
- − Insurance
- −$400
- − Repairs & maintenance
- −$2,238
- − Management
- −$2,238
- − Depreciation
- −$2,327
- Taxable income
- $13,397
- Est. tax owed @ 24.0%
- −$3,215
- After-tax cash flow
- $10,557/yr
For passive investors: Depreciation is non-cash, so a rental often shows a tax loss while cash-flowing — sheltering income. Rental losses are passive: they offset passive income freely, and up to $25,000/yr can offset ordinary (W-2) income if you actively participate and your MAGI is under $100k (phasing out to $0 by $150k); unused losses carry forward. On sale, claimed depreciation is recaptured at up to 25%, and gains may owe capital-gains tax (a 1031 exchange can defer both). Figures are a year-1 estimate at your 24.0% rate — not tax advice; consult a CPA.
Schools (NCES district)
- District
- Abilene ISD
- NCES district ID
- 4807440
- Math proficiency
- 32% ▼ -11.00%
- Reading proficiency
- 34% ▼ -5.00%
- Median HH income
- $39,782
- Composite
- 27.71/100
- National rank
- #6909
- State rank
- #575 of 826 in TX
Livability — Abilene
- Score
- 75/100
- State rank
- #142
- US rank
- #4037
Category grades
Schools grade is shown separately in the Schools card above.
Census & demographics
- Census place
- Abilene, TX
- County
- Taylor County · 136,672 people
- City population
- 136,672
- Metro
- Abilene, TX
- Population (ZIP)
- 23,548
- Household income
- $53,513
- Rent vs Own
- Severe rent burden
- 662.0
Population outlook (Taylor County) Hauer SSP2
- Today (2025)
- 145,270 people
- By 2030
- 150,050 · +3.3%
- By 2040
- 159,417 · +9.7%
- By 2050
- 168,883 · +16.3%
- By 2075
- 194,436 · +33.8%
- By 2100
- 203,163 · +39.9%
Race, ethnicity, and origin ACS 2023
- Neighborhood character
- Diverse neighborhood (Simpson 0.60)
- Race & ethnicity
- Hispanic / Latino 48% White 40% Two or more races 24% Black 8%
- Hispanic origin (detail)
- Mexican 44%
- Common ancestry
- Italian 2% Slovak 2% Portuguese 1%
- Foreign-born
- 9% · Canada
- Languages at home
- 73% English-only · Spanish 25%
Political lean MEDSL · Taylor
- 2024 margin
- Solid R (+49.8) · D 24.6% · R 74.4% · Other 1.0%
- 2008→2024 swing
- -4.2pp toward R · 2008: -45.6pp · 2024: -49.8pp
- All cycles
- 2024: R+49.8 2020: R+45.3 2016: R+51.1 2012: R+53.6 2008: R+45.6
Not yet ingested
- Civics
- —
Market trends
- HPI YoY
- ▼ -88.84%
- Current HPI
- 184.8875
- Rent YoY
- ▲ 40.19%
- Metro
- Abilene, TX
- State GDP YoY
- ▲ 3.95%
- F500 in state
- 110
Industry mix (Fortune 500 HQ in TX)
| Industry | F500 HQs | Revenue |
|---|---|---|
| Energy | 16 | $1,198B |
|
||
| Technology | 5 | $198B |
|
||
| Engineering / Construction | 4 | $72B |
|
||
| Energy Services | 3 | $60B |
|
||
| Utilities | 3 | $41B |
|
||
| Healthcare | 2 | $330B |
|
||
Price history
1 event — show timeline
- 2026-05-26 Listed $79,999 HARMLS
Property tax history
+18.5%/yrLatest (2025): $2,898 · +39.7% YoY. Source: county tax records.
Cash-flow waterfall
monthlySold comps — $/sqft
last 12 mo · ≤1 miLoading sold comps…