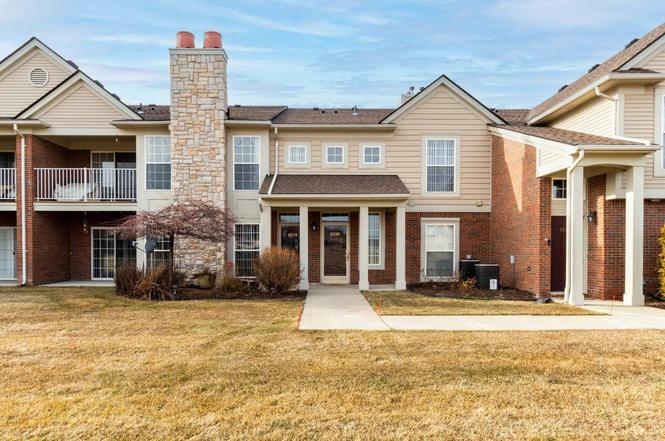
52196 Naugatuck Dr · Macomb, MI
Flood risk 1/10 · Minimal
- FEMA flood zone
- X (unshaded)
- Chance of flooding over 30 yrs
- 0.0%
- Est. flood insurance / yr
- $473 – $860
Fire risk 1/10 · Minimal
- Est. fire insurance / yr
- $784 – $1,456
Heat risk 3/10 · Minor
- Hot days now (above 96°F)
- 7 days/yr
- Hot days in 30 yrs
- 15 days/yr
Wind risk 1/10 · Minimal
- Chance of severe wind over 30 yrs
- —
Air-quality risk 3/10 · Minor
- Unhealthy air days now
- 3 days/yr
- Unhealthy air days in 30 yrs
- 5 days/yr
Risk factors via First Street. Map © Google.
Why this score? — see what drove the D+ grade
The composite is a weighted blend of 9 inputs, each scored 0–100. Each bar is that input's sub-score; the figure is the points it added to the 100-point composite (weight × sub-score).
- Cash flow +17.8/30.0
- ARV discount +7.5/15.0
- 1% rule +6.5/10.0
- DSCR +5.6/10.0
- Schools +2.9/10.0
- Rent growth +2.5/5.0
- Livability +2.5/5.0
- Condition / age +2.5/5.0
- Appreciation +0.0/10.0
$229,900
🖨 Deal sheet 📄 Offer letter ✓ Due diligence
Listing remarks MLS
Welcome home to this stylishly updated upper flat offering a blend of comfort, convenience, and modern appeal. Step into the spacious great room with vaulted ceilings and a cozy gas fireplace, perfect for relaxing nights in or hosting friends. The private primary suite includes its own full ensuite bath, while the back deck provides a quiet space to enjoy the outdoors. An attached garage adds everyday convenience, and the community amenities include a clubhouse with fitness center, inground pool and jacuzzi. All of this in a great location close to shopping and dining. New water heater was added in 2025!
Key facts
- Fitness center
- Clubhouse
- Attached garage
Tags
Neighborhood map
What this means for you Summary
Snapshot
- This is a 2-bed/2.0-bath condo listed at $230k.
Deal economics
- At list price, monthly cash flow is $190 ($2k/yr) — positive.
- The deal already cash-flows at list — no discount required.
- Meets the 1% rule at list price ($3k rent vs $230k).
- Recommended offer: $216k (6.0% below list) — sets the bar for market timing.
Location & tenants
- Location reads: area grade D — affects rentability + tenant quality, not the cash-flow math above.
- New Haven Community Schools (suburban): math 25% / reading 39% proficiency, ranked #305 of 540 in MI (top 56%) — families likely to look elsewhere, expect single-tenant / working-renter base with shorter leases.
- Market conditions: 334 active listings in the ZIP; 1 comparable units currently listed for rent nearby; 1,321 units permitted in Macomb County in 2024 (86 in 5+ unit buildings).
Forward outlook
- Local home prices are declining (-3.0%/yr); year-one equity from $2k of loan paydown is wiped out by about $7k of value loss. Plan a longer hold.
- Macomb County population projected at +9% by 2050 — modest demand growth; plan on rents tracking national, not racing it.
Negotiation context
- It's been on market 89 days — a 6% lower offer ($216k) is reasonable based on typical stale-listing flexibility.
- 10 sale attempts since 15y ago with the ask held roughly flat each time — persistent listings suggest the price (not the market) is what's stuck; bring a comps-based counter.
Questions for the listing agent
- It's been on market 89 days. Have you received any prior offers? Is the seller open to a 6% concession, seller financing, or rate buy-down credit?
- What does the HOA fee cover, when was the last increase, and are there any pending special assessments or reserve-fund shortfalls?
- Any open or pending special assessments — roof, HVAC, plumbing, elevator, façade? What's the per-unit balance and payoff schedule, and is the seller paying it off at close or rolling it to the buyer?
- Why hasn't it sold? Are there any deal-killer items the seller is aware of (foundation, flood, title, zoning, code violations)?
- Is there a deadline driving the sale (1031 exchange, divorce, estate, relocation)? That informs how much negotiation room exists.
- The area grade is low — what's the realistic commute time and amenity access for the typical tenant pool here? Any planned neighborhood developments (good or bad) we should know about?
- What's the average days-on-market for RENTAL listings here right now (not sales)? A rising rental-DOM trend means longer vacancies and softer asking-rent achievability than the comps imply.
- What's the recent tenant-quality profile in this submarket — average credit score on applications, eviction rate, late-payment / NSF rate, and stable-employment percentage? A property-management company in the area should have these aggregated.
- How much new apartment / multifamily construction is in the pipeline within 1–3 miles? Heavy new supply (>2% of stock underway) typically softens rents 12–24 months out; light construction supports rent growth.
Investment metrics
- 1% rule
- 1.15% ✓
- Cap rate
- 7.28%
- Cash-on-cash
- 3.54%
- DSCR
- 1.16
- GRM
- 7.2
CMA / ARV
No comps found within radius.
Projected returns pro-forma
-3.0% appreciation · 3.0% rent growth · sell at horizon
- IRR
- -10.6%
- Equity multiple
- 0.61×
- Total profit
- $-24,937
- Equity at exit
- $34,279
- IRR
- -1.2%
- Equity multiple
- 0.92×
- Total profit
- $-5,207
- Equity at exit
- $19,878
Cash invested: $64,372 (down + closing). Projections, not guarantees.
Landlord ↔ Tenant lean methodology
- Overall (STATE)
- 62 Landlord-Friendly
- State Michigan
- 62 Landlord-Friendly · EVEN
- County
- — inherits STATE
- City
- — inherits STATE
ZIP-level market 48042
- Home prices YoY
- -28.4%
- Active inventory
- 334
- Price-to-rent
- 7.2×
Monthly cashflow live
- Estimated rent
- $2,650 medium interval (Pro) →
- Mortgage (P&I)
- −$1,206
- Tax est. 1.5%
- −$287 /mo · $3,448/yr
- Insurance
- −$96
- HOA
- −$315
- Vacancy / Maint / Mgmt
- −$556
- Net cashflow
- $190
Break-even live
UW: 25.0% down · 7.5% · 30yr · 1.5% tax · 5.0% vac · 8.0% maint · 8.0% mgmt
Financing live
Cash to close
- Down payment
- $57,475
- Closing costs
- $6,897
- Reserves months
- —
- Total cash needed
- —
Loan-product check · same deal, 3 products live
Conventional
25% down · 7.5% · 30yr
- Down + closing
- —
- Monthly P&I
- —
- Monthly cashflow
- —
- DSCR
- —
- Eligible?
- —
Personal DTI + credit; lowest rate.
DSCR
20% down · 8.5% · 30yr
- Down + closing
- —
- Monthly P&I
- —
- Monthly cashflow
- —
- DSCR
- —
- Eligible?
- —
No personal income docs; deal must DSCR.
Hard money
10% down · 12.0% · 12mo
- Down + closing
- —
- Monthly P&I
- —
- Monthly cashflow
- —
- DSCR
- —
- Eligible?
- —
Short-term bridge; refi at stabilization.
Rent comps 1 comps
| Address | Beds | Baths | Sqft | Rent | $/sqft | DOM | Units | Dist |
|---|---|---|---|---|---|---|---|---|
| 21391 Marina Cir Unit 1 Macomb, MI | 3.0 | 2.5 | 1953 | $2,650 | $1.36 | 44d | 1 | 1.01mi |
HOA detail condo
- Monthly dues
- $315 · $3,780/yr
- Likely covers
- watergaspoolgym
- Assessments
- None detected in remarks — confirm with the listing agent.
Listing history 36 events
-
2026-06-19status $229,900 Pending 89 DOM
-
2026-06-18days on market $229,900 Active 89 DOM
-
2026-06-17days on market $229,900 Active 88 DOM
-
2026-06-16days on market $229,900 Active 87 DOM
-
2026-06-15days on market $229,900 Active 86 DOM
-
2026-06-13days on market $229,900 Active 84 DOM
-
2026-06-09days on market $229,900 Active 80 DOM
-
2026-06-08days on market $229,900 Active 79 DOM
-
2026-06-07statusdays on market $229,900 Active 78 DOM
-
2026-03-24status Pending
Show marketing remark (611 chars)
Welcome home to this stylishly updated upper flat offering a blend of comfort, convenience, and modern appeal. Step into the spacious great room with vaulted ceilings and a cozy gas fireplace, perfect for relaxing nights in or hosting friends. The private primary suite includes its own full ensuite bath, while the back deck provides a quiet space to enjoy the outdoors. An attached garage adds everyday convenience, and the community amenities include a clubhouse with fitness center, inground pool and jacuzzi. All of this in a great location close to shopping and dining. New water heater was added in 2025!
-
2026-03-24status Pending 611-char remark
Show marketing remark (611 chars)
Welcome home to this stylishly updated upper flat offering a blend of comfort, convenience, and modern appeal. Step into the spacious great room with vaulted ceilings and a cozy gas fireplace, perfect for relaxing nights in or hosting friends. The private primary suite includes its own full ensuite bath, while the back deck provides a quiet space to enjoy the outdoors. An attached garage adds everyday convenience, and the community amenities include a clubhouse with fitness center, inground pool and jacuzzi. All of this in a great location close to shopping and dining. New water heater was added in 2025!
-
2026-01-06$229,900 Active
Show marketing remark (611 chars)
Welcome home to this stylishly updated upper flat offering a blend of comfort, convenience, and modern appeal. Step into the spacious great room with vaulted ceilings and a cozy gas fireplace, perfect for relaxing nights in or hosting friends. The private primary suite includes its own full ensuite bath, while the back deck provides a quiet space to enjoy the outdoors. An attached garage adds everyday convenience, and the community amenities include a clubhouse with fitness center, inground pool and jacuzzi. All of this in a great location close to shopping and dining. New water heater was added in 2025!
-
2026-01-06$229,900 Active 611-char remark
Show marketing remark (611 chars)
Welcome home to this stylishly updated upper flat offering a blend of comfort, convenience, and modern appeal. Step into the spacious great room with vaulted ceilings and a cozy gas fireplace, perfect for relaxing nights in or hosting friends. The private primary suite includes its own full ensuite bath, while the back deck provides a quiet space to enjoy the outdoors. An attached garage adds everyday convenience, and the community amenities include a clubhouse with fitness center, inground pool and jacuzzi. All of this in a great location close to shopping and dining. New water heater was added in 2025!
-
2025-12-11historical
-
2025-10-31$229,900 Active
-
2025-10-31$229,900 Active
-
2025-10-29historical
-
2022-03-08soldstatus $210,000 Sold
-
2022-03-08soldstatus $210,000 Closed
-
2022-02-10status Pending
-
2022-02-10status Pending
-
2022-02-05$210,000 Active
-
2022-02-05$210,000 Active
-
2022-02-02historical $210,000
-
2022-02-02historical $210,000
-
2015-03-18soldstatus $136,500 Sold
-
2015-03-18soldstatus $136,500
-
2015-02-25historical
-
2015-02-24historical
-
2014-12-06$144,900 Active
-
2014-12-06$144,900
-
2011-09-07soldstatus $72,500
-
2011-09-07soldstatus $72,500
-
2011-08-02historical
-
2011-05-16$74,900
-
2011-05-16$74,900
ⓘ Source: listings_history table (triggers on properties + properties_extension) + one-shot
backfill from property_details.listing_events for pre-trigger history.
Climate risk First Street
- Flood 1/10 Low FEMA zone X (unshaded) · 0% chance over 30 yrs
- Wildfire 1/10 Low
- Heat 3/10 Moderate 7 d/yr ≥96°F today · 15 d/yr by 30 yrs out
- Wind 1/10 Low
- Air quality 3/10 Moderate 3 unhealthy d/yr today · 5 by 30 yrs out
Nearby sold comps map
Loading sold comps map…
Walkable amenities ~0.75 mi
Loading nearby amenities…
Taxation est. · year 1
- Rental income
- $31,800
- − Mortgage interest
- −$12,878
- − Property taxes
- −$3,448
- − Insurance
- −$1,150
- − Repairs & maintenance
- −$2,544
- − Management
- −$2,544
- − HOA
- −$3,780
- − Depreciation
- −$6,688
- Taxable loss
- −$1,232
- Est. tax savings @ 24.0%
- +$296
- After-tax cash flow
- $2,572/yr
For passive investors: Depreciation is non-cash, so a rental often shows a tax loss while cash-flowing — sheltering income. Rental losses are passive: they offset passive income freely, and up to $25,000/yr can offset ordinary (W-2) income if you actively participate and your MAGI is under $100k (phasing out to $0 by $150k); unused losses carry forward. On sale, claimed depreciation is recaptured at up to 25%, and gains may owe capital-gains tax (a 1031 exchange can defer both). Figures are a year-1 estimate at your 24.0% rate — not tax advice; consult a CPA.
Schools (NCES district)
- District
- New Haven Community Schools
- NCES district ID
- 2625230
- Math proficiency
- 25% ▼ -5.00%
- Reading proficiency
- 39% ▼ -5.00%
- Median HH income
- $64,247
- Composite
- 29.17/100
- National rank
- #6575
- State rank
- #305 of 540 in MI
Livability — Macomb
No livability data for this city. (Only ~50 U.S. cities are tracked.)
Census & demographics
- City population
- 58,754
- Population (ZIP)
- 33,303
Population outlook (Macomb County) Hauer SSP2
- Today (2025)
- 925,296 people
- By 2030
- 948,226 · +2.5%
- By 2040
- 983,961 · +6.3%
- By 2050
- 1,010,200 · +9.2%
- By 2075
- 1,076,222 · +16.3%
- By 2100
- 1,077,065 · +16.4%
Race, ethnicity, and origin ACS 2023
- Neighborhood character
- Predominantly White (93%)
- Race & ethnicity
- White 93% Two or more races 3% Asian 2% Hispanic / Latino 2% Black 1%
- Common ancestry
- Romanian 19% English 2% Lithuanian 2%
- Foreign-born
- 8% · Canada, China
- Languages at home
- 84% English-only · Other Indo-European 7% Russian/Polish/Slavic 3% Arabic 2%
Political lean MEDSL · Macomb
- 2024 margin
- R (+13.7) · D 42.2% · R 55.9% · Other 1.9%
- 2008→2024 swing
- -22.3pp toward R · 2008: 8.6pp · 2024: -13.7pp
- All cycles
- 2024: R+13.7 2020: R+8.1 2016: R+11.6 2012: D+4.0 2008: D+8.6
Not yet ingested
- Civics
- —
Market trends
- HPI YoY
- ▼ -87.07%
- Current HPI
- 219.778
- Rent YoY
- —
- Metro
- —
- State GDP YoY
- ▲ 1.37%
- F500 in state
- 28
Industry mix (Fortune 500 HQ in MI)
| Industry | F500 HQs | Revenue |
|---|---|---|
| Automotive Parts | 3 | $48B |
|
||
| Automotive | 2 | $372B |
|
||
| Chemicals | 1 | $45B |
|
||
| Automotive Retail | 1 | $29B |
|
||
| Healthcare / Medical Devices | 1 | $23B |
|
||
| Automotive Technology | 1 | $20B |
|
||
Price history
+206.9% since first listed27 events — show timeline
- 2026-03-24 Pending — REALCOMP
- 2026-03-24 Pending — MiRealSource-MiMLS
- 2026-01-06 Listed $229,900 MiRealSource-MiMLS
- 2026-01-06 Listed $229,900 REALCOMP
- 2025-12-11 Listing Removed — MiRealSource-MiMLS
- 2025-10-31 Listed $229,900 REALCOMP
- 2025-10-31 Listed $229,900 MiRealSource-MiMLS
- 2025-10-29 Coming Soon — MiRealSource-MiMLS
- 2022-03-08 Sold (MLS) $210,000 MiRealSource-MiMLS
- 2022-03-08 Sold (MLS) $210,000 REALCOMP
- 2022-02-10 Pending — REALCOMP
- 2022-02-10 Pending — MiRealSource-MiMLS
- 2022-02-05 Listed $210,000 MiRealSource-MiMLS
- 2022-02-05 Listed $210,000 REALCOMP
- 2022-02-02 Coming Soon $210,000 MiRealSource-MiMLS
- 2022-02-02 Coming Soon $210,000 REALCOMP
- 2015-03-18 Sold (MLS) $136,500 MiRealSource-MiMLS
- 2015-03-18 Sold (MLS) $136,500 REALCOMP
- 2015-02-25 Listing Removed — REALCOMP
- 2015-02-24 Listing Removed — MiRealSource-MiMLS
- 2014-12-06 Listed $144,900 REALCOMP
- 2014-12-06 Listed $144,900 MiRealSource-MiMLS
- 2011-09-07 Sold (MLS) $72,500 REALCOMP
- 2011-09-07 Sold (MLS) $72,500 MiRealSource-MiMLS
- 2011-08-02 Listing Removed — MiRealSource-MiMLS
- 2011-05-16 Listed $74,900 REALCOMP
- 2011-05-16 Listed $74,900 MiRealSource-MiMLS
Cash-flow waterfall
monthlySold comps — $/sqft
last 12 mo · ≤1 miLoading sold comps…