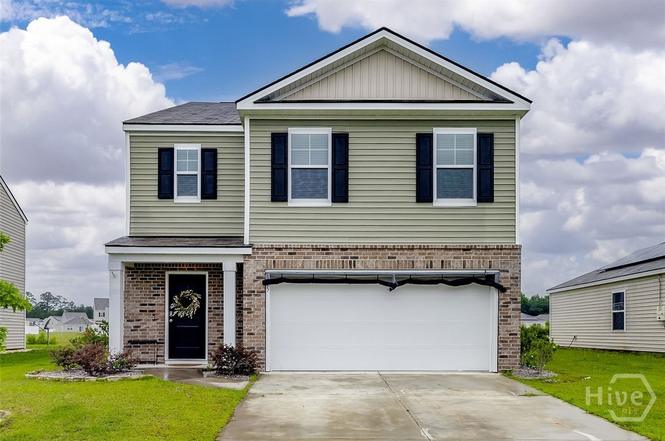
105 Tobago Cir · Guyton, GA
Flood risk 1/10 · Minimal
- FEMA flood zone
- X (unshaded)
- Chance of flooding over 30 yrs
- 0.0%
- Est. flood insurance / yr
- $507 – $1,088
Fire risk 4/10 · Minor
- Est. fire insurance / yr
- $963 – $1,789
Heat risk 8/10 · Major
- Hot days now (above 108°F)
- 7 days/yr
- Hot days in 30 yrs
- 17 days/yr
Wind risk 8/10 · Major
- Chance of severe wind over 30 yrs
- 96.0%
Air-quality risk 2/10 · Minimal
- Unhealthy air days now
- 2 days/yr
- Unhealthy air days in 30 yrs
- 2 days/yr
Risk factors via First Street. Map © Google.
Why this score? — see what drove the D+ grade
The composite is a weighted blend of 9 inputs, each scored 0–100. Each bar is that input's sub-score; the figure is the points it added to the 100-point composite (weight × sub-score).
- Cash flow +13.0/30.0
- ARV discount +12.0/15.0
- Schools +4.3/10.0
- DSCR +3.9/10.0
- 1% rule +3.8/10.0
- Livability +3.5/5.0
- Rent growth +2.5/5.0
- Condition / age +2.5/5.0
- Appreciation +0.0/10.0
$329,900
🖨 Deal sheet (PDF) 📄 Offer letter ✓ Due diligence
Listing remarks MLS
* VIRTUAL APPOINTMENT AVAILABLE * * UNDER CONSTRUCTION SUMMER COMPLETION! * The "Radiant" Robie Plan by D. R. Horton 5 beds 3 baths. Vinyl flooring throughout the common areas. Large open kitchen features granite, counter height island, loads of cabinet space, walk-in pantry and all stainless steel appliances, including the fridge! First floor features a bedroom and full bath. Primary bedroom, located on the 2nd floor, has a walk-in closet and the primary bath offers dual sink vanity, 5 ft walk in shower with glass door and separate water closet. Hall bath upstairs also offers dual sink vanity. Includes 2" faux wood blinds in all standard windows and a fully sodded yard with irrigation. Includes a smart home system. Located in the Beautiful Park West Community, 5 miles away from HWY 21! Amenities include Tennis Courts, Pool, and Large Clubhouse! * Pictures, photographs, colors, features, and sizes are for illustration purposes only and will vary from the homes as built *
Key facts
- Fitness facility
- Clubhouse
- Fenced yard
Tags
Property features AI
Finance
- Other: Planned Development (PD) zoning
- HOA & community: Homeowners association with quarterly fee (approximately $191 per quarter)
Exterior
- Parking: Attached 2-car garage with garage door opener
- Utilities: Public water; Public sewer; Underground utilities
- Home design: Single-family residence; 2-story
- Construction: Vinyl siding; Asphalt roof
- Exterior features: Vinyl fencing / fenced yard; Lagoon waterfront; Property has a view; Underground utilities
Interior
- Bathrooms: 3 full bathrooms
- Heating & cooling: Central electric heating; Central electric cooling
- Interior features: Double pane windows; Electric water heater
- Laundry & utility: Dedicated laundry room
Neighborhood map
What this means for you Summary
Snapshot
- This is a 5-bed/3.0-bath single-family listed at $330k.
Deal economics
- At list price, monthly cash flow is $-16 ($-195/yr) — negative.
- To cash-flow at today's rent, offer at most $327k (0.9% below list).
- To meet the 1% rule (rent ≥ 1% of price), the offer needs to be $290k (12.1% below list).
- Recommended offer: $290k (12.1% below list) — sets the bar for 1% rule.
- Cap rate 6.2% vs local median 4.6% in Guyton — top-decile yield for the area; either an underpriced asset or a hidden risk that comps aren't pricing in. Stress-test before assuming the spread holds.
Location & tenants
- Location reads 69/100 on livability (#128 in GA) — a middle-class / working-renter tenant base. Strengths: crime A+, cost of living A+, housing A+; Watch: amenities F, commute F, health & safety F.
- Effingham County (rural): math 49% / reading 48% proficiency, ranked #16 of 174 in GA (top 9%) — families likely to look elsewhere, expect single-tenant / working-renter base with shorter leases.
- Zoned schools: Marlow Elementary School (math 63% / reading 50%, grade C+, #159 of 1,228 statewide, top 13%, 775 students, 31% FRL); South Effingham Middle School (math 51% / reading 58%, grade B-, #52 of 470 statewide, top 11%, 1,097 students, 32% FRL); South Effingham High School (math 33% / reading 27%, grade F, #135 of 424 statewide, top 32%, 1,888 students, 30% FRL) — zoned schools at 31% FRL track the district average.
- Market conditions: 400 active listings in the ZIP; 7 comparable units currently listed for rent nearby; rentals at typical pace (median 16d on market — plan ~3-4 weeks tenant-placement turnaround); solid renter incomes; 836 units permitted in Effingham County in 2024 (46 in 5+ unit buildings).
- This rent runs 34% of the median local income ($102k/yr) — at the standard rent-burdened threshold; future hikes will face affordability resistance.
Forward outlook
- Local home prices are declining (-3.0%/yr); year-one equity from $2k of loan paydown is wiped out by about $10k of value loss. Plan a longer hold.
- Effingham County population projected at +33% by 2050 — long-run rental-demand tailwind backs the buy-and-hold thesis.
Negotiation context
- Only 3 days on market — expect competitive offers; lowballing is unlikely to land.
- 4 sale attempts since 5y ago with the ask held roughly flat each time — persistent listings suggest the price (not the market) is what's stuck; bring a comps-based counter.
- Current owner paid $263k; 25% above their basis — modest negotiation headroom, anchor on the comps not their cost.
Risks & watch-outs
- Climate carrying-cost: severe wind risk, 96% chance of damaging wind over 30y; extreme-heat days projected 7→17/yr by 2055 (HVAC capex compounding) — expect insurance premiums to compound above CPI over the hold.
Questions for the listing agent
- What do current leases actually rent for vs. the listed asking? Can we see a recent rent roll and the last 12 months of T-12 income?
- What does the HOA fee cover, when was the last increase, and are there any pending special assessments or reserve-fund shortfalls?
- Is there a deadline driving the sale (1031 exchange, divorce, estate, relocation)? That informs how much negotiation room exists.
- The area grade is low — what's the realistic commute time and amenity access for the typical tenant pool here? Any planned neighborhood developments (good or bad) we should know about?
- What's the average days-on-market for RENTAL listings here right now (not sales)? A rising rental-DOM trend means longer vacancies and softer asking-rent achievability than the comps imply.
- What's the recent tenant-quality profile in this submarket — average credit score on applications, eviction rate, late-payment / NSF rate, and stable-employment percentage? A property-management company in the area should have these aggregated.
- How much new for-sale + rental construction is in the pipeline within 1–3 miles? Heavy new supply typically softens prices + rents 12–24 months out; constrained supply supports both.
Investment metrics
- 1% rule
- 0.88% ✗
- Cap rate
- 6.23%
- Cash-on-cash
- -0.21%
- DSCR
- 0.99
- GRM
- 9.5
CMA / ARV
- ARV (on-the-fly)
- $366,900
- Comps found
- 12
Show comp detail 12 sales within ~0.75 mi
| Address | Dist | Beds/Ba | Sqft | Sold | Price | $/sf | Match |
|---|---|---|---|---|---|---|---|
| 108 Butternut Blvd | 0.21mi | 5/3.0 | 2,421 (-1%) | 3mo | $300,000 | $124 | 85 |
| 144 Tobago Cir | 0.15mi | 5/3.0 | 2,362 (-3%) | 6mo | $369,400 | $156 | 82 |
| 107 Butternut Blvd | 0.24mi | 5/3.0 | 2,440 (-0%) | 12mo | $370,000 | $152 | 79 |
| 106 Aruba Rd | 0.22mi | 4/2.5 (-1) | 2,427 (-1%) | 10mo | $360,000 | $148 | 74 |
| 123 Cotton Bluff Ct | 0.48mi | 4/2.5 (-1) | 2,505 (+2%) | 1mo | $330,000 | $132 | 66 |
| 202 Caribbean Village Dr | 0.14mi | 4/2.5 (-1) | 2,235 (-9%) | 9mo | $335,000 | $150 | 65 |
| 124 Tobago Cir | 0.09mi | 4/2.5 (-1) | 2,193 (-10%) | 11mo | $349,900 | $160 | 62 |
| 265 Caribbean Village Dr | 0.24mi | 4/2.5 (-1) | 2,193 (-10%) | 4mo | $339,900 | $155 | 61 |
| 104 Tupelo Trl | 0.44mi | 4/2.5 (-1) | 2,382 (-3%) | 12mo | $299,000 | $126 | 58 |
| 125 Butternut Ct | 0.34mi | 4/2.5 (-1) | 2,235 (-9%) | 9mo | $339,000 | $152 | 55 |
| 202 Bellflower Cir | 0.33mi | 4/2.5 (-1) | 2,265 (-7%) | 13mo | $283,500 | $125 | 55 |
| 103 Tupelo Trl | 0.47mi | 4/2.5 (-1) | 2,338 (-4%) | 13mo | $321,000 | $137 | 53 |
Match score weights: distance 35% · size 25% · config 20% · recency 20%. Top-matched comps best support the ARV.
Projected returns pro-forma
-3.0% appreciation · 3.0% rent growth · sell at horizon
- IRR
- -16.6%
- Equity multiple
- 0.41×
- Total profit
- $-54,433
- Equity at exit
- $49,189
- IRR
- -8.4%
- Equity multiple
- 0.48×
- Total profit
- $-48,485
- Equity at exit
- $28,524
Cash invested: $92,372 (down + closing). Projections, not guarantees.
Landlord ↔ Tenant lean methodology
- Overall (STATE)
- 90 Strongly Landlord-Friendly
- State Georgia
- 90 Strongly Landlord-Friendly · R+3
- County
- — inherits STATE
- City
- — inherits STATE
ZIP-level market 31312
- Home prices YoY
- -26.6%
- Active inventory
- 400
- Price-to-rent
- 9.5×
Monthly cashflow live
- Estimated rent
- $2,901 high interval (Pro) →
- Mortgage (P&I)
- −$1,730
- Tax from tax record
- −$377 /mo · $4,520/yr
- Insurance
- −$137
- HOA
- −$64
- Vacancy / Maint / Mgmt
- −$609
- Net cashflow
- $-16
Break-even live
Sensitivity live
| Price | -10% $170 | -5% $77 | +0% $-16 | +5% $-110 | +10% $-203 |
|---|---|---|---|---|---|
| Rent | -10% $-245 | -5% $-131 | +0% $-16 | +5% $98 | +10% $213 |
| Rate | -1.0pp $150 | -0.5pp $68 | base $-16 | +0.5pp $-102 | +1.0pp $-189 |
UW: 25.0% down · 7.5% · 30yr · 1.5% tax · 5.0% vac · 8.0% maint · 8.0% mgmt
Financing live
Cash to close
- Down payment
- $82,475
- Closing costs
- $9,897
- Reserves months
- —
- Total cash needed
- —
Loan-product check · same deal, 3 products live
Conventional
25% down · 7.5% · 30yr
- Down + closing
- —
- Monthly P&I
- —
- Monthly cashflow
- —
- DSCR
- —
- Eligible?
- —
Personal DTI + credit; lowest rate.
DSCR
20% down · 8.5% · 30yr
- Down + closing
- —
- Monthly P&I
- —
- Monthly cashflow
- —
- DSCR
- —
- Eligible?
- —
No personal income docs; deal must DSCR.
Hard money
10% down · 12.0% · 12mo
- Down + closing
- —
- Monthly P&I
- —
- Monthly cashflow
- —
- DSCR
- —
- Eligible?
- —
Short-term bridge; refi at stabilization.
Rent comps 7 comps
| Address | Beds | Baths | Sqft | Rent | $/sqft | DOM | Units | Dist |
|---|---|---|---|---|---|---|---|---|
| 105 Creekside Blvd Guyton, GA | 3.0–4.0 | 2.0–2.5 | 1698 | $2,955 | $1.74 | 15d | 15 | 0.86mi |
| 257 Brookline Dr Savannah, GA | 5.0 | 3.0 | 2956 | $2,500 | $0.85 | 15d | 1 | 0.97mi |
| 30 Ashmont St Savannah, GA | 4.0 | 2.5 | 2005 | $2,800 | $1.40 | 15d | 1 | 1.00mi |
| 33 Ashmont St Savannah, GA | 4.0 | 2.5 | 2004 | $2,450 | $1.22 | 23d | 1 | 1.01mi |
| 109 Fenway St Savannah, GA | 4.0 | 2.0 | 2005 | $2,450 | $1.22 | 23d | 1 | 1.04mi |
| 116 Peabody St Savannah, GA | 4.0 | 2.5 | 2005 | $2,500 | $1.25 | 15d | 1 | 1.05mi |
| 134 Brookline Dr Savannah, GA | 4.0 | 2.5 | 2466 | $2,600 | $1.05 | 15d | 1 | 1.12mi |
HOA detail
- Monthly dues
- $64 · $768/yr
- Likely covers
- waterpool
Listing history 3 events
-
2026-06-21days on market $329,900 Active 3 DOM
-
2026-06-19remarks 670-char remark
-
2026-06-19$329,900 Active 1 DOM
ⓘ Source: listings_history table (triggers on properties + properties_extension) + one-shot
backfill from property_details.listing_events for pre-trigger history.
Tax reassessment forecast GA · Resets to sale price
- Current annual tax
- $4,520 · $377/mo
- Projected year-2 tax
- $4,520 · $377/mo
- Expected delta
- $0/yr ($0/mo · 0.0%)
ⓘ Screening estimate from a state-policy table — verify with the county assessor before closing.
Climate risk First Street
- Flood 1/10 Low FEMA zone X (unshaded) · 0% chance over 30 yrs
- Wildfire 4/10 Moderate
- Heat 8/10 Severe 7 d/yr ≥108°F today · 17 d/yr by 30 yrs out
- Wind 8/10 Severe 96% chance of damaging wind over 30 yrs
- Air quality 2/10 Low 2 unhealthy d/yr today · 2 by 30 yrs out
Nearby sold comps map
Loading sold comps map…
Walkable amenities ~0.75 mi
Loading nearby amenities…
Taxation est. · year 1
- Rental income
- $34,813
- − Mortgage interest
- −$18,480
- − Property taxes
- −$4,520
- − Insurance
- −$1,650
- − Repairs & maintenance
- −$2,785
- − Management
- −$2,785
- − HOA
- −$768
- − Depreciation
- −$9,597
- Taxable loss
- −$5,771
- Est. tax savings @ 24.0%
- +$1,385
- After-tax cash flow
- $1,190/yr
For passive investors: Depreciation is non-cash, so a rental often shows a tax loss while cash-flowing — sheltering income. Rental losses are passive: they offset passive income freely, and up to $25,000/yr can offset ordinary (W-2) income if you actively participate and your MAGI is under $100k (phasing out to $0 by $150k); unused losses carry forward. On sale, claimed depreciation is recaptured at up to 25%, and gains may owe capital-gains tax (a 1031 exchange can defer both). Figures are a year-1 estimate at your 24.0% rate — not tax advice; consult a CPA.
Schools (NCES district)
- District
- Effingham County
- NCES district ID
- 1301980
- Math proficiency
- 49% ▼ -6.00%
- Reading proficiency
- 48% ▼ -5.00%
- Median HH income
- $60,503
- Composite
- 42.56/100
- National rank
- #3195
- State rank
- #16 of 174 in GA
Livability — Guyton
- Score
- 69/100
- State rank
- #128
- US rank
- #9058
Category grades
Schools grade is shown separately in the Schools card above.
Census & demographics
- County
- Effingham County · 68,439 people
- City population
- 25,991
- Metro
- Savannah, GA
- Population (ZIP)
- 25,991
- Household income
- $101,750
- Rent vs Own
- Severe rent burden
- 97.0
Population outlook (Effingham County) Hauer SSP2
- Today (2025)
- 67,399 people
- By 2030
- 72,297 · +7.3%
- By 2040
- 81,602 · +21.1%
- By 2050
- 89,494 · +32.8%
- By 2075
- 105,976 · +57.2%
- By 2100
- 111,943 · +66.1%
Race, ethnicity, and origin ACS 2023
- Neighborhood character
- Predominantly White (75%)
- Race & ethnicity
- White 75% Black 11% Two or more races 9% Hispanic / Latino 7%
- Hispanic origin (detail)
- Mexican 3% Puerto Rican 2% Cuban 1%
- Common ancestry
- Slovak 2% Italian 2% Lithuanian 1%
- Foreign-born
- 3% · Canada
- Languages at home
- 96% English-only · Spanish 2%
Political lean MEDSL · Effingham
- 2024 margin
- Solid R (+49.1) · D 25.2% · R 74.3%
- 2008→2024 swing
- +1.6pp toward D · 2008: -50.7pp · 2024: -49.1pp
- All cycles
- 2024: R+49.1 2020: R+49.5 2016: R+55.6 2012: R+51.2 2008: R+50.7
Not yet ingested
- Civics
- —
Market trends
- HPI YoY
- ▼ -74.77%
- Current HPI
- 205.9899
- Rent YoY
- —
- Metro
- Savannah, GA
- State GDP YoY
- ▲ 2.66%
- F500 in state
- 28
Industry mix (Fortune 500 HQ in GA)
| Industry | F500 HQs | Revenue |
|---|---|---|
| Paper / Packaging | 2 | $29B |
|
||
| Retail | 1 | $160B |
|
||
| Transportation / Logistics | 1 | $91B |
|
||
| Airlines | 1 | $62B |
|
||
| Consumer Goods | 1 | $47B |
|
||
| Utilities | 1 | $25B |
|
||
Price history
+25.4% since first listed6 events — show timeline
- 2026-06-18 Listed $329,900 Hive MLS
- 2024-06-16 Rental Removed $3,000 RENT.
- 2024-05-16 Listed for Rent $3,000 RENT.
- 2021-09-01 Sold (MLS) $262,990 Hive MLS
- 2021-03-07 Listed $262,990 Hive MLS
- 2021-03-07 Listed $262,990 Hive MLS
Property tax history
+10.9%/yrLatest (2025): $4,520 · +28.7% YoY. Source: county tax records.
Cash-flow waterfall
monthlySold comps — $/sqft
last 12 mo · ≤1 miLoading sold comps…