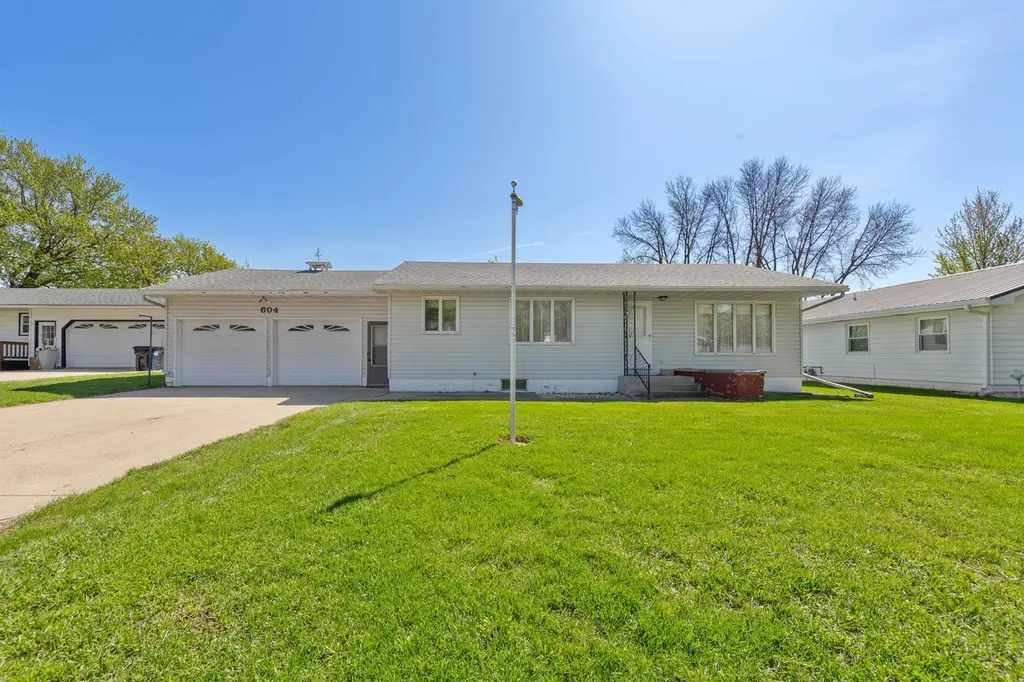
604 Adams Street St · Armstrong, IA
Flood risk 1/10 · Minimal
- FEMA flood zone
- X (unshaded)
- Chance of flooding over 30 yrs
- 0.0%
- Est. flood insurance / yr
- $473 – $860
Fire risk 3/10 · Minor
- Est. fire insurance / yr
- $902 – $1,676
Heat risk 2/10 · Minimal
- Hot days now (above 99°F)
- 7 days/yr
- Hot days in 30 yrs
- 16 days/yr
Wind risk 2/10 · Minimal
- Chance of severe wind over 30 yrs
- —
Air-quality risk 2/10 · Minimal
- Unhealthy air days now
- 1 days/yr
- Unhealthy air days in 30 yrs
- 1 days/yr
Risk factors via First Street. Map © Google.
Why this score? — see what drove the C- grade
The composite is a weighted blend of 9 inputs, each scored 0–100. Each bar is that input's sub-score; the figure is the points it added to the 100-point composite (weight × sub-score).
- Cash flow +14.4/30.0
- ARV discount +9.0/15.0
- Appreciation +7.3/10.0
- Schools +6.4/10.0
- DSCR +4.4/10.0
- 1% rule +3.8/10.0
- Livability +3.6/5.0
- Rent growth +2.5/5.0
- Condition / age +2.5/5.0
$138,000
🖨 Deal sheet (PDF) 📄 Offer letter ✓ Due diligence
Listing remarks
Mid-century Ranch with 2 levels of living space! The main floor features a spacious living + dining + kitchen area with a main-floor laundry, two bedrooms and full bath. The basement is finished with a 2nd kitchen, bedroom, family room and 3/4 bathroom. Nice backyard with a patio and a shed for storage. What remains in the house can stay if buyer requested.
Key facts
- Backyard patio
- Main floor laundry
- Finished basement
Tags
Property features AI
Finance
- Other: Approximately 1,040 above-grade finished area and 800 below-grade finished area; Lot roughly 0.25 acre (dimensions 80 x 138)
Exterior
- Parking: Attached 2-car garage
- Utilities: Public water; Public sewer
- Home design: Single-family residence; One story; Residential property
- Construction: Vinyl siding; Asphalt roof
- Exterior features: Patio; Publicly maintained road
Interior
- Kitchen: Dishwasher; Oven; Refrigerator; Water purifier
- Bathrooms: 1 full bathroom; 1 three-quarter bathroom
- Heating & cooling: Natural gas heating; Baseboard heating; Forced air heating; Central air conditioning
- Interior features: Full basement with sump pump; Patio
- Laundry & utility: Washer; Dryer; Main-level laundry
Neighborhood map
What this means for you Summary
Snapshot
- This is a 3-bed/2.0-bath single-family listed at $138k.
Deal economics
- At list price, monthly cash flow is $29 ($348/yr) — positive.
- The deal already cash-flows at list — no discount required.
- To meet the 1% rule (rent ≥ 1% of price), the offer needs to be $122k (11.6% below list).
- Recommended offer: $122k (11.6% below list) — sets the bar for 1% rule.
Location & tenants
- Location reads 71/100 on livability (#352 in IA) — a middle-class / working-renter tenant base. Strengths: cost of living A+, housing A+, health & safety A+; Watch: employment D, amenities F, commute F.
- North Union Community School District (rural): math 68% / reading 83% proficiency, ranked #73 of 289 in IA (top 25%) — strong family-tenant draw, lease renewals of 3-5y typical.
- Zoned schools: North Union Elementary (math 84% / reading 84%, grade A+, #31 of 616 statewide, top 6%, 131 students, 51% FRL); North Union High School (math 62% / reading 82%, grade B+, #117 of 336 statewide, top 39%, 194 students, 53% FRL) — zoned schools average 52% FRL vs 30% district-wide (22 pts higher); higher-poverty schools than district average — tighter screening recommended.
- Market conditions: 6 active listings in the ZIP; 11 units permitted in Emmet County in 2024 (0 in 5+ unit buildings).
Forward outlook
- In year one you build about $7k of equity ($954 loan paydown + $6k appreciation (4.6% local appreciation)).
- Emmet County population projected at -23% by 2050 — secular population decline; favor cash flow + early exit over multi-decade hold.
- At projected returns (4.6% appreciation + 3.0% rent growth), your $39k cash investment doubles in ~5 years — after that, you're playing with house money.
- By year 5, paydown + projected appreciation supports a ~$32k cash-out refi (75% LTV) — recoverable capital for the next deal without selling this one.
Negotiation context
- It's been on market 25 days — a 2% lower offer ($136k) is reasonable based on typical stale-listing flexibility.
Questions for the listing agent
- Built in 1972 — when were the roof, HVAC, electrical panel, plumbing, and water heater last replaced?
- Is there a deadline driving the sale (1031 exchange, divorce, estate, relocation)? That informs how much negotiation room exists.
- Schools are B-rated — typically a magnet for longer-tenancy family renters. What's the average tenant stay here, and is there a school-zone premium baked into asking?
- What's the average days-on-market for RENTAL listings here right now (not sales)? A rising rental-DOM trend means longer vacancies and softer asking-rent achievability than the comps imply.
- What's the recent tenant-quality profile in this submarket — average credit score on applications, eviction rate, late-payment / NSF rate, and stable-employment percentage? A property-management company in the area should have these aggregated.
- How much new for-sale + rental construction is in the pipeline within 1–3 miles? Heavy new supply typically softens prices + rents 12–24 months out; constrained supply supports both.
Investment metrics
- 1% rule
- 0.88% ✗
- Cap rate
- 6.55%
- Cash-on-cash
- 0.90%
- DSCR
- 1.04
- GRM
- 9.4
CMA / ARV
- ARV (median comp)
- $142,737
- List price
- $138,000
- Delta
- -3.32%
- Verdict
- FAIR
- Comps
- 20 within 1.0 mi
Show comp detail 5 sales within ~0.75 mi
| Address | Dist | Beds/Ba | Sqft | Sold | Price | $/sf | Match |
|---|---|---|---|---|---|---|---|
| 604 Adams Street St | 0.00mi | 3/2.0 | 2,054 (+3%) | 0mo | $138,000 | $67 | 95 |
| 305 7th St | 0.37mi | 3/1.0 | 1,808 (-9%) | 12mo | $125,000 | $69 | 53 |
| 400 2nd Ave | 0.51mi | 3/2.0 | 1,872 (-6%) | 20mo | $163,000 | $87 | 49 |
| 201 4th St | 0.60mi | 3/2.0 | 2,260 (+13%) | 3mo | $160,000 | $71 | 47 |
| 203 6th St | 0.49mi | 4/1.0 (+1) | 2,270 (+14%) | 18mo | $99,000 | $44 | 30 |
Match score weights: distance 35% · size 25% · config 20% · recency 20%. Top-matched comps best support the ARV.
Projected returns pro-forma
4.64% appreciation · 3.0% rent growth · sell at horizon
- IRR
- 12.7%
- Equity multiple
- 1.80×
- Total profit
- $30,845
- Equity at exit
- $75,207
- IRR
- 13.8%
- Equity multiple
- 3.41×
- Total profit
- $93,074
- Equity at exit
- $127,386
Cash invested: $38,640 (down + closing). Projections, not guarantees.
Landlord ↔ Tenant lean methodology
- Overall (STATE)
- 83 Strongly Landlord-Friendly
- State Iowa
- 83 Strongly Landlord-Friendly · R+6
- County
- — inherits STATE
- City
- — inherits STATE
ZIP-level market 50514
- Home prices YoY
- 2.8%
- Active inventory
- 6
- Price-to-rent
- 9.4×
Monthly cashflow live
- Estimated rent
- $1,219 medium interval (Pro) →
- Mortgage (P&I)
- −$724
- Tax from tax record
- −$153 /mo · $1,838/yr
- Insurance
- −$58
- HOA
- −$0
- Vacancy / Maint / Mgmt
- −$256
- Net cashflow
- $29
Break-even live
Sensitivity live
| Price | -10% $107 | -5% $68 | +0% $29 | +5% $-10 | +10% $-49 |
|---|---|---|---|---|---|
| Rent | -10% $-67 | -5% $-19 | +0% $29 | +5% $77 | +10% $125 |
| Rate | -1.0pp $99 | -0.5pp $64 | base $29 | +0.5pp $-7 | +1.0pp $-43 |
UW: 25.0% down · 7.5% · 30yr · 1.5% tax · 5.0% vac · 8.0% maint · 8.0% mgmt
Financing live
Cash to close
- Down payment
- $34,500
- Closing costs
- $4,140
- Reserves months
- —
- Total cash needed
- —
Loan-product check · same deal, 3 products live
Conventional
25% down · 7.5% · 30yr
- Down + closing
- —
- Monthly P&I
- —
- Monthly cashflow
- —
- DSCR
- —
- Eligible?
- —
Personal DTI + credit; lowest rate.
DSCR
20% down · 8.5% · 30yr
- Down + closing
- —
- Monthly P&I
- —
- Monthly cashflow
- —
- DSCR
- —
- Eligible?
- —
No personal income docs; deal must DSCR.
Hard money
10% down · 12.0% · 12mo
- Down + closing
- —
- Monthly P&I
- —
- Monthly cashflow
- —
- DSCR
- —
- Eligible?
- —
Short-term bridge; refi at stabilization.
Listing history 3 events
-
2026-05-09historical Active Under Contract 360-char remark
-
2026-05-04$138,000 Active 360-char remark
-
2011-09-07soldstatus $97,600
ⓘ Source: listings_history table (triggers on properties + properties_extension) + one-shot
backfill from property_details.listing_events for pre-trigger history.
Tax reassessment forecast IA · Partial reset (capped growth)
- Current annual tax
- $1,838 · $153/mo
- Projected year-2 tax
- $2,002 · $167/mo
- Expected delta
- +$164/yr (+$14/mo · 8.9%)
ⓘ Screening estimate from a state-policy table — verify with the county assessor before closing.
Climate risk First Street
- Flood 1/10 Low FEMA zone X (unshaded) · 0% chance over 30 yrs
- Wildfire 3/10 Moderate
- Heat 2/10 Low 7 d/yr ≥99°F today · 16 d/yr by 30 yrs out
- Wind 2/10 Low
- Air quality 2/10 Low 1 unhealthy d/yr today · 1 by 30 yrs out
Nearby sold comps map
Loading sold comps map…
Walkable amenities ~0.75 mi
Loading nearby amenities…
Taxation est. · year 1
- Rental income
- $14,633
- − Mortgage interest
- −$7,730
- − Property taxes
- −$1,838
- − Insurance
- −$690
- − Repairs & maintenance
- −$1,171
- − Management
- −$1,171
- − Depreciation
- −$4,015
- Taxable loss
- −$1,981
- Est. tax savings @ 24.0%
- +$475
- After-tax cash flow
- $823/yr
For passive investors: Depreciation is non-cash, so a rental often shows a tax loss while cash-flowing — sheltering income. Rental losses are passive: they offset passive income freely, and up to $25,000/yr can offset ordinary (W-2) income if you actively participate and your MAGI is under $100k (phasing out to $0 by $150k); unused losses carry forward. On sale, claimed depreciation is recaptured at up to 25%, and gains may owe capital-gains tax (a 1031 exchange can defer both). Figures are a year-1 estimate at your 24.0% rate — not tax advice; consult a CPA.
Schools (NCES district)
- District
- North Union Community School District
- NCES district ID
- 1903850
- Math proficiency
- 68% ▲ 8.00%
- Reading proficiency
- 83% ▲ 8.00%
- Median HH income
- $49,521
- Composite
- 63.83/100
- National rank
- #592
- State rank
- #73 of 289 in IA
Livability — Armstrong
- Score
- 71/100
- State rank
- #352
- US rank
- #7186
Category grades
Schools grade is shown separately in the Schools card above.
Census & demographics
- Census place
- Armstrong, IA
- Population (ZIP)
- 1,190
Population outlook (Emmet County) Hauer SSP2
- Today (2025)
- 9,084 people
- By 2030
- 8,626 · -5.0%
- By 2040
- 7,751 · -14.7%
- By 2050
- 6,991 · -23.0%
- By 2075
- 5,854 · -35.6%
- By 2100
- 5,563 · -38.8%
Race, ethnicity, and origin ACS 2023
- Neighborhood character
- Predominantly White (98%)
- Race & ethnicity
- White 98% Two or more races 1%
- Common ancestry
- Portuguese 12% Slovak 2% Iranian 1%
- Foreign-born
- 1%
Political lean MEDSL · Emmet
- 2024 margin
- Solid R (+44.0) · D 27.5% · R 71.5% · Other 1.0%
- 2008→2024 swing
- -48.0pp toward R · 2008: 3.9pp · 2024: -44.0pp
- All cycles
- 2024: R+44.0 2020: R+36.0 2016: R+37.5 2012: R+8.9 2008: D+3.9
Not yet ingested
- Civics
- —
Market trends
- HPI YoY
- ▲ 4.64%
- Current HPI
- 170.7437
- Rent YoY
- —
- Metro
- —
- State GDP YoY
- ▲ 2.48%
- F500 in state
- 4
Industry mix (Fortune 500 HQ in IA)
| Industry | F500 HQs | Revenue |
|---|---|---|
| Financial Services | 1 | $16B |
|
||
| Retail / Convenience | 1 | $15B |
|
||
Price history
+41.4% since first listed5 events — show timeline
- 2026-06-11 Sold (MLS) $138,000 Iowa Great Lakes BOR
- 2026-05-29 Pending — Iowa Great Lakes BOR
- 2026-05-09 Contingent — Iowa Great Lakes BOR
- 2026-05-04 Listed $138,000 Iowa Great Lakes BOR
- 2011-09-07 Sold (Public Records) $97,600 Public Records
Property tax history
+5.4%/yrLatest (2025): $1,838 · -0.5% YoY. Source: county tax records.
Cash-flow waterfall
monthlySold comps — $/sqft
last 12 mo · ≤1 miLoading sold comps…