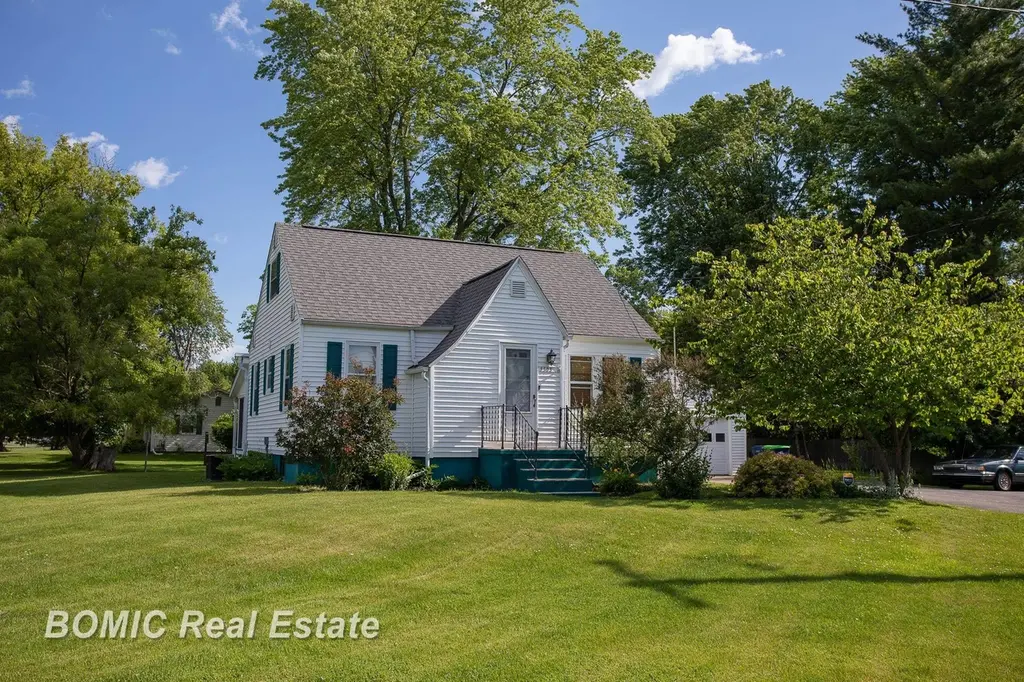
3303 Tatham Rd · Bridgeport, MI
Flood risk 1/10 · Minimal
- FEMA flood zone
- X (unshaded)
- Chance of flooding over 30 yrs
- 0.0%
- Est. flood insurance / yr
- $507 – $1,088
Fire risk 2/10 · Minimal
- Est. fire insurance / yr
- $784 – $1,456
Heat risk 2/10 · Minimal
- Hot days now (above 98°F)
- 7 days/yr
- Hot days in 30 yrs
- 14 days/yr
Wind risk 1/10 · Minimal
- Chance of severe wind over 30 yrs
- —
Air-quality risk 2/10 · Minimal
- Unhealthy air days now
- 1 days/yr
- Unhealthy air days in 30 yrs
- 2 days/yr
Risk factors via First Street. Map © Google.
Why this score? — see what drove the D grade
The composite is a weighted blend of 9 inputs, each scored 0–100. Each bar is that input's sub-score; the figure is the points it added to the 100-point composite (weight × sub-score).
- Cash flow +16.5/30.0
- ARV discount +7.5/15.0
- DSCR +5.1/10.0
- 1% rule +3.2/10.0
- Livability +2.9/5.0
- Rent growth +2.5/5.0
- Condition / age +2.5/5.0
- Schools +1.0/10.0
- Appreciation +0.0/10.0
$109,900
🖨 Deal sheet 📄 Offer letter ✓ Due diligence
Listing remarks
Cute little 4-bedroom home with a partially finished basement, a garage and a nice country setting. This one is conveniently located near Saginaw and close to everything you need. There is a covered porch in back to sit and watch the birds in your park-like back yard. A new coat of paint and some updates and you will bring this one back to a beautiful home. Call today!
Key facts
- Covered porch
- Park-like back yard
- 0.81 acre lot
Tags
Property features AI
Exterior
- Parking: Detached 2-car garage with electric in garage
- Utilities: Public water; Public sanitary sewer; Natural gas
- Home design: Residential property; 1 1/2-story structure; Built in 1947
- Construction: Vinyl siding exterior; Poured foundation; Basement (partially finished below grade finished area present)
- Exterior features: Porch; Corner lot; Road frontage
Interior
- Kitchen: 12 x 10 kitchen with vinyl flooring; Range/Oven; Refrigerator; Disposal
- Bedrooms: Bedroom 1 (Entry): 11 x 9, carpet; Bedroom 2 (Entry): 10 x 9, carpet; Bedroom 3 (Upper): ~10 wide, carpet; Bedroom 4 (Upper): 12 x 10, carpet
- Flooring: Carpet in living areas and bedrooms; Vinyl in kitchen, bathrooms, and laundry
- Bathrooms: One full bathroom; One additional lavatory (total 2 baths/lavatories); Main bathroom (Entry): approximately 7 x 5, vinyl floor; Basement lavatory: approximately 4 x 4, vinyl floor
- Heating & cooling: Forced air heating; Natural gas fuel
- Interior features: Living room; Sun/Florida room; Has basement (poured foundation)
- Laundry & utility: Basement laundry room (9 x 9) with vinyl flooring
Neighborhood map
What this means for you Summary
Snapshot
- This is a 3-bed/1.0-bath single-family listed at $110k.
Deal economics
- At list price, monthly cash flow is $64 ($764/yr) — positive.
- The deal already cash-flows at list — no discount required.
- To meet the 1% rule (rent ≥ 1% of price), the offer needs to be $90k (18.3% below list).
- Recommended offer: $90k (18.3% below list) — sets the bar for 1% rule.
Location & tenants
- Location reads 57/100 on livability (#638 in MI) — a working-class tenant base; expect higher turnover. Strengths: cost of living A+, housing A-; Watch: health & safety C-, crime D, schools F.
- Bridgeport-Spaulding Community School District (suburban): math 7% / reading 17% proficiency, ranked #513 of 540 in MI (top 95%) — low school quality limits family demand, transient renter base, plan for 1-2y turnover; 75% free/reduced lunch — lower-income household profile, screen leases tightly.
- Market conditions: 199 active listings in the ZIP; 3 comparable units currently listed for rent nearby; rentals lingering (median 44d on market — plan ~5-8 weeks vacancy on turnover, expect pricing pressure); 100% of comp listings sitting > 30 days — soft ceiling on asking rent; 154 units permitted in Saginaw County in 2024 (0 in 5+ unit buildings).
Forward outlook
- Local home prices are declining (-3.0%/yr); year-one equity from $760 of loan paydown is wiped out by about $3k of value loss. Plan a longer hold.
- Saginaw County population projected at -25% by 2050 — secular population decline; favor cash flow + early exit over multi-decade hold.
Negotiation context
- Only 1 days on market — expect competitive offers; lowballing is unlikely to land.
Risks & watch-outs
- Watch-outs: built in 1947 — expect roof / HVAC / electrical / plumbing capex.
Questions for the listing agent
- Built in 1947 — when were the roof, HVAC, electrical panel, plumbing, and water heater last replaced?
- Is there a deadline driving the sale (1031 exchange, divorce, estate, relocation)? That informs how much negotiation room exists.
- Schools are F-rated, which usually means shorter tenancies and higher turnover. Who's the typical renter profile here, and what's been the actual vacancy rate?
- Crime grade is D in this area — have there been break-ins, vandalism, or insurance claims at this property in the last 3 years? What carrier currently insures it and at what premium?
- The area grade is low — what's the realistic commute time and amenity access for the typical tenant pool here? Any planned neighborhood developments (good or bad) we should know about?
- What's the average days-on-market for RENTAL listings here right now (not sales)? A rising rental-DOM trend means longer vacancies and softer asking-rent achievability than the comps imply.
- What's the recent tenant-quality profile in this submarket — average credit score on applications, eviction rate, late-payment / NSF rate, and stable-employment percentage? A property-management company in the area should have these aggregated.
- How much new for-sale + rental construction is in the pipeline within 1–3 miles? Heavy new supply typically softens prices + rents 12–24 months out; constrained supply supports both.
Investment metrics
- 1% rule
- 0.82% ✗
- Cap rate
- 6.99%
- Cash-on-cash
- 2.48%
- DSCR
- 1.11
- GRM
- 10.2
CMA / ARV
- ARV (on-the-fly)
- $65,520
- Comps found
- 12
Show comp detail 12 sales within ~0.75 mi
| Address | Dist | Beds/Ba | Sqft | Sold | Price | $/sf | Match |
|---|---|---|---|---|---|---|---|
| 2799 Longview Ave | 0.55mi | 3/1.0 | 968 (+6%) | 3mo | $37,500 | $39 | 62 |
| 5032 Akron St | 0.59mi | 3/1.0 | 960 (+6%) | 4mo | $80,000 | $83 | 60 |
| 1726 Prospect St | 0.61mi | 3/1.0 | 864 (-5%) | 6mo | $33,900 | $39 | 58 |
| 2839 Ohio Ave | 0.46mi | 2/1.0 (-1) | 888 (-2%) | 14mo | $72,500 | $82 | 58 |
| 1890 Prospect St | 0.47mi | 3/1.0 | 864 (-5%) | 14mo | $57,000 | $66 | 57 |
| 5025 Peterson St | 0.72mi | 2/1.0 (-1) | 884 (-3%) | 1mo | $29,500 | $33 | 56 |
| 1800 Prospect St | 0.54mi | 3/1.0 | 864 (-5%) | 15mo | $62,000 | $72 | 54 |
| 2837 Longview Ave | 0.51mi | 2/1.0 (-1) | 864 (-5%) | 14mo | $89,900 | $104 | 51 |
| 2735 Ohio St | 0.57mi | 2/1.0 (-1) | 832 (-9%) | 5mo | $57,000 | $69 | 50 |
| 3531 Summer Ln | 0.50mi | 2/1.0 (-1) | 804 (-12%) | 5mo | $47,500 | $59 | 48 |
| 3519 Hidden Ln | 0.56mi | 3/1.0 | 1,008 (+11%) | 13mo | $95,000 | $94 | 45 |
| 4749 Strathmoor St | 0.73mi | 2/2.0 (-1) | 960 (+6%) | 12mo | $90,000 | $94 | 38 |
Match score weights: distance 35% · size 25% · config 20% · recency 20%. Top-matched comps best support the ARV.
Projected returns pro-forma
-3.0% appreciation · 3.0% rent growth · sell at horizon
- IRR
- -12.4%
- Equity multiple
- 0.55×
- Total profit
- $-13,812
- Equity at exit
- $16,386
- IRR
- -3.4%
- Equity multiple
- 0.77×
- Total profit
- $-7,037
- Equity at exit
- $9,502
Cash invested: $30,772 (down + closing). Projections, not guarantees.
Landlord ↔ Tenant lean methodology
- Overall (STATE)
- 62 Landlord-Friendly
- State Michigan
- 62 Landlord-Friendly · EVEN
- County
- — inherits STATE
- City
- — inherits STATE
ZIP-level market 48601
- Home prices YoY
- -32.1%
- Active inventory
- 199
- Price-to-rent
- 10.2×
Monthly cashflow live
- Estimated rent
- $898 medium interval (Pro) →
- Mortgage (P&I)
- −$576
- Tax from tax record
- −$24 /mo · $286/yr
- Insurance
- −$46
- HOA
- −$0
- Vacancy / Maint / Mgmt
- −$189
- Net cashflow
- $64
Break-even live
UW: 25.0% down · 7.5% · 30yr · 1.5% tax · 5.0% vac · 8.0% maint · 8.0% mgmt
Financing live
Cash to close
- Down payment
- $27,475
- Closing costs
- $3,297
- Reserves months
- —
- Total cash needed
- —
Loan-product check · same deal, 3 products live
Conventional
25% down · 7.5% · 30yr
- Down + closing
- —
- Monthly P&I
- —
- Monthly cashflow
- —
- DSCR
- —
- Eligible?
- —
Personal DTI + credit; lowest rate.
DSCR
20% down · 8.5% · 30yr
- Down + closing
- —
- Monthly P&I
- —
- Monthly cashflow
- —
- DSCR
- —
- Eligible?
- —
No personal income docs; deal must DSCR.
Hard money
10% down · 12.0% · 12mo
- Down + closing
- —
- Monthly P&I
- —
- Monthly cashflow
- —
- DSCR
- —
- Eligible?
- —
Short-term bridge; refi at stabilization.
Rent comps 3 comps
| Address | Beds | Baths | Sqft | Rent | $/sqft | DOM | Units | Dist |
|---|---|---|---|---|---|---|---|---|
| 2800 Gemini St Unit GE2800 Saginaw, MI | 3.0 | 2.0 | 960 | $920 | $0.96 | 44d | 1 | 0.61mi |
| 2564 Apollo Dr Unit AP2564 Saginaw, MI | 3.0 | 2.0 | 960 | $883 | $0.92 | 44d | 1 | 0.85mi |
| 2554 Apollo Dr Unit AP2554 Saginaw, MI | 3.0 | 2.0 | 960 | $883 | $0.92 | 44d | 1 | 0.86mi |
Listing history 3 events
-
2026-06-18$109,900 Active 1 DOM
-
2026-06-18remarks 371-char remark
-
2026-06-18$109,900 Active 1 DOM
ⓘ Source: listings_history table (triggers on properties + properties_extension) + one-shot
backfill from property_details.listing_events for pre-trigger history.
Tax reassessment forecast MI · Partial reset (capped growth)
- Current annual tax
- $286 · $24/mo
- Projected year-2 tax
- $989 · $82/mo
- Expected delta
- +$703/yr (+$59/mo · 246.1%)
ⓘ Screening estimate from a state-policy table — verify with the county assessor before closing.
Climate risk First Street
- Flood 1/10 Low FEMA zone X (unshaded) · 0% chance over 30 yrs
- Wildfire 2/10 Low
- Heat 2/10 Low 7 d/yr ≥98°F today · 14 d/yr by 30 yrs out
- Wind 1/10 Low
- Air quality 2/10 Low 1 unhealthy d/yr today · 2 by 30 yrs out
Nearby sold comps map
Loading sold comps map…
Walkable amenities ~0.75 mi
Loading nearby amenities…
Taxation est. · year 1
- Rental income
- $10,778
- − Mortgage interest
- −$6,156
- − Property taxes
- −$286
- − Insurance
- −$550
- − Repairs & maintenance
- −$862
- − Management
- −$862
- − Depreciation
- −$3,197
- Taxable loss
- −$1,135
- Est. tax savings @ 24.0%
- +$272
- After-tax cash flow
- $1,036/yr
For passive investors: Depreciation is non-cash, so a rental often shows a tax loss while cash-flowing — sheltering income. Rental losses are passive: they offset passive income freely, and up to $25,000/yr can offset ordinary (W-2) income if you actively participate and your MAGI is under $100k (phasing out to $0 by $150k); unused losses carry forward. On sale, claimed depreciation is recaptured at up to 25%, and gains may owe capital-gains tax (a 1031 exchange can defer both). Figures are a year-1 estimate at your 24.0% rate — not tax advice; consult a CPA.
Schools (NCES district)
- District
- Bridgeport-Spaulding Community School District
- NCES district ID
- 2606780
- Math proficiency
- 7% ▼ -4.00%
- Reading proficiency
- 17% ▼ -5.00%
- Median HH income
- $38,403
- Composite
- 10.13/100
- National rank
- #9800
- State rank
- #513 of 540 in MI
Livability — Bridgeport
- Score
- 57/100
- State rank
- #638
- US rank
- #21636
Category grades
Schools grade is shown separately in the Schools card above.
Census & demographics
- Census place
- Bridgeport, MI
- Population (ZIP)
- 32,069
Population outlook (Saginaw County) Hauer SSP2
- Today (2025)
- 180,568 people
- By 2030
- 172,302 · -4.6%
- By 2040
- 153,919 · -14.8%
- By 2050
- 135,519 · -24.9%
- By 2075
- 97,199 · -46.2%
- By 2100
- 65,037 · -64.0%
Race, ethnicity, and origin ACS 2023
- Neighborhood character
- Diverse neighborhood (Simpson 0.56)
- Race & ethnicity
- Black 59% White 27% Hispanic / Latino 12% Two or more races 5%
- Hispanic origin (detail)
- Mexican 10%
- Common ancestry
- Romanian 2% Lithuanian 2%
- Foreign-born
- 1% · Canada
- Languages at home
- 96% English-only · Spanish 4%
Political lean MEDSL · Saginaw
- 2024 margin
- Toss-up / Even · D 47.7% · R 51.0% · Other 1.4%
- 2008→2024 swing
- -20.6pp toward R · 2008: 17.3pp · 2024: -3.3pp
- All cycles
- 2024: R+3.3 2020: D+0.3 2016: R+1.1 2012: D+11.9 2008: D+17.3
Not yet ingested
- Civics
- —
Market trends
- HPI YoY
- ▼ -93.46%
- Current HPI
- 197.3359
- Rent YoY
- —
- Metro
- —
- State GDP YoY
- ▲ 1.37%
- F500 in state
- 28
Industry mix (Fortune 500 HQ in MI)
| Industry | F500 HQs | Revenue |
|---|---|---|
| Automotive Parts | 3 | $48B |
|
||
| Automotive | 2 | $372B |
|
||
| Chemicals | 1 | $45B |
|
||
| Automotive Retail | 1 | $29B |
|
||
| Healthcare / Medical Devices | 1 | $23B |
|
||
| Automotive Technology | 1 | $20B |
|
||
Price history
1 event — show timeline
- 2026-06-17 Listed $109,900 MiRealSource-MiMLS
Property tax history
-10.6%/yrLatest (2025): $286 · -83.8% YoY. Source: county tax records.
Cash-flow waterfall
monthlySold comps — $/sqft
last 12 mo · ≤1 miLoading sold comps…