51/53 Ford St · Highland Park, MI
Flood risk 1/10 · Minimal
- FEMA flood zone
- X (unshaded)
- Chance of flooding over 30 yrs
- 0.0%
- Est. flood insurance / yr
- $473 – $860
Fire risk 1/10 · Minimal
- Est. fire insurance / yr
- $784 – $1,456
Heat risk 3/10 · Minor
- Hot days now (above 97°F)
- 7 days/yr
- Hot days in 30 yrs
- 15 days/yr
Wind risk 2/10 · Minimal
- Chance of severe wind over 30 yrs
- —
Air-quality risk 4/10 · Minor
- Unhealthy air days now
- 4 days/yr
- Unhealthy air days in 30 yrs
- 6 days/yr
Risk factors via First Street. Map © Google.
Why this score? — see what drove the D grade
The composite is a weighted blend of 9 inputs, each scored 0–100. Each bar is that input's sub-score; the figure is the points it added to the 100-point composite (weight × sub-score).
- Cash flow +15.0/30.0
- ARV discount +7.5/15.0
- 1% rule +5.0/10.0
- DSCR +5.0/10.0
- Schools +5.0/10.0
- Livability +3.7/5.0
- Rent growth +2.5/5.0
- Condition / age +1.0/5.0
- Appreciation +0.0/10.0
$25,000
🖨 Deal sheet 📄 Offer letter ✓ Due diligence
Listing remarks MLS
Investor or Homeowner Opportunity! This property offers great potential for the right buyer, whether you're looking to renovate and resell, rent, or make it your own home. Please note: This property will be sold strictly in as-is condition. The Buyer is solely responsible for all inspections, reports, ACR, Certificate of Occupancy (C of O), and activation of any utilities. For more information or to schedule a viewing, please contact the listing agents directly.
Key facts
- 5,227 sq ft lot
- Built 1922
- Listed 365 days
Neighborhood map
What this means for you Summary
Snapshot
- This is a 2-bed/1.5-bath single-family listed at $25k. Condition is rated poor.
Deal economics
- At list price, monthly cash flow is $801 ($10k/yr) — positive.
- The deal already cash-flows at list — no discount required.
- Meets the 1% rule at list price ($1k rent vs $25k).
- Recommended offer: $22k (12.0% below list) — sets the bar for market timing.
- Cap rate 44.8% vs local median 14.2% in Highland Park — top-decile yield for the area; either an underpriced asset or a hidden risk that comps aren't pricing in. Stress-test before assuming the spread holds.
Location & tenants
- Location reads 73/100 on livability (#214 in MI) — a middle-class / working-renter tenant base. Strengths: commute A+, cost of living A+, housing A+; Watch: schools F, crime F, employment F.
- Market conditions: 216 active listings in the ZIP; 1 comparable units currently listed for rent nearby; lower-income renter base — watch delinquency; 2,639 units permitted in Wayne County in 2024 (1,216 in 5+ unit buildings).
- This rent runs 39% of the median local income ($38k/yr) — at the standard rent-burdened threshold; future hikes will face affordability resistance.
Forward outlook
- Local home prices are declining (-3.0%/yr); year-one equity from $173 of loan paydown is wiped out by about $750 of value loss. Plan a longer hold.
- Wayne County population projected at -17% by 2050 — secular population decline; favor cash flow + early exit over multi-decade hold.
- At projected returns (-3.0% appreciation + 3.0% rent growth), your $7k cash investment doubles in ~1 year — after that, you're playing with house money.
Negotiation context
- It's been on market 366 days — a 12% lower offer ($22k) is reasonable based on typical stale-listing flexibility.
- 6 sale attempts since 9y ago; this cycle's ask has dropped $5k (17%) from the opening price — seller is motivated, your offer sets the floor, not the list.
- Current owner paid $2k; list at $25k implies a 1150% gain — meaningful room to come down on a strong offer.
Risks & watch-outs
- Watch-outs: built in 1922 — expect roof / HVAC / electrical / plumbing capex.
Questions for the listing agent
- It's been on market 366 days. Have you received any prior offers? Is the seller open to a 12% concession, seller financing, or rate buy-down credit?
- Have any recent inspections been done? Can we get a copy of the seller's disclosures and any deferred-maintenance estimates?
- Built in 1922 — when were the roof, HVAC, electrical panel, plumbing, and water heater last replaced?
- Why hasn't it sold? Are there any deal-killer items the seller is aware of (foundation, flood, title, zoning, code violations)?
- Is there a deadline driving the sale (1031 exchange, divorce, estate, relocation)? That informs how much negotiation room exists.
- Schools are F-rated, which usually means shorter tenancies and higher turnover. Who's the typical renter profile here, and what's been the actual vacancy rate?
- Crime grade is F in this area — have there been break-ins, vandalism, or insurance claims at this property in the last 3 years? What carrier currently insures it and at what premium?
- The area grade is low — what's the realistic commute time and amenity access for the typical tenant pool here? Any planned neighborhood developments (good or bad) we should know about?
- What's the average days-on-market for RENTAL listings here right now (not sales)? A rising rental-DOM trend means longer vacancies and softer asking-rent achievability than the comps imply.
- What's the recent tenant-quality profile in this submarket — average credit score on applications, eviction rate, late-payment / NSF rate, and stable-employment percentage? A property-management company in the area should have these aggregated.
- How much new for-sale + rental construction is in the pipeline within 1–3 miles? Heavy new supply typically softens prices + rents 12–24 months out; constrained supply supports both.
Investment metrics
- 1% rule
- 4.93% ✓
- Cap rate
- 44.76%
- Cash-on-cash
- 137.38%
- DSCR
- 7.11
- GRM
- 1.7
CMA / ARV
- ARV (median comp)
- $94,715
- List price
- $25,000
- Delta
- -73.61%
- Verdict
- UNDERPRICED
- Comps
- 16 within 1.0 mi
Projected returns pro-forma
-3.0% appreciation · 3.0% rent growth · sell at horizon
- IRR
- —
- Equity multiple
- 7.72×
- Total profit
- $47,006
- Equity at exit
- $3,728
- IRR
- —
- Equity multiple
- 16.25×
- Total profit
- $106,728
- Equity at exit
- $2,162
Cash invested: $7,000 (down + closing). Projections, not guarantees.
Landlord ↔ Tenant lean methodology
- Overall (STATE)
- 62 Landlord-Friendly
- State Michigan
- 62 Landlord-Friendly · EVEN
- County
- — inherits STATE
- City
- — inherits STATE
ZIP-level market 48203
- Home prices YoY
- -23.3%
- Active inventory
- 216
- Price-to-rent
- 1.7×
Monthly cashflow live
- Estimated rent
- $1,233 medium interval (Pro) →
- Mortgage (P&I)
- −$131
- Tax est. 1.5%
- −$31 /mo · $375/yr
- Insurance
- −$10
- HOA
- −$0
- Vacancy / Maint / Mgmt
- −$259
- Net cashflow
- $801
Break-even live
UW: 25.0% down · 7.5% · 30yr · 1.5% tax · 5.0% vac · 8.0% maint · 8.0% mgmt
Financing live
Cash to close
- Down payment
- $6,250
- Closing costs
- $750
- Reserves months
- —
- Total cash needed
- —
Loan-product check · same deal, 3 products live
Conventional
25% down · 7.5% · 30yr
- Down + closing
- —
- Monthly P&I
- —
- Monthly cashflow
- —
- DSCR
- —
- Eligible?
- —
Personal DTI + credit; lowest rate.
DSCR
20% down · 8.5% · 30yr
- Down + closing
- —
- Monthly P&I
- —
- Monthly cashflow
- —
- DSCR
- —
- Eligible?
- —
No personal income docs; deal must DSCR.
Hard money
10% down · 12.0% · 12mo
- Down + closing
- —
- Monthly P&I
- —
- Monthly cashflow
- —
- DSCR
- —
- Eligible?
- —
Short-term bridge; refi at stabilization.
Rent comps 1 comps
| Address | Beds | Baths | Sqft | Rent | $/sqft | DOM | Units | Dist |
|---|---|---|---|---|---|---|---|---|
| 15537 Normandy St Detroit, MI | 3.0 | 1.0 | 2626 | $1,400 | $0.53 | 44d | 1 | 1.41mi |
Listing history 32 events
-
2026-06-18days on market $25,000 Active 366 DOM
-
2026-06-17days on market $25,000 Active 365 DOM
-
2026-06-16days on market $25,000 Active 364 DOM
-
2026-06-15days on market $25,000 Active 363 DOM
-
2026-06-13days on market $25,000 Active 361 DOM
-
2026-06-09days on market $25,000 Active 357 DOM
-
2026-06-08days on market $25,000 Active 356 DOM
-
2026-06-07days on market $25,000 Active 355 DOM
-
2026-06-04days on market $25,000 Active 352 DOM
-
2026-06-03days on market $25,000 Active 351 DOM
-
2026-06-02days on market $25,000 Active 350 DOM
-
2026-06-01days on market $25,000 Active 349 DOM
-
2026-05-31days on market $25,000 Active 348 DOM
-
2025-08-13price $25,000 466-char remark
Show marketing remark (466 chars)
Investor or Homeowner Opportunity! This property offers great potential for the right buyer, whether you're looking to renovate and resell, rent, or make it your own home. Please note: This property will be sold strictly in as-is condition. The Buyer is solely responsible for all inspections, reports, ACR, Certificate of Occupancy (C of O), and activation of any utilities. For more information or to schedule a viewing, please contact the listing agents directly.
-
2025-06-18$30,000 Active 466-char remark
Show marketing remark (466 chars)
Investor or Homeowner Opportunity! This property offers great potential for the right buyer, whether you're looking to renovate and resell, rent, or make it your own home. Please note: This property will be sold strictly in as-is condition. The Buyer is solely responsible for all inspections, reports, ACR, Certificate of Occupancy (C of O), and activation of any utilities. For more information or to schedule a viewing, please contact the listing agents directly.
-
2025-06-17$30,000 Active 466-char remark
Show marketing remark (466 chars)
Investor or Homeowner Opportunity! This property offers great potential for the right buyer, whether you're looking to renovate and resell, rent, or make it your own home. Please note: This property will be sold strictly in as-is condition. The Buyer is solely responsible for all inspections, reports, ACR, Certificate of Occupancy (C of O), and activation of any utilities. For more information or to schedule a viewing, please contact the listing agents directly.
-
2025-06-16historical
-
2025-06-16historical
-
2025-04-04price $30,000
-
2025-04-03price $30,000
-
2024-08-27price $35,000
-
2024-08-12$35,000 Active
-
2024-08-12$40,000 Active
-
2017-06-01soldstatus $2,000 Sold
-
2017-06-01soldstatus $2,000 Closed
-
2017-05-31price $3,500
-
2017-05-31status Pending
-
2017-05-31status Pending
-
2017-05-31price $3,500
-
2017-05-24$9,500 Active
-
2017-05-24$9,500 Active
ⓘ Source: listings_history table (triggers on properties + properties_extension) + one-shot
backfill from property_details.listing_events for pre-trigger history.
Climate risk First Street
- Flood 1/10 Low FEMA zone X (unshaded) · 0% chance over 30 yrs
- Wildfire 1/10 Low
- Heat 3/10 Moderate 7 d/yr ≥97°F today · 15 d/yr by 30 yrs out
- Wind 2/10 Low
- Air quality 4/10 Moderate 4 unhealthy d/yr today · 6 by 30 yrs out
Nearby sold comps map
Loading sold comps map…
Walkable amenities ~0.75 mi
Loading nearby amenities…
Taxation est. · year 1
- Rental income
- $14,797
- − Mortgage interest
- −$1,400
- − Property taxes
- −$375
- − Insurance
- −$125
- − Repairs & maintenance
- −$1,184
- − Management
- −$1,184
- − Depreciation
- −$727
- Taxable income
- $9,802
- Est. tax owed @ 24.0%
- −$2,352
- After-tax cash flow
- $7,264/yr
For passive investors: Depreciation is non-cash, so a rental often shows a tax loss while cash-flowing — sheltering income. Rental losses are passive: they offset passive income freely, and up to $25,000/yr can offset ordinary (W-2) income if you actively participate and your MAGI is under $100k (phasing out to $0 by $150k); unused losses carry forward. On sale, claimed depreciation is recaptured at up to 25%, and gains may owe capital-gains tax (a 1031 exchange can defer both). Figures are a year-1 estimate at your 24.0% rate — not tax advice; consult a CPA.
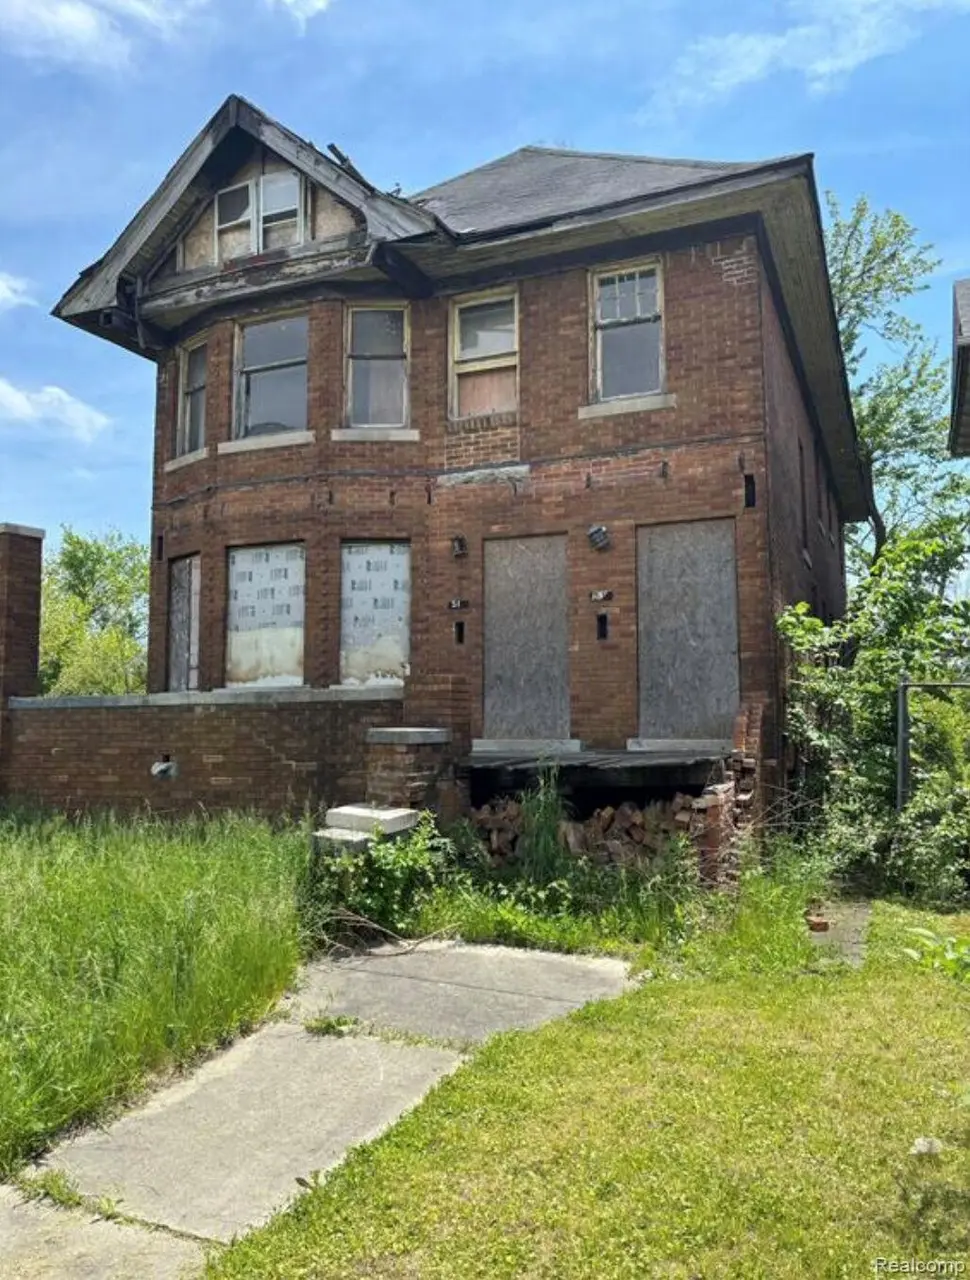
Condition & rehab AI · 1 photo
This property requires extensive repairs and maintenance, including roof, exterior, and interior updates. Significant improvements are needed to make it move-in ready and attractive for resale or rental.
Repairs flagged
- Major roof — Missing shingles and possible water damage
- Major exterior siding — Peeling and damaged in places
- Major exterior walls — Signs of wear and possible water damage
- Major windows — Boarded up
- Major foundation — Visible cracks and possible water damage
- Major porch flooring — Broken and uneven
Value-add opportunities
- Both Landscaping and exterior repairs — Improving the curb appeal and exterior condition would attract more buyers and renters.
- Both Interior repairs and updates — Updating the interior would make the home more attractive and functional for both resale and rental.
- Both HVAC and mechanical systems — Upgrading the HVAC and mechanical systems would improve comfort and energy efficiency, making the home more attractive for both resale and rental.
- Both Kitchen and bathroom updates — Updating the kitchen and bathroom would make the home more functional and attractive for both resale and rental.
- Both Roof repair — Repairing the roof would address a major issue and prevent further water damage, making the home more attractive for both resale and rental.
Renovation cost estimate screening
| Repair item | Severity | Est. cost |
|---|---|---|
| roof · Missing shingles and possible water damage | Major | $15,000–50,000 |
| exterior siding · Peeling and damaged in places | Major | $15,000–50,000 |
| exterior walls · Signs of wear and possible water damage | Major | $15,000–50,000 |
| windows · Boarded up | Major | $15,000–50,000 |
| foundation · Visible cracks and possible water damage | Major | $15,000–50,000 |
| porch flooring · Broken and uneven | Major | $15,000–50,000 |
| Total estimated repair cost · 6 items | $90,000–300,000 |
Value-add ROI direction
- Both Landscaping and exterior repairs — Improving the curb appeal and exterior condition would attract more buyers and renters. ↑
- Both Interior repairs and updates — Updating the interior would make the home more attractive and functional for both resale and rental. ↑
- Both HVAC and mechanical systems — Upgrading the HVAC and mechanical systems would improve comfort and energy efficiency, making the home more attractive for both resale and rental. ↑
- Both Kitchen and bathroom updates — Updating the kitchen and bathroom would make the home more functional and attractive for both resale and rental. ↑
- Both Roof repair — Repairing the roof would address a major issue and prevent further water damage, making the home more attractive for both resale and rental. ↑
ⓘ Cost ranges are severity-bucket heuristics (US national rule-of-thumb). Get contractor quotes + a written scope before underwriting a rehab budget.
Schools (NCES district)
No district data.
Livability — Highland Park
- Score
- 73/100
- State rank
- #214
- US rank
- #5271
Category grades
Schools grade is shown separately in the Schools card above.
Census & demographics
- Census place
- Highland Park, MI
- County
- Wayne County · 1,562,939 people
- City population
- 572,865
- Metro
- Detroit-Warren-Dearborn, MI
- Population (ZIP)
- 20,049
- Household income
- $38,404
- Rent vs Own
- Severe rent burden
- 1192.0
Population outlook (Wayne County) Hauer SSP2
- Today (2025)
- 1,675,273 people
- By 2030
- 1,620,300 · -3.3%
- By 2040
- 1,502,341 · -10.3%
- By 2050
- 1,384,039 · -17.4%
- By 2075
- 1,124,592 · -32.9%
- By 2100
- 881,193 · -47.4%
Race, ethnicity, and origin ACS 2023
- Neighborhood character
- Predominantly Black (85%)
- Race & ethnicity
- Black 85% White 8% Two or more races 5% Hispanic / Latino 2%
- Common ancestry
- Lithuanian 1%
- Foreign-born
- 2% · Canada
- Languages at home
- 95% English-only · Spanish 3% French/Haitian/Cajun 1%
Political lean MEDSL · Wayne
- 2024 margin
- Strong D (+29.0) · D 62.7% · R 33.7% · Other 3.6%
- 2008→2024 swing
- -20.5pp toward R · 2008: 49.5pp · 2024: 29.0pp
- All cycles
- 2024: D+29.0 2020: D+38.1 2016: D+37.3 2012: D+46.9 2008: D+49.5
Not yet ingested
- Civics
- —
Market trends
- HPI YoY
- ▼ -90.13%
- Current HPI
- 297.0176
- Rent YoY
- —
- Metro
- Detroit-Warren-Dearborn, MI
- State GDP YoY
- ▲ 1.37%
- F500 in state
- 28
Industry mix (Fortune 500 HQ in MI)
| Industry | F500 HQs | Revenue |
|---|---|---|
| Automotive Parts | 3 | $48B |
|
||
| Automotive | 2 | $372B |
|
||
| Chemicals | 1 | $45B |
|
||
| Automotive Retail | 1 | $29B |
|
||
| Healthcare / Medical Devices | 1 | $23B |
|
||
| Automotive Technology | 1 | $20B |
|
||
Price history
+163.2% since first listed19 events — show timeline
- 2025-08-13 Price Changed $25,000 MiRealSource-MiMLS
- 2025-08-13 Price Changed $25,000 REALCOMP
- 2025-06-18 Listed $30,000 REALCOMP
- 2025-06-17 Listed $30,000 MiRealSource-MiMLS
- 2025-06-16 Listing Removed — REALCOMP
- 2025-06-16 Listing Removed — MiRealSource-MiMLS
- 2025-04-04 Price Changed $30,000 MiRealSource-MiMLS
- 2025-04-03 Price Changed $30,000 REALCOMP
- 2024-08-27 Price Changed $35,000 REALCOMP
- 2024-08-12 Listed $40,000 REALCOMP
- 2024-08-12 Listed $35,000 MiRealSource-MiMLS
- 2017-06-01 Sold (MLS) $2,000 MiRealSource-MiMLS
- 2017-06-01 Sold (MLS) $2,000 REALCOMP
- 2017-05-31 Price Changed $3,500 MiRealSource-MiMLS
- 2017-05-31 Pending — MiRealSource-MiMLS
- 2017-05-31 Pending — REALCOMP
- 2017-05-31 Price Changed $3,500 REALCOMP
- 2017-05-24 Listed $9,500 MiRealSource-MiMLS
- 2017-05-24 Listed $9,500 REALCOMP
Cash-flow waterfall
monthlySold comps — $/sqft
last 12 mo · ≤1 miLoading sold comps…