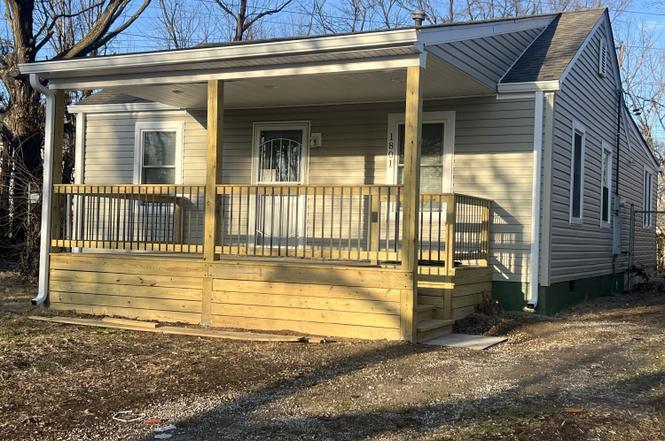
1801 Wenatchee Pl · Louisville, KY
Flood risk 3/10 · Minor
- FEMA flood zone
- X (unshaded)
- Chance of flooding over 30 yrs
- 0.2%
- Est. flood insurance / yr
- $507 – $1,088
Fire risk 1/10 · Minimal
- Est. fire insurance / yr
- $839 – $1,559
Heat risk 5/10 · Moderate
- Hot days now (above 104°F)
- 7 days/yr
- Hot days in 30 yrs
- 18 days/yr
Wind risk 2/10 · Minimal
- Chance of severe wind over 30 yrs
- 1.0%
Air-quality risk 2/10 · Minimal
- Unhealthy air days now
- 1 days/yr
- Unhealthy air days in 30 yrs
- 3 days/yr
Risk factors via First Street. Map © Google.
Why this score? — see what drove the C grade
The composite is a weighted blend of 9 inputs, each scored 0–100. Each bar is that input's sub-score; the figure is the points it added to the 100-point composite (weight × sub-score).
- Cash flow +17.7/30.0
- Appreciation +10.0/10.0
- ARV discount +8.4/15.0
- DSCR +5.5/10.0
- Rent growth +4.5/5.0
- 1% rule +3.7/10.0
- Livability +3.2/5.0
- Condition / age +2.5/5.0
- Schools +2.3/10.0
$159,000
🖨 Deal sheet 📄 Offer letter ✓ Due diligence
Listing remarks MLS
SFNW. IMMACULATE! ALARM SYSTEM REMAINS. APPLIANCES MAY STAY - LARGE BACK YARD COMPLETED FENCED. MAINTENANCE FREE, ON CUL-DE-SAC, SHED ON LARGE CONCRETE APRON. 2-10 90-DAY HOME WARRANTY.
Key facts
- Renovated property
- One floor plan
- Private bath
Tags
Property features AI
Finance
- Other: Subdivision: ALGONQUIN PLACE
- HOA & community: No association fee
Exterior
- Parking: Driveway
- Utilities: Electricity connected; Natural gas
- Home design: Single-family ranch-style home; One story; Built in 1930
- Construction: Vinyl siding; Shingle roof; Built in 1930
- Exterior features: Chain-link fencing; Located on a cul-de-sac
Interior
- Kitchen: Kitchen on the first floor
- Bedrooms: Four bedrooms total, all on the first floor; Primary bedroom located on the first floor
- Bathrooms: Two full bathrooms, including a primary full bathroom on the first floor
- Heating & cooling: One HVAC unit; Central air conditioning; Natural gas available
- Interior features: Six total rooms; Five closets; Basement: none; Living room on the first floor; First-floor laundry
- Laundry & utility: First-floor laundry
Neighborhood map
What this means for you Summary
Snapshot
- This is a 4-bed/2.0-bath single-family listed at $159k.
Deal economics
- At list price, monthly cash flow is $127 ($2k/yr) — positive.
- The deal already cash-flows at list — no discount required.
- To meet the 1% rule (rent ≥ 1% of price), the offer needs to be $139k (12.7% below list).
- Recommended offer: $139k (12.7% below list) — sets the bar for 1% rule.
- Cap rate 7.3% vs local median 5.0% in Louisville — top-decile yield for the area; either an underpriced asset or a hidden risk that comps aren't pricing in. Stress-test before assuming the spread holds.
Location & tenants
- Location reads 63/100 on livability (#333 in KY) — a middle-class / working-renter tenant base. Strengths: cost of living A+, housing A+; Watch: employment C-, health & safety D+, schools D-.
- Jefferson County (urban): math 19% / reading 35% proficiency, ranked #121 of 165 in KY (top 73%) — low school quality limits family demand, transient renter base, plan for 1-2y turnover.
- Market conditions: Rents rising fast (+8.1%/yr); 91 active listings in the ZIP; 36 comparable units currently listed for rent nearby; rentals at typical pace (median 24d on market — plan ~3-4 weeks tenant-placement turnaround); lower-income renter base — watch delinquency; 2,836 units permitted in Jefferson County in 2024 (1,558 in 5+ unit buildings).
Forward outlook
- In year one you build about $17k of equity ($1k loan paydown + $16k appreciation (10.0% local appreciation)).
- Jefferson County population projected at +13% by 2050 — modest demand growth; plan on rents tracking national, not racing it.
- At projected returns (10.0% appreciation + 8.0% rent growth), your $45k cash investment doubles in ~3 years — after that, you're playing with house money.
- By year 3, paydown + projected appreciation supports a ~$43k cash-out refi (75% LTV) — recoverable capital for the next deal without selling this one.
Negotiation context
- It's been on market 88 days — a 6% lower offer ($149k) is reasonable based on typical stale-listing flexibility.
- 4 sale attempts since 28y ago; this cycle's ask has dropped $20k (11%) from the opening price — seller is motivated, your offer sets the floor, not the list.
- Current owner paid $35k; list at $159k implies a 354% gain — meaningful room to come down on a strong offer.
Risks & watch-outs
- Watch-outs: built in 1930 — expect roof / HVAC / electrical / plumbing capex.
- Climate carrying-cost: extreme-heat days projected 7→18/yr by 2055 (HVAC capex compounding) — expect insurance premiums to compound above CPI over the hold.
Questions for the listing agent
- It's been on market 88 days. Have you received any prior offers? Is the seller open to a 13% concession, seller financing, or rate buy-down credit?
- Built in 1930 — when were the roof, HVAC, electrical panel, plumbing, and water heater last replaced?
- Why hasn't it sold? Are there any deal-killer items the seller is aware of (foundation, flood, title, zoning, code violations)?
- Is there a deadline driving the sale (1031 exchange, divorce, estate, relocation)? That informs how much negotiation room exists.
- Schools are D-rated, which usually means shorter tenancies and higher turnover. Who's the typical renter profile here, and what's been the actual vacancy rate?
- Crime grade is F in this area — have there been break-ins, vandalism, or insurance claims at this property in the last 3 years? What carrier currently insures it and at what premium?
- What's the average days-on-market for RENTAL listings here right now (not sales)? A rising rental-DOM trend means longer vacancies and softer asking-rent achievability than the comps imply.
- What's the recent tenant-quality profile in this submarket — average credit score on applications, eviction rate, late-payment / NSF rate, and stable-employment percentage? A property-management company in the area should have these aggregated.
- How much new for-sale + rental construction is in the pipeline within 1–3 miles? Heavy new supply typically softens prices + rents 12–24 months out; constrained supply supports both.
Investment metrics
- 1% rule
- 0.87% ✗
- Cap rate
- 7.25%
- Cash-on-cash
- 3.43%
- DSCR
- 1.15
- GRM
- 9.5
CMA / ARV
- ARV (on-the-fly)
- $162,400
- Comps found
- 12
Show comp detail 12 sales within ~0.75 mi
| Address | Dist | Beds/Ba | Sqft | Sold | Price | $/sf | Match |
|---|---|---|---|---|---|---|---|
| 1624 Hemlock Ct | 0.22mi | 3/1.0 (-1) | 1,376 (-2%) | 2mo | $32,500 | $24 | 76 |
| 1415 S 28th St | 0.57mi | 3/2.0 (-1) | 1,384 (-1%) | 2mo | $190,000 | $137 | 65 |
| 1448 Catalpa St | 0.45mi | 4/1.5 | 1,507 (+8%) | 1mo | $199,000 | $132 | 64 |
| 1456 Beech St | 0.41mi | 3/1.5 (-1) | 1,498 (+7%) | 2mo | $130,000 | $87 | 60 |
| 1544 Catalpa St | 0.29mi | 4/2.5 | 1,596 (+14%) | 1mo | $185,000 | $116 | 60 |
| 2307 W Lee St | 0.53mi | 4/2.0 | 1,600 (+14%) | 4mo | $172,000 | $108 | 49 |
| 1334 Cypress St | 0.74mi | 3/2.0 (-1) | 1,491 (+6%) | 2mo | $195,000 | $131 | 48 |
| 1608 Russell Lee Dr | 0.66mi | 3/2.5 (-1) | 1,326 (-5%) | 8mo | $175,000 | $132 | 47 |
| 1419 S 28th St | 0.56mi | 4/2.0 | 1,203 (-14%) | 6mo | $100,000 | $83 | 46 |
| 2136 W Gaulbert Ave | 0.60mi | 4/1.5 | 1,210 (-14%) | 6mo | $92,000 | $76 | 43 |
| 3217 Kirby Ave | 0.70mi | 5/2.0 (+1) | 1,505 (+8%) | 9mo | $92,500 | $61 | 42 |
| 2315 S 37th St | 0.61mi | 3/1.0 (-1) | 1,204 (-14%) | 2mo | $159,000 | $132 | 38 |
Match score weights: distance 35% · size 25% · config 20% · recency 20%. Top-matched comps best support the ARV.
Projected returns pro-forma
10.0% appreciation · 8.0% rent growth · sell at horizon
- IRR
- 28.5%
- Equity multiple
- 3.29×
- Total profit
- $101,972
- Equity at exit
- $143,240
- IRR
- 26.1%
- Equity multiple
- 8.01×
- Total profit
- $311,973
- Equity at exit
- $308,902
Cash invested: $44,520 (down + closing). Projections, not guarantees.
Landlord ↔ Tenant lean methodology
- Overall (STATE)
- 83 Strongly Landlord-Friendly
- State Kentucky
- 83 Strongly Landlord-Friendly · R+16
- County
- — inherits STATE
- City
- — inherits STATE
ZIP-level market 40210
- Home prices YoY
- 12.1%
- Rents YoY
- 8.1%
- Active inventory
- 91
- Price-to-rent
- 9.5×
Monthly cashflow live
- Estimated rent
- $1,388 high interval (Pro) →
- Mortgage (P&I)
- −$834
- Tax from tax record
- −$69 /mo · $829/yr
- Insurance
- −$66
- HOA
- −$0
- Vacancy / Maint / Mgmt
- −$291
- Net cashflow
- $127
Break-even live
UW: 25.0% down · 7.5% · 30yr · 1.5% tax · 5.0% vac · 8.0% maint · 8.0% mgmt
Financing live
Cash to close
- Down payment
- $39,750
- Closing costs
- $4,770
- Reserves months
- —
- Total cash needed
- —
Loan-product check · same deal, 3 products live
Conventional
25% down · 7.5% · 30yr
- Down + closing
- —
- Monthly P&I
- —
- Monthly cashflow
- —
- DSCR
- —
- Eligible?
- —
Personal DTI + credit; lowest rate.
DSCR
20% down · 8.5% · 30yr
- Down + closing
- —
- Monthly P&I
- —
- Monthly cashflow
- —
- DSCR
- —
- Eligible?
- —
No personal income docs; deal must DSCR.
Hard money
10% down · 12.0% · 12mo
- Down + closing
- —
- Monthly P&I
- —
- Monthly cashflow
- —
- DSCR
- —
- Eligible?
- —
Short-term bridge; refi at stabilization.
Rent comps 36 comps
| Address | Beds | Baths | Sqft | Rent | $/sqft | DOM | Units | Dist |
|---|---|---|---|---|---|---|---|---|
| 1622 Beech St Louisville, KY | 4.0 | 1.0 | 1108 | $1,445 | $1.30 | 16d | 1 | 0.22mi |
| 2629 Olive St Louisville, KY | 4.0 | 1.0 | 1120 | $1,500 | $1.34 | 23d | 1 | 0.33mi |
| 3313 Penway Ave Louisville, KY | 4.0 | 2.0 | 1142 | $1,645 | $1.44 | 23d | 1 | 0.33mi |
| 1545 Catalpa St Louisville, KY | 4.0 | 1.5 | 1760 | $1,545 | $0.88 | 3d | 1 | 0.33mi |
| 1439 Beech St Apt 1 Louisville, KY | 3.0 | 1.5 | 1000 | $820 | $0.82 | 23d | 1 | 0.49mi |
| 1804 Russell Lee Dr Louisville, KY | 1.0–3.0 | 1.0–1.5 | 810 | $1,304 | $1.61 | 1d | 1 | 0.67mi |
| 1339 S 28th St Unit 3 Louisville, KY | 3.0 | 1.0 | 1125 | $1,175 | $1.04 | 20d | 1 | 0.72mi |
| 2311 Plantation Dr Louisville, KY | 3.0 | 1.0 | 988 | $1,200 | $1.21 | 16d | 1 | 0.77mi |
| 1410 Standard Village Cir Louisville, KY | 3.0 | 2.0 | 1200 | $900 | $0.75 | 23d | 1 | 0.78mi |
| 2913 Dumesnil St Apt 3 Louisville, KY | 3.0 | 1.0 | 1112 | $740 | $0.67 | 10d | 1 | 0.80mi |
| 3215 Virginia Ave Louisville, KY | 3.0 | 1.0 | 975 | $924 | $0.95 | 23d | 1 | 0.91mi |
| 2223 Saint Louis Ave Louisville, KY | 3.0 | 1.5 | 1152 | $1,175 | $1.02 | 23d | 1 | 0.91mi |
| 1155 S 28th St Unit 4 Louisville, KY | 4.0 | 2.0 | 1010 | $1,350 | $1.34 | 23d | 1 | 0.93mi |
| 3611 Regatta Way Louisville, KY | 3.0 | 1.0 | 1035 | $1,450 | $1.40 | 16d | 1 | 0.94mi |
| 1774 Bolling Ave Louisville, KY | 3.0 | 2.0 | 1611 | $1,300 | $0.81 | 10d | 1 | 0.98mi |
| 2706 Hale Ave Unit 1 Louisville, KY | 3.0 | 1.0 | 1100 | $1,400 | $1.27 | 23d | 1 | 0.99mi |
| 1115 S 32nd St Louisville, KY | 3.0 | 1.0 | 1393 | $1,275 | $0.92 | 21d | 1 | 1.02mi |
| 1115 S 32nd St Louisville, KY | 3.0 | 1.0 | 1393 | $1,275 | $0.92 | 23d | 1 | 1.02mi |
| 1731 Sonne Ave Louisville, KY | 3.0 | 1.0 | 1010 | $1,300 | $1.29 | 16d | 1 | 1.09mi |
| 1708 W Gaulbert Ave Louisville, KY | 3.0 | 1.0 | 936 | $975 | $1.04 | 23d | 1 | 1.12mi |
| 1714 W Hill St Louisville, KY | 3.0 | 1.0 | 1050 | $1,045 | $1.00 | 23d | 1 | 1.12mi |
| 3514 Grand Ave Louisville, KY | 3.0 | 1.5 | 1450 | $1,295 | $0.89 | 21d | 1 | 1.13mi |
| 2912 Greenwood Ave Louisville, KY | 3.0 | 2.0 | 1362 | $1,150 | $0.84 | 16d | 1 | 1.14mi |
| 2708 Greenwood Ave Apt 1 Louisville, KY | 3.0 | 1.0 | 1100 | $1,300 | $1.18 | 23d | 1 | 1.17mi |
| 2825 Greenwood Ave #4 Louisville, KY | 3.0 | 1.0 | 1440 | $1,250 | $0.87 | 23d | 1 | 1.18mi |
| 2821 Greenwood Ave #1 Louisville, KY | 3.0 | 1.0 | 1113 | $1,300 | $1.17 | 23d | 1 | 1.18mi |
| 3122 W Kentucky St Louisville, KY | 3.0 | 1.0 | 1030 | $1,150 | $1.12 | 23d | 1 | 1.23mi |
| 2710 W Kentucky St Apt 2 Louisville, KY | 3.0 | 1.0 | 1015 | $1,300 | $1.28 | 23d | 1 | 1.26mi |
| 2711 W Kentucky St Louisville, KY | 3.0 | 1.0 | 1155 | $1,100 | $0.95 | 23d | 1 | 1.30mi |
| 2634 Garland Ave Unit B Louisville, KY | 3.0 | 1.0 | 1152 | $895 | $0.78 | 20d | 1 | 1.37mi |
| 2634 Garland Ave Unit A Louisville, KY | 3.0 | 1.0 | 1152 | $940 | $0.82 | 23d | 1 | 1.37mi |
| 820 Hazel St Louisville, KY | 4.0 | 2.0 | 1872 | $1,395 | $0.75 | 3d | 1 | 1.42mi |
| 2416 Garland Ave Louisville, KY | 3.0 | 2.0 | 1172 | $1,600 | $1.37 | 23d | 1 | 1.43mi |
| 1705 1/2 Hale Ave Louisville, KY | 3.0 | 2.0 | 1257 | $1,400 | $1.11 | 10d | 1 | 1.46mi |
| 1148 S 17th St Unit 2 Louisville, KY | 3.0 | 1.0 | 1000 | $895 | $0.90 | 23d | 1 | 1.47mi |
| 814 S 33rd St Louisville, KY | 3.0 | 1.0 | 1104 | $1,350 | $1.22 | 3d | 1 | 1.47mi |
Listing history 10 events
-
2026-05-04status Pending
-
2026-03-17price $159,000
-
2026-02-26price $169,500
-
2026-02-12status Active
-
2026-02-08historical
-
2026-02-01$179,500 Active
-
2000-03-01historical
-
1999-10-05$37,000
-
1998-05-28soldstatus $35,000 185-char remark
Show marketing remark (185 chars)
SFNW. IMMACULATE! ALARM SYSTEM REMAINS. APPLIANCES MAY STAY - LARGE BACK YARD COMPLETED FENCED. MAINTENANCE FREE, ON CUL-DE-SAC, SHED ON LARGE CONCRETE APRON. 2-10 90-DAY HOME WARRANTY.
-
1998-02-01$35,900 185-char remark
Show marketing remark (185 chars)
SFNW. IMMACULATE! ALARM SYSTEM REMAINS. APPLIANCES MAY STAY - LARGE BACK YARD COMPLETED FENCED. MAINTENANCE FREE, ON CUL-DE-SAC, SHED ON LARGE CONCRETE APRON. 2-10 90-DAY HOME WARRANTY.
ⓘ Source: listings_history table (triggers on properties + properties_extension) + one-shot
backfill from property_details.listing_events for pre-trigger history.
Tax reassessment forecast KY · Resets to sale price
- Current annual tax
- $829 · $69/mo
- Projected year-2 tax
- $1,367 · $114/mo
- Expected delta
- +$539/yr (+$45/mo · 65.0%)
ⓘ Screening estimate from a state-policy table — verify with the county assessor before closing.
Climate risk First Street
- Flood 3/10 Moderate FEMA zone X (unshaded) · 20% chance over 30 yrs
- Wildfire 1/10 Low
- Heat 5/10 Major 7 d/yr ≥104°F today · 18 d/yr by 30 yrs out
- Wind 2/10 Low 100% chance of damaging wind over 30 yrs
- Air quality 2/10 Low 1 unhealthy d/yr today · 3 by 30 yrs out
Nearby sold comps map
Loading sold comps map…
Walkable amenities ~0.75 mi
Loading nearby amenities…
Taxation est. · year 1
- Rental income
- $16,653
- − Mortgage interest
- −$8,906
- − Property taxes
- −$829
- − Insurance
- −$795
- − Repairs & maintenance
- −$1,332
- − Management
- −$1,332
- − Depreciation
- −$4,625
- Taxable loss
- −$1,167
- Est. tax savings @ 24.0%
- +$280
- After-tax cash flow
- $1,807/yr
For passive investors: Depreciation is non-cash, so a rental often shows a tax loss while cash-flowing — sheltering income. Rental losses are passive: they offset passive income freely, and up to $25,000/yr can offset ordinary (W-2) income if you actively participate and your MAGI is under $100k (phasing out to $0 by $150k); unused losses carry forward. On sale, claimed depreciation is recaptured at up to 25%, and gains may owe capital-gains tax (a 1031 exchange can defer both). Figures are a year-1 estimate at your 24.0% rate — not tax advice; consult a CPA.
Schools (NCES district)
- District
- Jefferson County
- NCES district ID
- 2102990
- Math proficiency
- 19% ▼ -17.00%
- Reading proficiency
- 35% ▼ -11.00%
- Median HH income
- $47,885
- Composite
- 23.45/100
- National rank
- #7884
- State rank
- #121 of 165 in KY
Livability — Louisville
- Score
- 63/100
- State rank
- #333
- US rank
- #15887
Category grades
Schools grade is shown separately in the Schools card above.
Census & demographics
- Census place
- Louisville, KY
- County
- Jefferson County · 790,184 people
- City population
- 769,292
- Metro
- Louisville/Jefferson County, KY-IN
- Population (ZIP)
- 13,518
- Household income
- $35,347
- Rent vs Own
- Severe rent burden
- 815.0
Population outlook (Jefferson County) Hauer SSP2
- Today (2025)
- 823,112 people
- By 2030
- 849,343 · +3.2%
- By 2040
- 895,696 · +8.8%
- By 2050
- 933,630 · +13.4%
- By 2075
- 1,028,262 · +24.9%
- By 2100
- 1,072,675 · +30.3%
Race, ethnicity, and origin ACS 2023
- Neighborhood character
- Predominantly Black (84%)
- Race & ethnicity
- Black 84% White 8% Two or more races 5% Hispanic / Latino 3%
- Common ancestry
- Iranian 1%
- Foreign-born
- 4% · Canada
- Languages at home
- 93% English-only · Spanish 3%
Political lean MEDSL · Jefferson
- 2024 margin
- D (+16.6) · D 57.4% · R 40.9% · Other 1.7%
- 2008→2024 swing
- +4.5pp toward D · 2008: 12.0pp · 2024: 16.6pp
- All cycles
- 2024: D+16.6 2020: D+20.1 2016: D+13.3 2012: D+11.1 2008: D+12.0
Not yet ingested
- Civics
- —
Market trends
- HPI YoY
- ▲ 28.45%
- Current HPI
- 264.0146
- Rent YoY
- ▲ 8.05%
- Metro
- Louisville/Jefferson County, KY-IN
- State GDP YoY
- ▲ 1.81%
- F500 in state
- 4
Industry mix (Fortune 500 HQ in KY)
| Industry | F500 HQs | Revenue |
|---|---|---|
| Healthcare | 1 | $118B |
|
||
| Food / Beverage | 1 | $7B |
|
||
Price history
+342.9% since first listed10 events — show timeline
- 2026-05-04 Pending — Metro Search MLS
- 2026-03-17 Price Changed $159,000 Metro Search MLS
- 2026-02-26 Price Changed $169,500 Metro Search MLS
- 2026-02-12 Relisted — Metro Search MLS
- 2026-02-08 Listing Removed — Metro Search MLS
- 2026-02-01 Listed $179,500 Metro Search MLS
- 2000-03-01 Listing Removed — Metro Search MLS
- 1999-10-05 Listed $37,000 Metro Search MLS
- 1998-05-28 Sold (MLS) $35,000 Metro Search MLS
- 1998-02-01 Listed $35,900 Metro Search MLS
Property tax history
+7.9%/yrLatest (2025): $829 · -1.9% YoY. Source: county tax records.
Cash-flow waterfall
monthlySold comps — $/sqft
last 12 mo · ≤1 miLoading sold comps…