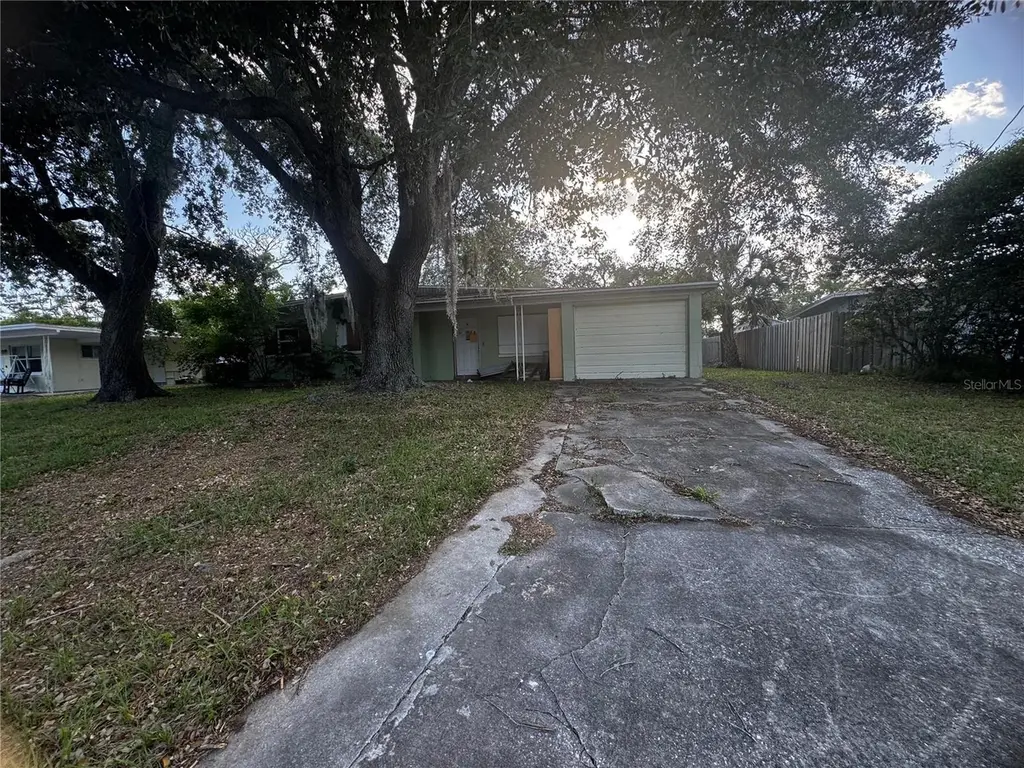
120 N Hilltop Dr · Titusville, FL
Flood risk 1/10 · Minimal
- FEMA flood zone
- X (unshaded)
- Chance of flooding over 30 yrs
- 0.0%
- Est. flood insurance / yr
- $507 – $1,088
Fire risk 5/10 · Moderate
- Est. fire insurance / yr
- $947 – $1,759
Heat risk 10/10 · Severe
- Hot days now (above 108°F)
- 7 days/yr
- Hot days in 30 yrs
- 22 days/yr
Wind risk 10/10 · Severe
- Chance of severe wind over 30 yrs
- 99.0%
Air-quality risk 1/10 · Minimal
- Unhealthy air days now
- 0 days/yr
- Unhealthy air days in 30 yrs
- 0 days/yr
Risk factors via First Street. Map © Google.
Why this score? — see what drove the B grade
The composite is a weighted blend of 9 inputs, each scored 0–100. Each bar is that input's sub-score; the figure is the points it added to the 100-point composite (weight × sub-score).
- Cash flow +30.0/30.0
- DSCR +10.0/10.0
- 1% rule +9.0/10.0
- ARV discount +7.5/15.0
- Schools +4.7/10.0
- Livability +4.2/5.0
- Rent growth +2.6/5.0
- Condition / age +2.5/5.0
- Appreciation +0.0/10.0
$150,000
🖨 Deal sheet (PDF) 📄 Offer letter ✓ Due diligence
Listing remarks MLS
If you are an investor looking for a fixer upper then this is it! Property needs extensive work and has mold inside. Please see property disclosures.
Key facts
- Easy access
- Mature oak trees
- Spacious lot
Tags
Property features AI
Finance
- Other: Zoning: R1B
- Financial info: No investor or income/expense details provided
- HOA & community: No HOA association
Exterior
- Parking: No parking details listed
- Security: No security features listed
- Utilities: Public water; Public sewer; Other utilities
- Home design: Single family residence; Residential property; One story; Faces east; Entry level: One
- Construction: Block construction; Membrane roof; Slab foundation; Built on a 0.24-acre lot (75 x 142)
- Exterior features: Other exterior features; Asphalt road access
Interior
- Kitchen: No appliances listed
- Bedrooms: 1 bedroom
- Flooring: Other flooring
- Bathrooms: 2 full bathrooms
- Heating & cooling: No heating listed; No cooling listed
- Interior features: No interior features listed
- Laundry & utility: No laundry features
Neighborhood map
What this means for you Summary
Snapshot
- This is a 3-bed/2.0-bath other listed at $150k.
Deal economics
- At list price, monthly cash flow is $705 ($8k/yr) — positive.
- The deal already cash-flows at list — no discount required.
- Meets the 1% rule at list price ($2k rent vs $150k).
- Recommended offer: $146k (3.0% below list) — sets the bar for market timing.
Location & tenants
- Location reads 84/100 on livability (#42 in FL, #668 nationally) — a professional / high-income tenant draw. Strengths: commute A+, cost of living A+, housing A+; Watch: schools C-, crime D, employment D.
- Brevard (suburban): math 53% / reading 57% proficiency, ranked #19 of 73 in FL (top 26%) — acceptable for families but not a draw, mixed tenant base, ~2y average lease.
- Market conditions: Rents flat; 256 active listings in the ZIP; 17 comparable units currently listed for rent nearby; rentals at typical pace (median 24d on market — plan ~3-4 weeks tenant-placement turnaround); 4,602 units permitted in Brevard County in 2024 (702 in 5+ unit buildings).
- This rent runs 37% of the median local income ($67k/yr) — at the standard rent-burdened threshold; future hikes will face affordability resistance.
Forward outlook
- Local home prices are declining (-3.0%/yr); year-one equity from $1k of loan paydown is wiped out by about $4k of value loss. Plan a longer hold.
- Brevard County population projected at +15% by 2050 — modest demand growth; plan on rents tracking national, not racing it.
- At projected returns (-3.0% appreciation + 0.6% rent growth), your $42k cash investment doubles in ~8 years — after that, you're playing with house money.
Negotiation context
- It's been on market 34 days — a 3% lower offer ($146k) is reasonable based on typical stale-listing flexibility.
- 4 sale attempts since 16y ago with the ask held roughly flat each time — persistent listings suggest the price (not the market) is what's stuck; bring a comps-based counter.
- Current owner paid $75k; list at $150k implies a 100% gain — meaningful room to come down on a strong offer.
Risks & watch-outs
- Watch-outs: built in 1958 — expect roof / HVAC / electrical / plumbing capex.
- Climate carrying-cost: severe wind risk, 99% chance of damaging wind over 30y; moderate wildfire risk; extreme-heat days projected 7→22/yr by 2055 (HVAC capex compounding) — expect insurance premiums to compound above CPI over the hold.
Questions for the listing agent
- It's been on market 34 days. Have you received any prior offers? Is the seller open to a 3% concession, seller financing, or rate buy-down credit?
- Built in 1958 — when were the roof, HVAC, electrical panel, plumbing, and water heater last replaced?
- Is there a deadline driving the sale (1031 exchange, divorce, estate, relocation)? That informs how much negotiation room exists.
- Crime grade is D in this area — have there been break-ins, vandalism, or insurance claims at this property in the last 3 years? What carrier currently insures it and at what premium?
- What's the average days-on-market for RENTAL listings here right now (not sales)? A rising rental-DOM trend means longer vacancies and softer asking-rent achievability than the comps imply.
- What's the recent tenant-quality profile in this submarket — average credit score on applications, eviction rate, late-payment / NSF rate, and stable-employment percentage? A property-management company in the area should have these aggregated.
- How much new for-sale + rental construction is in the pipeline within 1–3 miles? Heavy new supply typically softens prices + rents 12–24 months out; constrained supply supports both.
Investment metrics
- 1% rule
- 1.40% ✓
- Cap rate
- 11.93%
- Cash-on-cash
- 20.14%
- DSCR
- 1.90
- GRM
- 5.9
CMA / ARV
No comps found within radius.
Projected returns pro-forma
-3.0% appreciation · 0.59% rent growth · sell at horizon
- IRR
- 9.7%
- Equity multiple
- 1.37×
- Total profit
- $15,588
- Equity at exit
- $22,365
- IRR
- 16.8%
- Equity multiple
- 2.23×
- Total profit
- $51,833
- Equity at exit
- $12,969
Cash invested: $42,000 (down + closing). Projections, not guarantees.
Landlord ↔ Tenant lean methodology
- Overall (STATE)
- 87 Strongly Landlord-Friendly
- State Florida
- 87 Strongly Landlord-Friendly · R+3
- County
- — inherits STATE
- City
- — inherits STATE
ZIP-level market 32796
- Rents YoY
- 0.6%
- Active inventory
- 256
- Price-to-rent
- 5.9×
Monthly cashflow live
- Estimated rent
- $2,104 high interval (Pro) →
- Mortgage (P&I)
- −$787
- Tax from tax record
- −$108 /mo · $1,295/yr
- Insurance
- −$62
- HOA
- −$0
- Vacancy / Maint / Mgmt
- −$442
- Net cashflow
- $705
Break-even live
Sensitivity live
| Price | -10% $790 | -5% $747 | +0% $705 | +5% $662 | +10% $620 |
|---|---|---|---|---|---|
| Rent | -10% $539 | -5% $622 | +0% $705 | +5% $788 | +10% $871 |
| Rate | -1.0pp $780 | -0.5pp $743 | base $705 | +0.5pp $666 | +1.0pp $626 |
UW: 25.0% down · 7.5% · 30yr · 1.5% tax · 5.0% vac · 8.0% maint · 8.0% mgmt
Financing live
Cash to close
- Down payment
- $37,500
- Closing costs
- $4,500
- Reserves months
- —
- Total cash needed
- —
Loan-product check · same deal, 3 products live
Conventional
25% down · 7.5% · 30yr
- Down + closing
- —
- Monthly P&I
- —
- Monthly cashflow
- —
- DSCR
- —
- Eligible?
- —
Personal DTI + credit; lowest rate.
DSCR
20% down · 8.5% · 30yr
- Down + closing
- —
- Monthly P&I
- —
- Monthly cashflow
- —
- DSCR
- —
- Eligible?
- —
No personal income docs; deal must DSCR.
Hard money
10% down · 12.0% · 12mo
- Down + closing
- —
- Monthly P&I
- —
- Monthly cashflow
- —
- DSCR
- —
- Eligible?
- —
Short-term bridge; refi at stabilization.
Rent comps 17 comps
| Address | Beds | Baths | Sqft | Rent | $/sqft | DOM | Units | Dist |
|---|---|---|---|---|---|---|---|---|
| 102 S Christmas Hill Rd Titusville, FL | 3.0 | 2.0 | 1304 | $2,300 | $1.76 | 15d | 1 | 0.19mi |
| 102 S Christmas Hill Rd Titusville, FL | 3.0 | 2.0 | 1304 | $2,200 | $1.69 | 24d | 1 | 0.19mi |
| 583 Gardenia Cir Titusville, FL | 3.0 | 2.0 | 1120 | $1,800 | $1.61 | 24d | 1 | 0.41mi |
| 265 W Towne Pl Titusville, FL | 2.0 | 1.0 | 1128 | $1,650 | $1.46 | 24d | 1 | 0.48mi |
| 292 W Towne Pl Titusville, FL | 2.0 | 2.5 | 1242 | $1,450 | $1.17 | 14d | 1 | 0.50mi |
| 2008 Vaughn St Titusville, FL | 3.0 | 1.5 | 1198 | $1,850 | $1.54 | 24d | 1 | 0.73mi |
| 3315 Casi Dr Titusville, FL | 3.0 | 2.0 | 2132 | $2,700 | $1.27 | 24d | 1 | 0.76mi |
| 945 Luna Ter Titusville, FL | 4.0 | 2.0 | 1863 | $2,600 | $1.40 | 24d | 1 | 0.77mi |
| 609 Ward Ave Titusville, FL | 3.0 | 2.0 | 1200 | $1,950 | $1.62 | 24d | 1 | 0.81mi |
| 965 N Singleton Ave Titusville, FL | 3.0 | 2.0 | 1493 | $2,250 | $1.51 | 20d | 1 | 0.81mi |
| 2745 Starlight Dr Titusville, FL | 3.0 | 2.0 | 1232 | $1,800 | $1.46 | 24d | 1 | 0.85mi |
| 3007 Telka Lynn Dr Titusville, FL | 3.0 | 2.0 | 1560 | $2,400 | $1.54 | 24d | 1 | 0.89mi |
| 1795 S Lilac Cir Titusville, FL | 3.0 | 2.0 | 1584 | $2,000 | $1.26 | 24d | 1 | 0.90mi |
| 1105 Morse Ave Titusville, FL | 3.0 | 2.0 | 1218 | $1,995 | $1.64 | 24d | 1 | 0.97mi |
| 1340 Sharon Dr Titusville, FL | 3.0 | 2.0 | 1872 | $2,516 | $1.34 | 14d | 1 | 1.20mi |
| 5 N Deleon Ave Unit Sfr Titusville, FL | 3.0 | 1.0 | 2168 | $1,700 | $0.78 | 24d | 1 | 1.37mi |
| 660 Minnie St Titusville, FL | 3.0 | 1.5 | 1860 | $1,500 | $0.81 | 24d | 1 | 1.50mi |
Listing history 25 events
-
2026-06-18days on market $150,000 Active 34 DOM
-
2026-06-17days on market $150,000 Active 33 DOM
-
2026-06-16days on market $150,000 Active 32 DOM
-
2026-06-15days on market $150,000 Active 31 DOM
-
2026-06-14days on market $150,000 Active 29 DOM
-
2026-06-10days on market $150,000 Active 26 DOM
-
2026-06-08days on market $150,000 Active 24 DOM
-
2026-06-07days on market $150,000 Active 23 DOM
-
2026-06-05days on market $150,000 Active 20 DOM
-
2026-06-03days on market $150,000 Active 19 DOM
-
2026-06-02days on market $150,000 Active 18 DOM
-
2026-06-01days on market $150,000 Active 17 DOM
-
2026-05-31days on market $150,000 Active 16 DOM
-
2026-05-31days on market $150,000 Active 15 DOM
-
2026-05-15$150,000 Active
-
2018-02-28soldstatus $75,000
-
2013-12-30historical 149-char remark
Show marketing remark (149 chars)
If you are an investor looking for a fixer upper then this is it! Property needs extensive work and has mold inside. Please see property disclosures.
-
2013-03-12$31,500 149-char remark
Show marketing remark (149 chars)
If you are an investor looking for a fixer upper then this is it! Property needs extensive work and has mold inside. Please see property disclosures.
-
2012-07-13soldstatus $14,000 109-char remark
Show marketing remark (109 chars)
FIXER UPPER BEING SOLD AS-IS. 3 BEDROOMS, 2 BATHS. HOME NEEDS EXTENSIVE WORK. MOLD AND OTHER HAZARDS ON SITE.
-
2012-06-14$15,000 109-char remark
Show marketing remark (109 chars)
FIXER UPPER BEING SOLD AS-IS. 3 BEDROOMS, 2 BATHS. HOME NEEDS EXTENSIVE WORK. MOLD AND OTHER HAZARDS ON SITE.
-
2010-10-29soldstatus $9,900
-
2010-09-10$9,900
-
1996-11-07soldstatus $68,900
-
1993-07-15soldstatus $62,542
-
1974-09-01soldstatus $18,500
ⓘ Source: listings_history table (triggers on properties + properties_extension) + one-shot
backfill from property_details.listing_events for pre-trigger history.
Tax reassessment forecast FL · Resets to sale price
- Current annual tax
- $1,295 · $108/mo
- Projected year-2 tax
- $1,295 · $108/mo
- Expected delta
- $0/yr ($0/mo · 0.0%)
ⓘ Screening estimate from a state-policy table — verify with the county assessor before closing.
Climate risk First Street
- Flood 1/10 Low FEMA zone X (unshaded) · 0% chance over 30 yrs
- Wildfire 5/10 Major
- Heat 10/10 Extreme 7 d/yr ≥108°F today · 22 d/yr by 30 yrs out
- Wind 10/10 Extreme 99% chance of damaging wind over 30 yrs
- Air quality 1/10 Low 0 unhealthy d/yr today · 0 by 30 yrs out
Nearby sold comps map
Loading sold comps map…
Walkable amenities ~0.75 mi
Loading nearby amenities…
Taxation est. · year 1
- Rental income
- $25,244
- − Mortgage interest
- −$8,402
- − Property taxes
- −$1,295
- − Insurance
- −$750
- − Repairs & maintenance
- −$2,020
- − Management
- −$2,020
- − Depreciation
- −$4,364
- Taxable income
- $6,394
- Est. tax owed @ 24.0%
- −$1,535
- After-tax cash flow
- $6,924/yr
For passive investors: Depreciation is non-cash, so a rental often shows a tax loss while cash-flowing — sheltering income. Rental losses are passive: they offset passive income freely, and up to $25,000/yr can offset ordinary (W-2) income if you actively participate and your MAGI is under $100k (phasing out to $0 by $150k); unused losses carry forward. On sale, claimed depreciation is recaptured at up to 25%, and gains may owe capital-gains tax (a 1031 exchange can defer both). Figures are a year-1 estimate at your 24.0% rate — not tax advice; consult a CPA.
Schools (NCES district)
- District
- Brevard
- NCES district ID
- 1200150
- Math proficiency
- 53% ▼ -9.00%
- Reading proficiency
- 57% ▼ -4.00%
- Median HH income
- $49,426
- Composite
- 46.86/100
- National rank
- #2370
- State rank
- #19 of 73 in FL
Livability — Titusville
- Score
- 84/100
- State rank
- #42
- US rank
- #668
Category grades
Schools grade is shown separately in the Schools card above.
Census & demographics
- Census place
- Titusville, FL
- County
- Brevard County · 602,871 people
- City population
- 60,286
- Metro
- Palm Bay-Melbourne-Titusville, FL
- Population (ZIP)
- 20,222
- Household income
- $67,491
- Rent vs Own
- Severe rent burden
- 403.0
Population outlook (Brevard County) Hauer SSP2
- Today (2025)
- 623,254 people
- By 2030
- 648,420 · +4.0%
- By 2040
- 690,009 · +10.7%
- By 2050
- 715,669 · +14.8%
- By 2075
- 775,744 · +24.5%
- By 2100
- 776,687 · +24.6%
Race, ethnicity, and origin ACS 2023
- Neighborhood character
- Predominantly White (81%)
- Race & ethnicity
- White 81% Black 8% Hispanic / Latino 6% Two or more races 4%
- Hispanic origin (detail)
- Puerto Rican 3%
- Common ancestry
- Romanian 3% Italian 3% Slovak 2%
- Foreign-born
- 3% · Canada
- Languages at home
- 94% English-only · Spanish 5%
Political lean MEDSL · Brevard
- 2024 margin
- Strong R (+20.8) · D 39.1% · R 59.9% · Other 1.0%
- 2008→2024 swing
- -10.4pp toward R · 2008: -10.4pp · 2024: -20.8pp
- All cycles
- 2024: R+20.8 2020: R+16.4 2016: R+19.8 2012: R+12.7 2008: R+10.4
Not yet ingested
- Civics
- —
Market trends
- HPI YoY
- ▼ -172.25%
- Current HPI
- 303.5534
- Rent YoY
- ▲ 0.59%
- Metro
- Palm Bay-Melbourne-Titusville, FL
- State GDP YoY
- ▲ 3.28%
- F500 in state
- 36
Industry mix (Fortune 500 HQ in FL)
| Industry | F500 HQs | Revenue |
|---|---|---|
| Industrial Technology | 2 | $29B |
|
||
| Insurance | 2 | $17B |
|
||
| Retail | 1 | $60B |
|
||
| Technology Distribution | 1 | $58B |
|
||
| Homebuilding | 1 | $35B |
|
||
| Technology Manufacturing | 1 | $35B |
|
||
Price history
+710.8% since first listed11 events — show timeline
- 2026-05-15 Listed $150,000 Stellar MLS as Distributed by MLS Grid
- 2018-02-28 Sold (Public Records) $75,000 Public Records
- 2013-12-30 Listing Removed — SCMLS
- 2013-03-12 Listed $31,500 SCMLS
- 2012-07-13 Sold (MLS) $14,000 SCMLS
- 2012-06-14 Listed $15,000 SCMLS
- 2010-10-29 Sold (MLS) $9,900 SCMLS
- 2010-09-10 Listed $9,900 SCMLS
- 1996-11-07 Sold (Public Records) $68,900 Public Records
- 1993-07-15 Sold (Public Records) $62,542 Public Records
- 1974-09-01 Sold (Public Records) $18,500 Public Records
Property tax history
+8.4%/yrLatest (2025): $1,295 · +26.1% YoY. Source: county tax records.
Cash-flow waterfall
monthlySold comps — $/sqft
last 12 mo · ≤1 miLoading sold comps…