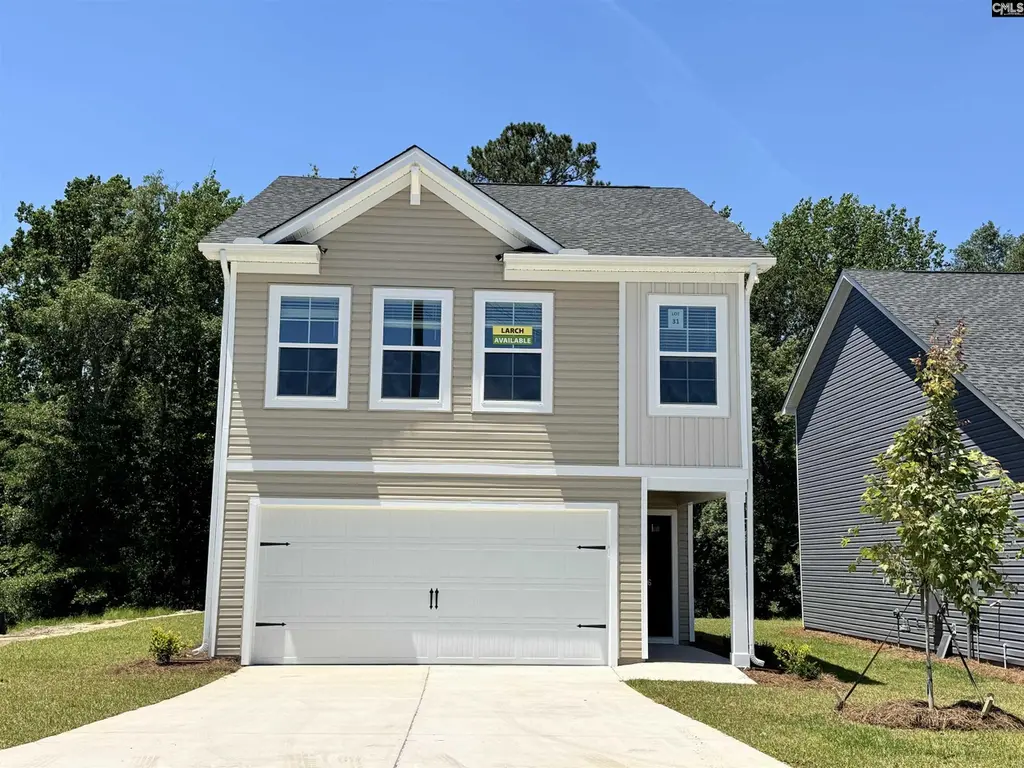
626 Corkscrew Ln · Blythewood, SC
Flood risk 1/10 · Minimal
- FEMA flood zone
- X (unshaded)
- Chance of flooding over 30 yrs
- 0.0%
- Est. flood insurance / yr
- $507 – $1,088
Fire risk 4/10 · Minor
- Est. fire insurance / yr
- $783 – $1,453
Heat risk 6/10 · Moderate
- Hot days now (above 106°F)
- 7 days/yr
- Hot days in 30 yrs
- 16 days/yr
Wind risk 6/10 · Moderate
- Chance of severe wind over 30 yrs
- 64.0%
Air-quality risk 3/10 · Minor
- Unhealthy air days now
- 2 days/yr
- Unhealthy air days in 30 yrs
- 2 days/yr
Risk factors via First Street. Map © Google.
Why this score? — see what drove the D+ grade
The composite is a weighted blend of 9 inputs, each scored 0–100. Each bar is that input's sub-score; the figure is the points it added to the 100-point composite (weight × sub-score).
- Cash flow +17.4/30.0
- ARV discount +7.5/15.0
- DSCR +5.4/10.0
- Condition / age +5.0/5.0
- 1% rule +4.9/10.0
- Schools +3.6/10.0
- Livability +3.5/5.0
- Rent growth +2.5/5.0
- Appreciation +0.0/10.0
$264,990
🖨 Deal sheet 📄 Offer letter ✓ Due diligence
Listing remarks
Discover comfort, style, and convenience in this beautiful new construction home in the desirable Willow Lakes subdivision with community pool and playground. Ideally located with easy access to Interstate 77, this home offers a quick commute to downtown Columbia and surrounding areas. Just minutes away, the vibrant Killian Road Corridor provides a variety of dining, shopping, and everyday essentials. Situated within the highly regarded Richland 2 School District, this property offers access to excellent educational opportunities, adding long-term value. Enjoy the many benefits of new construction, including a modern floor plan, energy-efficient features, brand-new appliances, systems, and
Key facts
- Community pool
- New construction
- Brand-new appliances
Tags
Property features AI
Finance
- HOA & community: Property is part of an association
Exterior
- Parking: Attached garage with 2 garage spaces
- Utilities: Public sewer; Public water
- Home design: Two-story home; Slab foundation
- Construction: Slab foundation
- Exterior features: Stone and vinyl exterior; Paved road access; Public water
Interior
- Kitchen: Kitchen located on main level
- Bedrooms: Master bedroom on second level; Second bedroom on second level
- Bathrooms: Two full bathrooms; One half bathroom; Two additional full second-level bathrooms
- Heating & cooling: Central cooling; Split system cooling; Gas heating on first level; Gas heating on second level; Split system heating
- Interior features: Formal living room on main level; Dining room on main level; Family room on main level; Kitchen on main level
- Laundry & utility: Washer and dryer located on second level
Neighborhood map
What this means for you Summary
Snapshot
- This is a 4-bed/2.5-bath single-family listed at $265k. Condition is rated excellent.
Deal economics
- At list price, monthly cash flow is $200 ($2k/yr) — positive.
- The deal already cash-flows at list — no discount required.
- To meet the 1% rule (rent ≥ 1% of price), the offer needs to be $261k (1.3% below list).
- Recommended offer: $261k (1.3% below list) — sets the bar for 1% rule.
Location & tenants
- Location reads 70/100 on livability (#58 in SC) — a middle-class / working-renter tenant base. Strengths: crime A+, employment A+, housing A+; Watch: amenities F, commute F, health & safety F.
- Richland 02 (suburban): math 35% / reading 47% proficiency, ranked #29 of 80 in SC (top 36%) — families likely to look elsewhere, expect single-tenant / working-renter base with shorter leases.
- Zoned schools: Langford Elementary (math 39% / reading 43%, grade F, #276 of 597 statewide, top 48%, 609 students, 64% FRL); Blythewood High (math 72% / reading 92%, grade A, #19 of 196 statewide, top 10%, 2,094 students, 39% FRL).
- Zoned-school proficiency averages 62% at this address vs 41% district-wide (+20 pts) — the actual schools serving this property are materially stronger than the Richland 02 average implies; a family-tenant draw the district grade alone would hide.
- Market conditions: 650 active listings in the ZIP; 10 comparable units currently listed for rent nearby; rentals leasing fast (median 11d on market — plan ~1-2 weeks tenant-placement turnaround); solid renter incomes; 3,472 units permitted in Richland County in 2024 (1,096 in 5+ unit buildings).
- This rent runs 33% of the median local income ($95k/yr) — at the standard rent-burdened threshold; future hikes will face affordability resistance.
Forward outlook
- Local home prices are declining (-3.0%/yr); year-one equity from $2k of loan paydown is wiped out by about $8k of value loss. Plan a longer hold.
- Richland County population projected at +30% by 2050 — long-run rental-demand tailwind backs the buy-and-hold thesis.
Negotiation context
- Only 13 days on market — expect competitive offers; lowballing is unlikely to land.
Risks & watch-outs
- Climate carrying-cost: major wind risk, 64% chance of damaging wind over 30y; extreme-heat days projected 7→16/yr by 2055 (HVAC capex compounding) — expect insurance premiums to compound above CPI over the hold.
Questions for the listing agent
- What does the HOA fee cover, when was the last increase, and are there any pending special assessments or reserve-fund shortfalls?
- Is there a deadline driving the sale (1031 exchange, divorce, estate, relocation)? That informs how much negotiation room exists.
- Schools are B-rated — typically a magnet for longer-tenancy family renters. What's the average tenant stay here, and is there a school-zone premium baked into asking?
- The area grade is low — what's the realistic commute time and amenity access for the typical tenant pool here? Any planned neighborhood developments (good or bad) we should know about?
- What's the average days-on-market for RENTAL listings here right now (not sales)? A rising rental-DOM trend means longer vacancies and softer asking-rent achievability than the comps imply.
- What's the recent tenant-quality profile in this submarket — average credit score on applications, eviction rate, late-payment / NSF rate, and stable-employment percentage? A property-management company in the area should have these aggregated.
- How much new for-sale + rental construction is in the pipeline within 1–3 miles? Heavy new supply typically softens prices + rents 12–24 months out; constrained supply supports both.
Investment metrics
- 1% rule
- 0.99% ✗
- Cap rate
- 7.20%
- Cash-on-cash
- 3.24%
- DSCR
- 1.14
- GRM
- 8.4
CMA / ARV
No comps found within radius.
Projected returns pro-forma
-3.0% appreciation · 3.0% rent growth · sell at horizon
- IRR
- -11.2%
- Equity multiple
- 0.59×
- Total profit
- $-30,116
- Equity at exit
- $39,511
- IRR
- -1.9%
- Equity multiple
- 0.87×
- Total profit
- $-9,544
- Equity at exit
- $22,911
Cash invested: $74,197 (down + closing). Projections, not guarantees.
Landlord ↔ Tenant lean methodology
- Overall (STATE)
- 90 Strongly Landlord-Friendly
- State South Carolina
- 90 Strongly Landlord-Friendly · R+6
- County
- — inherits STATE
- City
- — inherits STATE
ZIP-level market 29016
- Home prices YoY
- -26.3%
- Active inventory
- 650
- Price-to-rent
- 8.4×
Monthly cashflow live
- Estimated rent
- $2,615 high interval (Pro) →
- Mortgage (P&I)
- −$1,390
- Tax est. 1.5%
- −$331 /mo · $3,975/yr
- Insurance
- −$110
- HOA
- −$34
- Vacancy / Maint / Mgmt
- −$549
- Net cashflow
- $200
Break-even live
UW: 25.0% down · 7.5% · 30yr · 1.5% tax · 5.0% vac · 8.0% maint · 8.0% mgmt
Financing live
Cash to close
- Down payment
- $66,248
- Closing costs
- $7,950
- Reserves months
- —
- Total cash needed
- —
Loan-product check · same deal, 3 products live
Conventional
25% down · 7.5% · 30yr
- Down + closing
- —
- Monthly P&I
- —
- Monthly cashflow
- —
- DSCR
- —
- Eligible?
- —
Personal DTI + credit; lowest rate.
DSCR
20% down · 8.5% · 30yr
- Down + closing
- —
- Monthly P&I
- —
- Monthly cashflow
- —
- DSCR
- —
- Eligible?
- —
No personal income docs; deal must DSCR.
Hard money
10% down · 12.0% · 12mo
- Down + closing
- —
- Monthly P&I
- —
- Monthly cashflow
- —
- DSCR
- —
- Eligible?
- —
Short-term bridge; refi at stabilization.
Rent comps 10 comps
| Address | Beds | Baths | Sqft | Rent | $/sqft | DOM | Units | Dist |
|---|---|---|---|---|---|---|---|---|
| 620 Stono DR Blythewood, SC | 5.0 | 3.0 | 2334 | $2,350 | $1.01 | 14d | 1 | 0.82mi |
| 463 N High Duck Trl Blythewood, SC | 3.0 | 2.5 | 1604 | $2,200 | $1.37 | 3d | 1 | 0.89mi |
| 232 Boulder Ridge Loop Blythewood, SC | 4.0 | 2.5 | 1902 | $2,299 | $1.21 | 14d | 1 | 0.98mi |
| 18 Iron Horse Ct Blythewood, SC | 5.0 | 3.0 | 2245 | $2,539 | $1.13 | 2d | 1 | 1.02mi |
| 254 Boulder Ridge Loop Blythewood, SC | 5.0 | 3.0 | 2245 | $2,539 | $1.13 | 3d | 1 | 1.03mi |
| 242 Honey Hill Way Blythewood, SC | 4.0 | 2.5 | 1926 | $2,750 | $1.43 | 11d | 1 | 1.14mi |
| 227 Honey Hill Way Blythewood, SC | 3.0 | 2.5 | 1689 | $2,180 | $1.29 | 2d | 1 | 1.19mi |
| 948 Beaufort Farm Rd Blythewood, SC | 3.0 | 2.5 | 1986 | $2,200 | $1.11 | 2d | 1 | 1.40mi |
| 25 Oak Lake Ct Blythewood, SC | 4.0 | 2.0 | 2050 | $2,050 | $1.00 | 23d | 1 | 1.46mi |
| 2 Knot Ct Blythewood, SC | 4.0 | 2.5 | 2004 | $2,250 | $1.12 | 23d | 1 | 1.48mi |
HOA detail
- Monthly dues
- $34 · $408/yr
- Likely covers
- pool
Listing history 12 events
-
2026-06-18days on market $264,990 Active 13 DOM
-
2026-06-17days on market $264,990 Active 12 DOM
-
2026-06-16days on market $264,990 Active 11 DOM
-
2026-06-15price $264,990 Active 10 DOM
-
2026-06-15days on market $263,990 Active 10 DOM
-
2026-06-14days on market $263,990 Active 8 DOM
-
2026-06-13days on market $263,990 Active 7 DOM
-
2026-06-10days on market $263,990 Active 5 DOM
-
2026-06-09days on market $263,990 Active 4 DOM
-
2026-06-08days on market $263,990 Active 3 DOM
-
2026-06-07remarks 699-char remark
-
2026-06-07$263,990 Active 2 DOM
ⓘ Source: listings_history table (triggers on properties + properties_extension) + one-shot
backfill from property_details.listing_events for pre-trigger history.
Climate risk First Street
- Flood 1/10 Low FEMA zone X (unshaded) · 0% chance over 30 yrs
- Wildfire 4/10 Moderate
- Heat 6/10 Major 7 d/yr ≥106°F today · 16 d/yr by 30 yrs out
- Wind 6/10 Major 64% chance of damaging wind over 30 yrs
- Air quality 3/10 Moderate 2 unhealthy d/yr today · 2 by 30 yrs out
Nearby sold comps map
Loading sold comps map…
Walkable amenities ~0.75 mi
Loading nearby amenities…
Taxation est. · year 1
- Rental income
- $31,377
- − Mortgage interest
- −$14,844
- − Property taxes
- −$3,975
- − Insurance
- −$1,325
- − Repairs & maintenance
- −$2,510
- − Management
- −$2,510
- − HOA
- −$408
- − Depreciation
- −$7,709
- Taxable loss
- −$1,903
- Est. tax savings @ 24.0%
- +$457
- After-tax cash flow
- $2,862/yr
For passive investors: Depreciation is non-cash, so a rental often shows a tax loss while cash-flowing — sheltering income. Rental losses are passive: they offset passive income freely, and up to $25,000/yr can offset ordinary (W-2) income if you actively participate and your MAGI is under $100k (phasing out to $0 by $150k); unused losses carry forward. On sale, claimed depreciation is recaptured at up to 25%, and gains may owe capital-gains tax (a 1031 exchange can defer both). Figures are a year-1 estimate at your 24.0% rate — not tax advice; consult a CPA.
Condition & rehab AI · 13 photos
This new construction home in Willow Lakes subdivision is in excellent condition with modern finishes and a well-maintained exterior. It offers a great value for both resale and rental markets.
Value-add opportunities
- Both Painting the exterior and interior walls — Fresh paint can enhance curb appeal and interior aesthetics.
- Both Landscaping improvements — Enhanced landscaping can improve curb appeal and attract potential buyers/tenants.
Renovation cost estimate screening
Value-add ROI direction
- Both Painting the exterior and interior walls — Fresh paint can enhance curb appeal and interior aesthetics. ↑
- Both Landscaping improvements — Enhanced landscaping can improve curb appeal and attract potential buyers/tenants. ↑
ⓘ Cost ranges are severity-bucket heuristics (US national rule-of-thumb). Get contractor quotes + a written scope before underwriting a rehab budget.
Schools (NCES district)
- District
- Richland 02
- NCES district ID
- 4503390
- Math proficiency
- 35% ▼ -15.00%
- Reading proficiency
- 47% ▼ -5.00%
- Median HH income
- $59,684
- Composite
- 36.2/100
- National rank
- #4730
- State rank
- #29 of 80 in SC
Livability — Blythewood
- Score
- 70/100
- State rank
- #58
- US rank
- #7406
Category grades
Schools grade is shown separately in the Schools card above.
Census & demographics
- Census place
- Blythewood, SC
- County
- Richland County · 389,530 people
- City population
- 30,454
- Metro
- Columbia, SC
- Population (ZIP)
- 30,454
- Household income
- $95,082
- Rent vs Own
- Severe rent burden
- 559.0
Population outlook (Richland County) Hauer SSP2
- Today (2025)
- 459,667 people
- By 2030
- 487,524 · +6.1%
- By 2040
- 542,035 · +17.9%
- By 2050
- 595,371 · +29.5%
- By 2075
- 732,998 · +59.5%
- By 2100
- 820,415 · +78.5%
Race, ethnicity, and origin ACS 2023
- Neighborhood character
- Diverse neighborhood (Simpson 0.64)
- Race & ethnicity
- Black 43% White 42% Two or more races 7% Hispanic / Latino 7% Asian 3%
- Hispanic origin (detail)
- Mexican 1% Puerto Rican 2%
- Common ancestry
- Lithuanian 2% Romanian 2% Slovak 2%
- Foreign-born
- 5% · Canada, China
- Languages at home
- 90% English-only · Spanish 5% Other Indo-European 1% German/W. Germanic 1%
Political lean MEDSL · Richland
- 2024 margin
- Solid D (+34.6) · D 66.4% · R 31.8% · Other 1.8%
- 2008→2024 swing
- +5.7pp toward D · 2008: 28.9pp · 2024: 34.6pp
- All cycles
- 2024: D+34.6 2020: D+38.3 2016: D+32.9 2012: D+33.3 2008: D+28.9
Not yet ingested
- Civics
- —
Market trends
- HPI YoY
- ▼ -65.48%
- Current HPI
- 183.5933
- Rent YoY
- —
- Metro
- Columbia, SC
- State GDP YoY
- ▲ 4.51%
- F500 in state
- 2
Industry mix (Fortune 500 HQ in SC)
| Industry | F500 HQs | Revenue |
|---|---|---|
| Packaging | 1 | $7B |
|
||
Price history
1 event — show timeline
- 2026-06-05 Listed $263,990 Consolidated MLS
Cash-flow waterfall
monthlySold comps — $/sqft
last 12 mo · ≤1 miLoading sold comps…