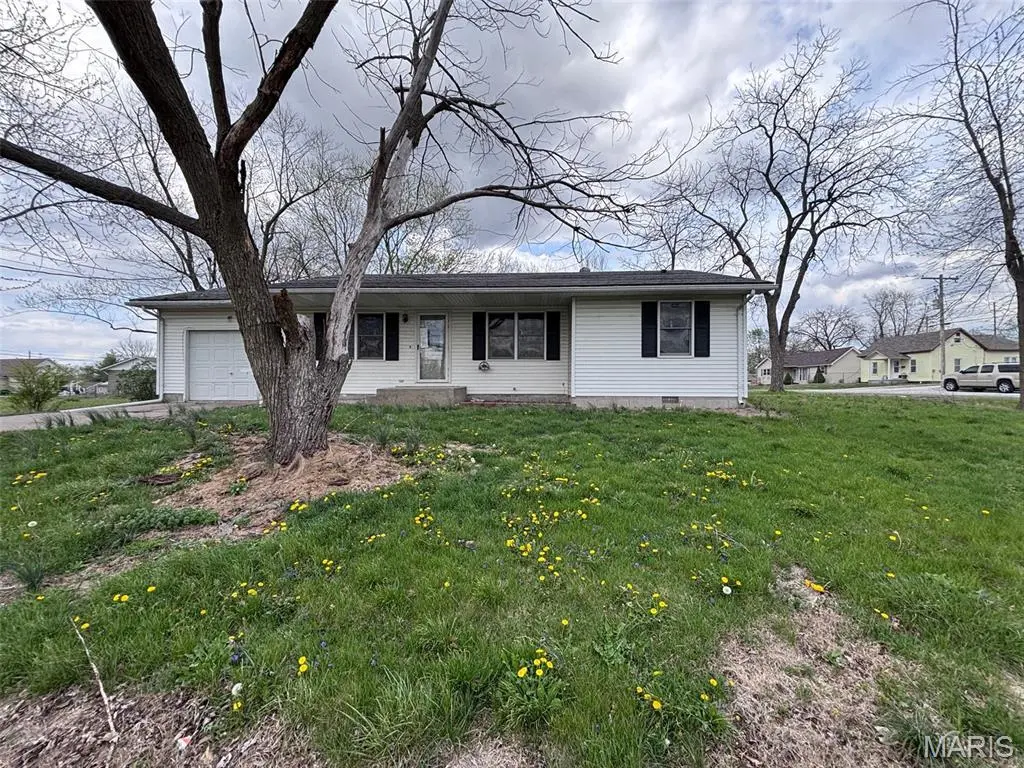
701 Sumner St · Jerseyville, IL
Flood risk 1/10 · Minimal
- FEMA flood zone
- X (unshaded)
- Chance of flooding over 30 yrs
- 0.0%
- Est. flood insurance / yr
- $507 – $1,088
Fire risk 1/10 · Minimal
- Est. fire insurance / yr
- $804 – $1,492
Heat risk 4/10 · Minor
- Hot days now (above 105°F)
- 7 days/yr
- Hot days in 30 yrs
- 20 days/yr
Wind risk 2/10 · Minimal
- Chance of severe wind over 30 yrs
- 1.0%
Air-quality risk 2/10 · Minimal
- Unhealthy air days now
- 0 days/yr
- Unhealthy air days in 30 yrs
- 1 days/yr
Risk factors via First Street. Map © Google.
Why this score? — see what drove the C grade
The composite is a weighted blend of 9 inputs, each scored 0–100. Each bar is that input's sub-score; the figure is the points it added to the 100-point composite (weight × sub-score).
- ARV discount +15.0/15.0
- Cash flow +11.8/30.0
- Appreciation +10.0/10.0
- 1% rule +5.0/10.0
- Livability +3.6/5.0
- DSCR +3.5/10.0
- Rent growth +2.5/5.0
- Schools +2.5/10.0
- Condition / age +2.5/5.0
$83,000
🖨 Deal sheet 📄 Offer letter ✓ Due diligence
Listing remarks
Come take a look at this well maintained Jerseyville home. It features 3 bedrooms, nice living room and kitchen with an attached garage. Home is located close to everything!! With a little love, it will be a great home for someone. For more information, please visit www. hudhomestore. gov. HUD case number 132-279079 INSURED WITH ESCROW. Owned by the US Department of HUD. Seller makes no representations or warranties as to the condition of property. Seller may contribute up to 3% of buyers closing costs upon buyers request. Sold AS-IS. Equal Housing Opportunity.
Key facts
- 5,601 sq ft lot
- Garage
- Built 1990
Neighborhood map
What this means for you Summary
Snapshot
- This is a 3-bed/1.0-bath single-family listed at $83k.
Deal economics
- At list price, monthly cash flow is $-23 ($-279/yr) — negative.
- To cash-flow at today's rent, offer at most $79k (4.9% below list).
- To meet the 1% rule (rent ≥ 1% of price), the offer needs to be $83k (0.1% below list).
- Recommended offer: $79k (4.9% below list) — sets the bar for cash-flow.
- Cap rate 6.0% vs local median 4.6% in Jerseyville — top-decile yield for the area; either an underpriced asset or a hidden risk that comps aren't pricing in. Stress-test before assuming the spread holds.
Location & tenants
- Location reads 72/100 on livability (#327 in IL) — a middle-class / working-renter tenant base. Strengths: cost of living A+, housing A+, crime A; Watch: health & safety C-, amenities D+, commute F.
- Jersey CUSD 100 (town): math 25% / reading 32% proficiency, ranked #260 of 620 in IL (top 42%) — low school quality limits family demand, transient renter base, plan for 1-2y turnover.
- Market conditions: 90 active listings in the ZIP; 2 comparable units currently listed for rent nearby; 101 units permitted in Jersey County in 2024 (68 in 5+ unit buildings).
Forward outlook
- In year one you build about $9k of equity ($574 loan paydown + $8k appreciation (10.0% local appreciation)).
- Jersey County population projected at -24% by 2050 — secular population decline; favor cash flow + early exit over multi-decade hold.
- At projected returns (10.0% appreciation + 3.0% rent growth), your $23k cash investment doubles in ~3 years — after that, you're playing with house money.
- By year 4, paydown + projected appreciation supports a ~$31k cash-out refi (75% LTV) — recoverable capital for the next deal without selling this one.
Negotiation context
- Only 11 days on market — expect competitive offers; lowballing is unlikely to land.
- Current owner paid $48k; list at $83k implies a 75% gain — meaningful room to come down on a strong offer.
Risks & watch-outs
- Watch-outs: property tax is 3.0% of price.
Questions for the listing agent
- What do current leases actually rent for vs. the listed asking? Can we see a recent rent roll and the last 12 months of T-12 income?
- Property tax is high relative to price — has the assessment been appealed recently, and will the sale trigger a re-assessment?
- Is there a deadline driving the sale (1031 exchange, divorce, estate, relocation)? That informs how much negotiation room exists.
- What's the average days-on-market for RENTAL listings here right now (not sales)? A rising rental-DOM trend means longer vacancies and softer asking-rent achievability than the comps imply.
- What's the recent tenant-quality profile in this submarket — average credit score on applications, eviction rate, late-payment / NSF rate, and stable-employment percentage? A property-management company in the area should have these aggregated.
- How much new for-sale + rental construction is in the pipeline within 1–3 miles? Heavy new supply typically softens prices + rents 12–24 months out; constrained supply supports both.
Investment metrics
- 1% rule
- 1.00% ✗
- Cap rate
- 5.96%
- Cash-on-cash
- -1.20%
- DSCR
- 0.95
- GRM
- 8.3
CMA / ARV
- ARV (on-the-fly)
- $147,960
- Comps found
- 12
Show comp detail 12 sales within ~0.75 mi
| Address | Dist | Beds/Ba | Sqft | Sold | Price | $/sf | Match |
|---|---|---|---|---|---|---|---|
| 701 Sumner St | 0.00mi | 3/1.0 | 1,096 (0%) | 1mo | $83,000 | $76 | 99 |
| 403 Fremont St | 0.12mi | 3/2.0 | 1,080 (-2%) | 3mo | $146,000 | $135 | 85 |
| 604 Stryker Ave | 0.11mi | 2/1.0 (-1) | 1,129 (+3%) | 1mo | $55,000 | $49 | 84 |
| 935 Forest St | 0.42mi | 2/1.0 (-1) | 1,132 (+3%) | 1mo | $165,000 | $146 | 69 |
| 405 Pleasant St | 0.26mi | 2/1.0 (-1) | 1,170 (+7%) | 6mo | $57,000 | $49 | 67 |
| 1137 Warren St | 0.74mi | 3/1.0 | 1,097 (+0%) | 2mo | $153,000 | $139 | 64 |
| 405 W Pine St | 0.64mi | 3/1.0 | 1,155 (+5%) | 7mo | $42,500 | $37 | 55 |
| 621 Cleveland St | 0.67mi | 3/1.0 | 1,035 (-6%) | 7mo | $113,500 | $110 | 54 |
| 204 Northmoor Dr | 0.67mi | 3/1.0 | 1,029 (-6%) | 8mo | $163,000 | $158 | 52 |
| 1105 N Giddings Ave | 0.37mi | 2/2.0 (-1) | 1,216 (+11%) | 5mo | $159,900 | $131 | 52 |
| 505 W Spruce St | 0.67mi | 2/2.0 (-1) | 1,117 (+2%) | 7mo | $169,000 | $151 | 50 |
| 506 W Pearl St | 0.74mi | 2/1.0 (-1) | 1,044 (-5%) | 8mo | $179,000 | $171 | 46 |
Match score weights: distance 35% · size 25% · config 20% · recency 20%. Top-matched comps best support the ARV.
Projected returns pro-forma
10.0% appreciation · 3.0% rent growth · sell at horizon
- IRR
- 23.5%
- Equity multiple
- 2.88×
- Total profit
- $43,801
- Equity at exit
- $74,773
- IRR
- 20.9%
- Equity multiple
- 6.61×
- Total profit
- $130,303
- Equity at exit
- $161,251
Cash invested: $23,240 (down + closing). Projections, not guarantees.
Landlord ↔ Tenant lean methodology
- Overall (STATE)
- 43 Moderately Tenant-Leaning
- State Illinois
- 43 Moderately Tenant-Leaning · D+7
- County
- — inherits STATE
- City
- — inherits STATE
ZIP-level market 62052
- Home prices YoY
- 10.2%
- Active inventory
- 90
- Price-to-rent
- 8.3×
Monthly cashflow live
- Estimated rent
- $829 medium interval (Pro) →
- Mortgage (P&I)
- −$435
- Tax from tax record
- −$208 /mo · $2,499/yr
- Insurance
- −$35
- HOA
- −$0
- Vacancy / Maint / Mgmt
- −$174
- Net cashflow
- $-23
Break-even live
UW: 25.0% down · 7.5% · 30yr · 1.5% tax · 5.0% vac · 8.0% maint · 8.0% mgmt
Financing live
Cash to close
- Down payment
- $20,750
- Closing costs
- $2,490
- Reserves months
- —
- Total cash needed
- —
Loan-product check · same deal, 3 products live
Conventional
25% down · 7.5% · 30yr
- Down + closing
- —
- Monthly P&I
- —
- Monthly cashflow
- —
- DSCR
- —
- Eligible?
- —
Personal DTI + credit; lowest rate.
DSCR
20% down · 8.5% · 30yr
- Down + closing
- —
- Monthly P&I
- —
- Monthly cashflow
- —
- DSCR
- —
- Eligible?
- —
No personal income docs; deal must DSCR.
Hard money
10% down · 12.0% · 12mo
- Down + closing
- —
- Monthly P&I
- —
- Monthly cashflow
- —
- DSCR
- —
- Eligible?
- —
Short-term bridge; refi at stabilization.
Rent comps 2 comps
| Address | Beds | Baths | Sqft | Rent | $/sqft | DOM | Units | Dist |
|---|---|---|---|---|---|---|---|---|
| 410 George St Unit K Jerseyville, IL | 2.0 | 1.0 | 800 | $775 | $0.97 | 11d | 1 | 0.50mi |
| 211 W County Rd Jerseyville, IL | 2.0 | 1.0 | 786 | $950 | $1.21 | 2d | 1 | 1.11mi |
Listing history 3 events
-
2026-04-27status Pending
-
2026-04-16$83,000 Active
-
1990-05-01soldstatus $47,500
ⓘ Source: listings_history table (triggers on properties + properties_extension) + one-shot
backfill from property_details.listing_events for pre-trigger history.
Tax reassessment forecast IL · Partial reset (capped growth)
- Current annual tax
- $2,499 · $208/mo
- Projected year-2 tax
- $2,499 · $208/mo
- Expected delta
- $0/yr ($0/mo · 0.0%)
ⓘ Screening estimate from a state-policy table — verify with the county assessor before closing.
Climate risk First Street
- Flood 1/10 Low FEMA zone X (unshaded) · 0% chance over 30 yrs
- Wildfire 1/10 Low
- Heat 4/10 Moderate 7 d/yr ≥105°F today · 20 d/yr by 30 yrs out
- Wind 2/10 Low 100% chance of damaging wind over 30 yrs
- Air quality 2/10 Low 0 unhealthy d/yr today · 1 by 30 yrs out
Nearby sold comps map
Loading sold comps map…
Walkable amenities ~0.75 mi
Loading nearby amenities…
Taxation est. · year 1
- Rental income
- $9,947
- − Mortgage interest
- −$4,649
- − Property taxes
- −$2,499
- − Insurance
- −$415
- − Repairs & maintenance
- −$796
- − Management
- −$796
- − Depreciation
- −$2,415
- Taxable loss
- −$1,622
- Est. tax savings @ 24.0%
- +$389
- After-tax cash flow
- $111/yr
For passive investors: Depreciation is non-cash, so a rental often shows a tax loss while cash-flowing — sheltering income. Rental losses are passive: they offset passive income freely, and up to $25,000/yr can offset ordinary (W-2) income if you actively participate and your MAGI is under $100k (phasing out to $0 by $150k); unused losses carry forward. On sale, claimed depreciation is recaptured at up to 25%, and gains may owe capital-gains tax (a 1031 exchange can defer both). Figures are a year-1 estimate at your 24.0% rate — not tax advice; consult a CPA.
Schools (NCES district)
- District
- Jersey CUSD 100
- NCES district ID
- 1720430
- Math proficiency
- 25% ▼ -10.00%
- Reading proficiency
- 32% ▼ -14.00%
- Median HH income
- $52,066
- Composite
- 25.13/100
- National rank
- #7522
- State rank
- #260 of 620 in IL
Livability — Jerseyville
- Score
- 72/100
- State rank
- #327
- US rank
- #6498
Category grades
Schools grade is shown separately in the Schools card above.
Census & demographics
- Census place
- Jerseyville, IL
- City population
- 12,483
- Population (ZIP)
- 12,483
Population outlook (Jersey County) Hauer SSP2
- Today (2025)
- 21,031 people
- By 2030
- 20,138 · -4.2%
- By 2040
- 18,077 · -14.0%
- By 2050
- 15,882 · -24.5%
- By 2075
- 11,718 · -44.3%
- By 2100
- 8,546 · -59.4%
Race, ethnicity, and origin ACS 2023
- Neighborhood character
- Predominantly White (96%)
- Race & ethnicity
- White 96% Two or more races 4% Hispanic / Latino 2%
- Common ancestry
- Slovak 2% Italian 1% Romanian 1%
- Foreign-born
- 1% · Canada
- Languages at home
- 99% English-only · Spanish 1%
Political lean MEDSL · Jersey
- 2024 margin
- Solid R (+50.2) · D 24.1% · R 74.3% · Other 1.6%
- 2008→2024 swing
- -47.5pp toward R · 2008: -2.7pp · 2024: -50.2pp
- All cycles
- 2024: R+50.2 2020: R+48.1 2016: R+46.4 2012: R+23.9 2008: R+2.7
Not yet ingested
- Civics
- —
Market trends
- HPI YoY
- ▲ 23.63%
- Current HPI
- 255.48
- Rent YoY
- —
- Metro
- —
- State GDP YoY
- ▲ 1.59%
- F500 in state
- 60
Industry mix (Fortune 500 HQ in IL)
| Industry | F500 HQs | Revenue |
|---|---|---|
| Insurance | 4 | $201B |
|
||
| Consumer Goods | 4 | $87B |
|
||
| Industrial Machinery | 3 | $64B |
|
||
| Healthcare | 2 | $55B |
|
||
| Retail / Pharmacy | 1 | $148B |
|
||
| Agriculture / Food | 1 | $86B |
|
||
Price history
+74.7% since first listed3 events — show timeline
- 2026-04-27 Pending — MARIS as Distributed by MLS Grid
- 2026-04-16 Listed $83,000 MARIS as Distributed by MLS Grid
- 1990-05-01 Sold (Public Records) $47,500 Public Records
Property tax history
+6.1%/yrLatest (2024): $2,499 · +30.2% YoY. Source: county tax records.
Cash-flow waterfall
monthlySold comps — $/sqft
last 12 mo · ≤1 miLoading sold comps…