8641 Fab St · Ensley, FL
Flood risk 1/10 · Minimal
- FEMA flood zone
- X (unshaded)
- Chance of flooding over 30 yrs
- 0.0%
- Est. flood insurance / yr
- $507 – $1,088
Fire risk 1/10 · Minimal
- Est. fire insurance / yr
- $947 – $1,759
Heat risk 10/10 · Severe
- Hot days now (above 106°F)
- 6 days/yr
- Hot days in 30 yrs
- 19 days/yr
Wind risk 9/10 · Severe
- Chance of severe wind over 30 yrs
- 99.0%
Air-quality risk 1/10 · Minimal
- Unhealthy air days now
- 0 days/yr
- Unhealthy air days in 30 yrs
- 0 days/yr
Risk factors via First Street. Map © Google.
Why this score? — see what drove the B grade
The composite is a weighted blend of 9 inputs, each scored 0–100. Each bar is that input's sub-score; the figure is the points it added to the 100-point composite (weight × sub-score).
- Cash flow +30.0/30.0
- 1% rule +10.0/10.0
- DSCR +10.0/10.0
- ARV discount +7.5/15.0
- Livability +4.0/5.0
- Schools +3.6/10.0
- Rent growth +2.7/5.0
- Condition / age +2.5/5.0
- Appreciation +0.0/10.0
$90,000
🖨 Deal sheet 📄 Offer letter ✓ Due diligence
Listing remarks
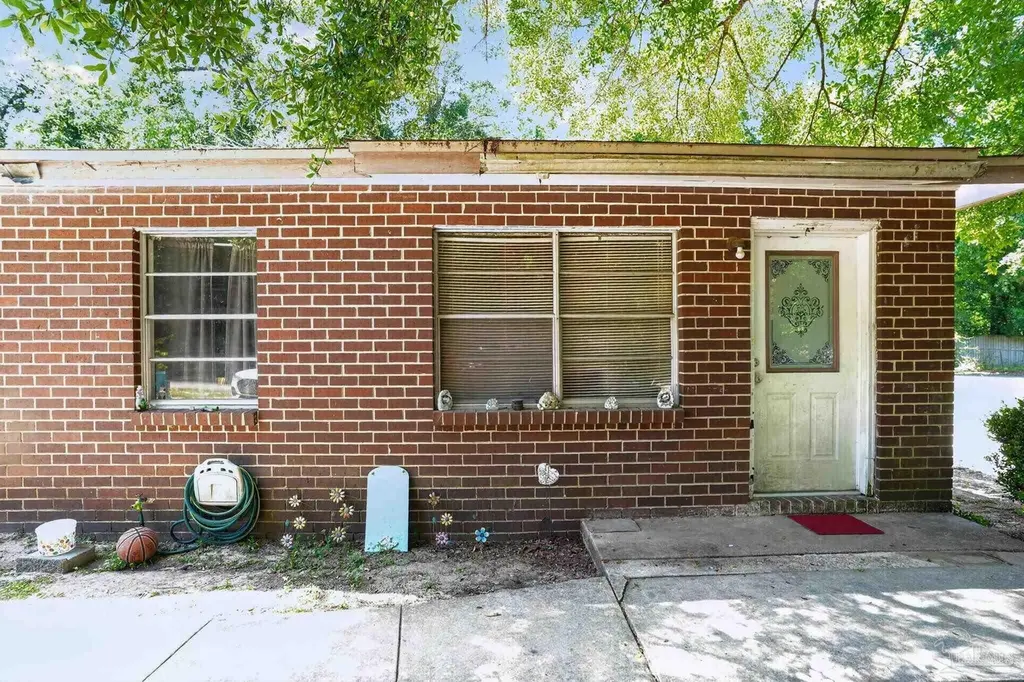
Investor special or great opportunity for a homeowner ready to add value! This 3-bedroom, 1-bath home in Pensacola is currently tenant occupied and provides solid potential with a functional layout and carport parking. The roof was replaced approximately 2 years ago. Great value-add opportunity for investors, flippers, or buyers looking to build equity through improvements. This home is priced to sell, so don't miss out!
Key facts
- Carport parking
- Roof replaced
- 6,534 sq ft lot
Tags
Property features AI
Finance
- Other: County maintained road
- HOA & community: No association
Exterior
- Parking: Carport (1 covered space, total 1 parking space)
- Utilities: Public water; Septic tank sewer
- Home design: One-story property; Resale (not new construction); Not attached to another property; 816 total building area
- Construction: Block, brick, and concrete construction; Slab foundation; Hip composition roof
- Exterior features: Interior lot; No horse privileges
Interior
- Kitchen: Updated kitchen
- Bedrooms: Master bedroom on the first floor (approx. 7 x 7)
- Flooring: Vinyl
- Bathrooms: 1 full bathroom
- Heating & cooling: Central air conditioning; Ceiling fan(s); Floor furnace heating
- Interior features: Ceiling fan(s); Updated bathroom; Updated kitchen
- Laundry & utility: No water heater
Neighborhood map
What this means for you Summary
Snapshot
- This is a 3-bed/1.0-bath single-family listed at $90k.
Deal economics
- At list price, monthly cash flow is $549 ($7k/yr) — positive.
- The deal already cash-flows at list — no discount required.
- Meets the 1% rule at list price ($1k rent vs $90k).
- Cap rate 13.6% vs local median 4.7% in Ensley — top-decile yield for the area; either an underpriced asset or a hidden risk that comps aren't pricing in. Stress-test before assuming the spread holds.
Location & tenants
- Location reads 79/100 on livability (#133 in FL, #1,996 nationally) — a middle-class / working-renter tenant base. Strengths: cost of living A+, housing A+, health & safety A+; Watch: amenities D, employment D, schools F.
- Escambia (suburban): math 40% / reading 45% proficiency, ranked #56 of 73 in FL (top 77%) — families likely to look elsewhere, expect single-tenant / working-renter base with shorter leases.
- Market conditions: Rents flat; 221 active listings in the ZIP; 9 comparable units currently listed for rent nearby; rentals at typical pace (median 24d on market — plan ~3-4 weeks tenant-placement turnaround); 1,479 units permitted in Escambia County in 2024 (0 in 5+ unit buildings).
Forward outlook
- Local home prices are declining (-3.0%/yr); year-one equity from $622 of loan paydown is wiped out by about $3k of value loss. Plan a longer hold.
- Escambia County population projected at +13% by 2050 — modest demand growth; plan on rents tracking national, not racing it.
- At projected returns (-3.0% appreciation + 0.8% rent growth), your $25k cash investment doubles in ~6 years — after that, you're playing with house money.
Negotiation context
- Only 14 days on market — expect competitive offers; lowballing is unlikely to land.
- Current owner paid $14k; list at $90k implies a 543% gain — meaningful room to come down on a strong offer.
Risks & watch-outs
- Climate carrying-cost: severe wind risk, 99% chance of damaging wind over 30y; extreme-heat days projected 6→19/yr by 2055 (HVAC capex compounding) — expect insurance premiums to compound above CPI over the hold.
Questions for the listing agent
- Built in 1967 — when were the roof, HVAC, electrical panel, plumbing, and water heater last replaced?
- Is there a deadline driving the sale (1031 exchange, divorce, estate, relocation)? That informs how much negotiation room exists.
- Schools are F-rated, which usually means shorter tenancies and higher turnover. Who's the typical renter profile here, and what's been the actual vacancy rate?
- What's the average days-on-market for RENTAL listings here right now (not sales)? A rising rental-DOM trend means longer vacancies and softer asking-rent achievability than the comps imply.
- What's the recent tenant-quality profile in this submarket — average credit score on applications, eviction rate, late-payment / NSF rate, and stable-employment percentage? A property-management company in the area should have these aggregated.
- How much new for-sale + rental construction is in the pipeline within 1–3 miles? Heavy new supply typically softens prices + rents 12–24 months out; constrained supply supports both.
Investment metrics
- 1% rule
- 1.63% ✓
- Cap rate
- 13.62%
- Cash-on-cash
- 26.15%
- DSCR
- 2.16
- GRM
- 5.1
CMA / ARV
- ARV (on-the-fly)
- $44,880
- Comps found
- 2
Show comp detail 2 sales within ~0.75 mi
| Address | Dist | Beds/Ba | Sqft | Sold | Price | $/sf | Match |
|---|---|---|---|---|---|---|---|
| 224 Barker St | 0.52mi | 3/1.0 | 768 (-6%) | 8mo | $42,000 | $55 | 59 |
| 8650 Airway Dr | 0.21mi | 2/1.0 (-1) | 744 (-9%) | 16mo | $23,333 | $31 | 57 |
Match score weights: distance 35% · size 25% · config 20% · recency 20%. Top-matched comps best support the ARV.
Projected returns pro-forma
-3.0% appreciation · 0.76% rent growth · sell at horizon
- IRR
- 17.4%
- Equity multiple
- 1.68×
- Total profit
- $17,175
- Equity at exit
- $13,419
- IRR
- 24.2%
- Equity multiple
- 2.88×
- Total profit
- $47,367
- Equity at exit
- $7,782
Cash invested: $25,200 (down + closing). Projections, not guarantees.
Landlord ↔ Tenant lean methodology
- Overall (STATE)
- 87 Strongly Landlord-Friendly
- State Florida
- 87 Strongly Landlord-Friendly · R+3
- County
- — inherits STATE
- City
- — inherits STATE
ZIP-level market 32514
- Home prices YoY
- -31.2%
- Rents YoY
- 0.8%
- Active inventory
- 221
- Price-to-rent
- 5.1×
Monthly cashflow live
- Estimated rent
- $1,467 high interval (Pro) →
- Mortgage (P&I)
- −$472
- Tax from tax record
- −$100 /mo · $1,202/yr
- Insurance
- −$38
- HOA
- −$0
- Vacancy / Maint / Mgmt
- −$308
- Net cashflow
- $549
Break-even live
UW: 25.0% down · 7.5% · 30yr · 1.5% tax · 5.0% vac · 8.0% maint · 8.0% mgmt
Financing live
Cash to close
- Down payment
- $22,500
- Closing costs
- $2,700
- Reserves months
- —
- Total cash needed
- —
Loan-product check · same deal, 3 products live
Conventional
25% down · 7.5% · 30yr
- Down + closing
- —
- Monthly P&I
- —
- Monthly cashflow
- —
- DSCR
- —
- Eligible?
- —
Personal DTI + credit; lowest rate.
DSCR
20% down · 8.5% · 30yr
- Down + closing
- —
- Monthly P&I
- —
- Monthly cashflow
- —
- DSCR
- —
- Eligible?
- —
No personal income docs; deal must DSCR.
Hard money
10% down · 12.0% · 12mo
- Down + closing
- —
- Monthly P&I
- —
- Monthly cashflow
- —
- DSCR
- —
- Eligible?
- —
Short-term bridge; refi at stabilization.
Rent comps 9 comps
| Address | Beds | Baths | Sqft | Rent | $/sqft | DOM | Units | Dist |
|---|---|---|---|---|---|---|---|---|
| 8733 Chisholm Rd Pensacola, FL | 3.0 | 1.0 | 1030 | $1,300 | $1.26 | 23d | 1 | 0.65mi |
| 288 E Olive Rd Pensacola, FL | 1.0–2.0 | 1.0 | 750 | $1,045 | $1.39 | 23d | 2 | 0.70mi |
| 8440 Chisholm Rd Unit B Pensacola, FL | 3.0 | 2.0 | 1112 | $1,525 | $1.37 | 23d | 1 | 0.74mi |
| 50 E Ensley St Unit A Pensacola, FL | 3.0 | 2.0 | 840 | $1,150 | $1.37 | 13d | 1 | 0.79mi |
| 1015 Sable Dr Unit B Pensacola, FL | 2.0 | 2.0 | 962 | $1,300 | $1.35 | 13d | 1 | 0.87mi |
| 1040 Sable Dr Unit c Pensacola, FL | 2.0 | 1.5 | 1005 | $1,200 | $1.19 | 13d | 1 | 0.93mi |
| 130 E 9 Mile Rd #5 Pensacola, FL | 2.0 | 1.0 | 925 | $1,095 | $1.18 | 23d | 1 | 1.25mi |
| 1040 E Olive Rd Pensacola, FL | 1.0–3.0 | 1.0–2.0 | 897 | $1,644 | $1.83 | 23d | 7 | 1.27mi |
| 8660 Figland Ave Pensacola, FL | 3.0 | 2.0 | 1106 | $1,550 | $1.40 | 13d | 1 | 1.47mi |
Listing history 10 events
-
2026-06-08days on market $90,000 Active 14 DOM
-
2026-06-07days on market $90,000 Active 13 DOM
-
2026-06-03days on market $90,000 Active 9 DOM
-
2026-06-02days on market $90,000 Active 8 DOM
-
2026-06-01pricedays on market $90,000 Active 7 DOM
-
2026-05-31days on market $99,900 Active 6 DOM
-
2026-05-31days on market $99,900 Active 5 DOM
-
2026-05-21$99,900 Active
-
1995-05-25soldstatus $14,000
-
1983-04-01soldstatus $22,700
ⓘ Source: listings_history table (triggers on properties + properties_extension) + one-shot
backfill from property_details.listing_events for pre-trigger history.
Tax reassessment forecast FL · Resets to sale price
- Current annual tax
- $1,202 · $100/mo
- Projected year-2 tax
- $1,202 · $100/mo
- Expected delta
- $0/yr ($0/mo · 0.0%)
ⓘ Screening estimate from a state-policy table — verify with the county assessor before closing.
Climate risk First Street
- Flood 1/10 Low FEMA zone X (unshaded) · 0% chance over 30 yrs
- Wildfire 1/10 Low
- Heat 10/10 Extreme 6 d/yr ≥106°F today · 19 d/yr by 30 yrs out
- Wind 9/10 Extreme 99% chance of damaging wind over 30 yrs
- Air quality 1/10 Low 0 unhealthy d/yr today · 0 by 30 yrs out
Nearby sold comps map
Loading sold comps map…
Walkable amenities ~0.75 mi
Loading nearby amenities…
Taxation est. · year 1
- Rental income
- $17,603
- − Mortgage interest
- −$5,041
- − Property taxes
- −$1,202
- − Insurance
- −$450
- − Repairs & maintenance
- −$1,408
- − Management
- −$1,408
- − Depreciation
- −$2,618
- Taxable income
- $5,474
- Est. tax owed @ 24.0%
- −$1,314
- After-tax cash flow
- $5,276/yr
For passive investors: Depreciation is non-cash, so a rental often shows a tax loss while cash-flowing — sheltering income. Rental losses are passive: they offset passive income freely, and up to $25,000/yr can offset ordinary (W-2) income if you actively participate and your MAGI is under $100k (phasing out to $0 by $150k); unused losses carry forward. On sale, claimed depreciation is recaptured at up to 25%, and gains may owe capital-gains tax (a 1031 exchange can defer both). Figures are a year-1 estimate at your 24.0% rate — not tax advice; consult a CPA.
Schools (NCES district)
- District
- Escambia
- NCES district ID
- 1200510
- Math proficiency
- 40% ▼ -9.00%
- Reading proficiency
- 45% ▼ -4.00%
- Median HH income
- $44,649
- Composite
- 36.04/100
- National rank
- #4773
- State rank
- #56 of 73 in FL
Livability — Ensley
- Score
- 79/100
- State rank
- #133
- US rank
- #1996
Category grades
Schools grade is shown separately in the Schools card above.
Census & demographics
- Census place
- Ensley, FL
- County
- Escambia County · 301,722 people
- City population
- 15,879
- Metro
- Pensacola-Ferry Pass-Brent, FL
- Population (ZIP)
- 42,447
- Household income
- $66,644
- Rent vs Own
- Severe rent burden
- 1962.0
Population outlook (Escambia County) Hauer SSP2
- Today (2025)
- 334,637 people
- By 2030
- 345,779 · +3.3%
- By 2040
- 364,828 · +9.0%
- By 2050
- 378,514 · +13.1%
- By 2075
- 403,220 · +20.5%
- By 2100
- 386,125 · +15.4%
Race, ethnicity, and origin ACS 2023
- Neighborhood character
- Diverse neighborhood (Simpson 0.55)
- Race & ethnicity
- White 63% Black 22% Two or more races 9% Hispanic / Latino 7% Asian 2%
- Hispanic origin (detail)
- Mexican 2% Puerto Rican 2%
- Common ancestry
- Italian 3% Lithuanian 2% Slovak 2%
- Foreign-born
- 6% · Canada, South Korea
- Languages at home
- 91% English-only · Spanish 5% Other Indo-European 1% Tagalog/Filipino 1%
Political lean MEDSL · Escambia
- 2024 margin
- R (+19.5) · D 39.7% · R 59.2% · Other 1.1%
- 2008→2024 swing
- -0.2pp no change · 2008: -19.3pp · 2024: -19.5pp
- All cycles
- 2024: R+19.5 2020: R+15.1 2016: R+20.6 2012: R+20.6 2008: R+19.3
Not yet ingested
- Civics
- —
Market trends
- HPI YoY
- ▼ -120.99%
- Current HPI
- 266.7408
- Rent YoY
- ▲ 0.76%
- Metro
- Pensacola-Ferry Pass-Brent, FL
- State GDP YoY
- ▲ 3.28%
- F500 in state
- 36
Industry mix (Fortune 500 HQ in FL)
| Industry | F500 HQs | Revenue |
|---|---|---|
| Industrial Technology | 2 | $29B |
|
||
| Insurance | 2 | $17B |
|
||
| Retail | 1 | $60B |
|
||
| Technology Distribution | 1 | $58B |
|
||
| Homebuilding | 1 | $35B |
|
||
| Technology Manufacturing | 1 | $35B |
|
||
Price history
+340.1% since first listed3 events — show timeline
- 2026-05-21 Listed $99,900 PARMLS
- 1995-05-25 Sold (Public Records) $14,000 Public Records
- 1983-04-01 Sold (Public Records) $22,700 Public Records
Property tax history
+7.8%/yrLatest (2025): $1,202 · +13.6% YoY. Source: county tax records.
Cash-flow waterfall
monthlySold comps — $/sqft
last 12 mo · ≤1 miLoading sold comps…