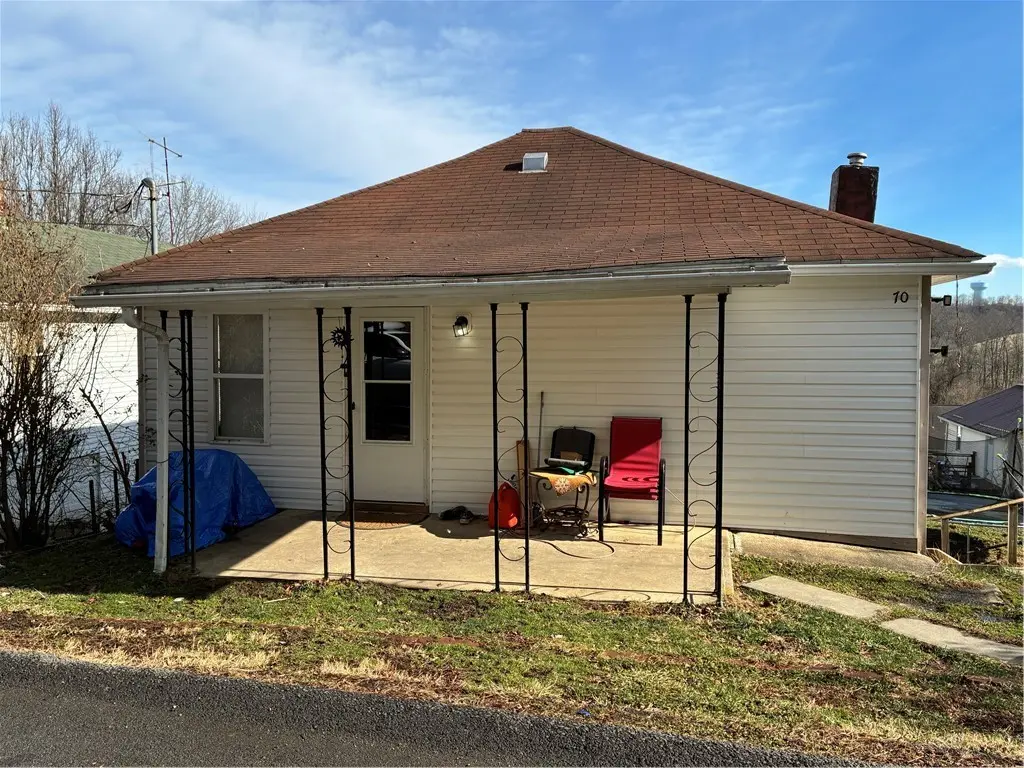
70 South St · Fredericktown, PA
Flood risk 1/10 · Minimal
- FEMA flood zone
- X (unshaded)
- Chance of flooding over 30 yrs
- 0.0%
- Est. flood insurance / yr
- $473 – $860
Fire risk 1/10 · Minimal
- Est. fire insurance / yr
- $511 – $949
Heat risk 3/10 · Minor
- Hot days now (above 97°F)
- 7 days/yr
- Hot days in 30 yrs
- 18 days/yr
Wind risk 2/10 · Minimal
- Chance of severe wind over 30 yrs
- —
Air-quality risk 2/10 · Minimal
- Unhealthy air days now
- 1 days/yr
- Unhealthy air days in 30 yrs
- 2 days/yr
Risk factors via First Street. Map © Google.
Why this score? — see what drove the C- grade
The composite is a weighted blend of 9 inputs, each scored 0–100. Each bar is that input's sub-score; the figure is the points it added to the 100-point composite (weight × sub-score).
- Cash flow +18.4/30.0
- ARV discount +7.5/15.0
- Appreciation +6.7/10.0
- DSCR +5.8/10.0
- 1% rule +4.4/10.0
- Rent growth +2.5/5.0
- Schools +2.5/10.0
- Condition / age +2.5/5.0
- Livability +2.1/5.0
$89,900
🖨 Deal sheet (PDF) 📄 Offer letter ✓ Due diligence
Listing remarks MLS
Why rent when you can buy? Updated, move in ready 2 bedroom, 1 bathroom home on a quiet street with covered front porch. Easy, 1 LEVEL LIVING! Open floorplan with main floor laundry. Attractive kitchen and bathroom. Plenty of natural light throughout. HUGE basement- a must see. Spacious yard and above ground pool with deck.
Key facts
- Covered front porch
- Spacious yard
- Huge basement
Tags
Neighborhood map
What this means for you Summary
Snapshot
- This is a 2-bed/1.0-bath single-family listed at $90k.
Deal economics
- At list price, monthly cash flow is $83 ($998/yr) — positive.
- The deal already cash-flows at list — no discount required.
- To meet the 1% rule (rent ≥ 1% of price), the offer needs to be $84k (6.1% below list).
- Recommended offer: $79k (12.0% below list) — sets the bar for market timing.
Location & tenants
- Location reads 41/100 on livability (#1,736 in PA) — a working-class tenant base; expect higher turnover. Strengths: cost of living A+, crime A; Watch: amenities F, commute F, employment F.
- Bethlehem-Center SD (rural): math 18% / reading 39% proficiency, ranked #448 of 539 in PA (top 83%) — low school quality limits family demand, transient renter base, plan for 1-2y turnover.
- Zoned schools: Bethlehem-Center El Sch (math 24% / reading 50%, grade F, #1,004 of 1,518 statewide, top 68%, 435 students, 49% FRL); Bethlehem-Center Ms (math 3% / reading 29%, grade F, #467 of 512 statewide, top 91%, 242 students, 58% FRL); Bethlehem-Center Shs (math 90%, 302 students, 37% FRL).
- Market conditions: 12 active listings in the ZIP; 489 units permitted in Washington County in 2024 (30 in 5+ unit buildings).
Forward outlook
- In year one you build about $4k of equity ($622 loan paydown + $3k appreciation (3.5% local appreciation)).
- Washington County population projected to shrink 6% by 2050 — rents likely to lag national; underwrite the cash flow, not the appreciation.
- At projected returns (3.5% appreciation + 3.0% rent growth), your $25k cash investment doubles in ~5 years — after that, you're playing with house money.
- By year 9, paydown + projected appreciation supports a ~$32k cash-out refi (75% LTV) — recoverable capital for the next deal without selling this one.
Negotiation context
- It's been on market 148 days — a 12% lower offer ($79k) is reasonable based on typical stale-listing flexibility.
- 2 sale attempts with the ask held roughly flat each time — persistent listings suggest the price (not the market) is what's stuck; bring a comps-based counter.
- Current owner paid $60k; list at $90k implies a 51% gain — meaningful room to come down on a strong offer.
Risks & watch-outs
- Watch-outs: built in 1920 — expect roof / HVAC / electrical / plumbing capex.
Questions for the listing agent
- It's been on market 148 days. Have you received any prior offers? Is the seller open to a 12% concession, seller financing, or rate buy-down credit?
- Built in 1920 — when were the roof, HVAC, electrical panel, plumbing, and water heater last replaced?
- Why hasn't it sold? Are there any deal-killer items the seller is aware of (foundation, flood, title, zoning, code violations)?
- Is there a deadline driving the sale (1031 exchange, divorce, estate, relocation)? That informs how much negotiation room exists.
- Schools are D-rated, which usually means shorter tenancies and higher turnover. Who's the typical renter profile here, and what's been the actual vacancy rate?
- What's the average days-on-market for RENTAL listings here right now (not sales)? A rising rental-DOM trend means longer vacancies and softer asking-rent achievability than the comps imply.
- What's the recent tenant-quality profile in this submarket — average credit score on applications, eviction rate, late-payment / NSF rate, and stable-employment percentage? A property-management company in the area should have these aggregated.
- How much new for-sale + rental construction is in the pipeline within 1–3 miles? Heavy new supply typically softens prices + rents 12–24 months out; constrained supply supports both.
Investment metrics
- 1% rule
- 0.94% ✗
- Cap rate
- 7.40%
- Cash-on-cash
- 3.97%
- DSCR
- 1.18
- GRM
- 8.9
CMA / ARV
- ARV (median comp)
- $54,832
- List price
- $89,900
- Delta
- 63.96%
- Verdict
- OVERPRICED
- Comps
- 4 within 1.0 mi
Projected returns pro-forma
3.45% appreciation · 3.0% rent growth · sell at horizon
- IRR
- 12.4%
- Equity multiple
- 1.73×
- Total profit
- $18,286
- Equity at exit
- $42,728
- IRR
- 14.1%
- Equity multiple
- 3.19×
- Total profit
- $55,034
- Equity at exit
- $67,701
Cash invested: $25,172 (down + closing). Projections, not guarantees.
Landlord ↔ Tenant lean methodology
- Overall (STATE)
- 62 Landlord-Friendly
- State Pennsylvania
- 62 Landlord-Friendly · EVEN
- County
- — inherits STATE
- City
- — inherits STATE
ZIP-level market 15333
- Home prices YoY
- 2.2%
- Active inventory
- 12
- Price-to-rent
- 8.9×
Monthly cashflow live
- Estimated rent
- $844 medium interval (Pro) →
- Mortgage (P&I)
- −$471
- Tax from tax record
- −$75 /mo · $898/yr
- Insurance
- −$37
- HOA
- −$0
- Vacancy / Maint / Mgmt
- −$177
- Net cashflow
- $83
Break-even live
Sensitivity live
| Price | -10% $134 | -5% $109 | +0% $83 | +5% $58 | +10% $32 |
|---|---|---|---|---|---|
| Rent | -10% $17 | -5% $50 | +0% $83 | +5% $117 | +10% $150 |
| Rate | -1.0pp $128 | -0.5pp $106 | base $83 | +0.5pp $60 | +1.0pp $36 |
UW: 25.0% down · 7.5% · 30yr · 1.5% tax · 5.0% vac · 8.0% maint · 8.0% mgmt
Financing live
Cash to close
- Down payment
- $22,475
- Closing costs
- $2,697
- Reserves months
- —
- Total cash needed
- —
Loan-product check · same deal, 3 products live
Conventional
25% down · 7.5% · 30yr
- Down + closing
- —
- Monthly P&I
- —
- Monthly cashflow
- —
- DSCR
- —
- Eligible?
- —
Personal DTI + credit; lowest rate.
DSCR
20% down · 8.5% · 30yr
- Down + closing
- —
- Monthly P&I
- —
- Monthly cashflow
- —
- DSCR
- —
- Eligible?
- —
No personal income docs; deal must DSCR.
Hard money
10% down · 12.0% · 12mo
- Down + closing
- —
- Monthly P&I
- —
- Monthly cashflow
- —
- DSCR
- —
- Eligible?
- —
Short-term bridge; refi at stabilization.
Listing history 17 events
-
2026-06-21days on market $89,900 Active 148 DOM
-
2026-06-18days on market $89,900 Active 145 DOM
-
2026-06-17days on market $89,900 Active 144 DOM
-
2026-06-16days on market $89,900 Active 143 DOM
-
2026-06-15days on market $89,900 Active 142 DOM
-
2026-06-13days on market $89,900 Active 140 DOM
-
2026-06-09days on market $89,900 Active 136 DOM
-
2026-06-08days on market $89,900 Active 135 DOM
-
2026-06-07days on market $89,900 Active 134 DOM
-
2026-06-03days on market $89,900 Active 130 DOM
-
2026-06-02days on market $89,900 Active 129 DOM
-
2026-06-01days on market $89,900 Active 128 DOM
-
2026-05-31days on market $89,900 Active 127 DOM
-
2026-01-24$89,900 Active 327-char remark
Show marketing remark (327 chars)
Why rent when you can buy? Updated, move in ready 2 bedroom, 1 bathroom home on a quiet street with covered front porch. Easy, 1 LEVEL LIVING! Open floorplan with main floor laundry. Attractive kitchen and bathroom. Plenty of natural light throughout. HUGE basement- a must see. Spacious yard and above ground pool with deck.
-
2026-01-06historical Expired 264-char remark
Show marketing remark (264 chars)
Nicely updated 2 bedroom home on a quiet street with covered front porch! Easy 1 level living! Open floor plan with lots of light. HUGE basement with high ceilings and endless possibilities. Spacious yard. Well maintained above ground pool with deck. A must see!
-
2025-01-08$89,900 Active 264-char remark
Show marketing remark (264 chars)
Nicely updated 2 bedroom home on a quiet street with covered front porch! Easy 1 level living! Open floor plan with lots of light. HUGE basement with high ceilings and endless possibilities. Spacious yard. Well maintained above ground pool with deck. A must see!
-
2024-04-15soldstatus $59,568
ⓘ Source: listings_history table (triggers on properties + properties_extension) + one-shot
backfill from property_details.listing_events for pre-trigger history.
Tax reassessment forecast PA · Partial reset (capped growth)
- Current annual tax
- $898 · $75/mo
- Projected year-2 tax
- $1,159 · $97/mo
- Expected delta
- +$261/yr (+$22/mo · 29.1%)
ⓘ Screening estimate from a state-policy table — verify with the county assessor before closing.
Climate risk First Street
- Flood 1/10 Low FEMA zone X (unshaded) · 0% chance over 30 yrs
- Wildfire 1/10 Low
- Heat 3/10 Moderate 7 d/yr ≥97°F today · 18 d/yr by 30 yrs out
- Wind 2/10 Low
- Air quality 2/10 Low 1 unhealthy d/yr today · 2 by 30 yrs out
Nearby sold comps map
Loading sold comps map…
Walkable amenities ~0.75 mi
Loading nearby amenities…
Taxation est. · year 1
- Rental income
- $10,131
- − Mortgage interest
- −$5,036
- − Property taxes
- −$898
- − Insurance
- −$450
- − Repairs & maintenance
- −$810
- − Management
- −$810
- − Depreciation
- −$2,615
- Taxable loss
- −$489
- Est. tax savings @ 24.0%
- +$117
- After-tax cash flow
- $1,116/yr
For passive investors: Depreciation is non-cash, so a rental often shows a tax loss while cash-flowing — sheltering income. Rental losses are passive: they offset passive income freely, and up to $25,000/yr can offset ordinary (W-2) income if you actively participate and your MAGI is under $100k (phasing out to $0 by $150k); unused losses carry forward. On sale, claimed depreciation is recaptured at up to 25%, and gains may owe capital-gains tax (a 1031 exchange can defer both). Figures are a year-1 estimate at your 24.0% rate — not tax advice; consult a CPA.
Schools (NCES district)
- District
- Bethlehem-Center SD
- NCES district ID
- 4203600
- Math proficiency
- 18% ▼ -14.00%
- Reading proficiency
- 39% ▼ -15.00%
- Median HH income
- $49,354
- Composite
- 24.81/100
- National rank
- #7596
- State rank
- #448 of 539 in PA
Livability — Fredericktown
- Score
- 41/100
- State rank
- #1736
- US rank
- #27126
Category grades
Schools grade is shown separately in the Schools card above.
Census & demographics
- Census place
- Fredericktown, PA
- Population (ZIP)
- 1,745
Population outlook (Washington County) Hauer SSP2
- Today (2025)
- 208,060 people
- By 2030
- 207,168 · -0.4%
- By 2040
- 202,738 · -2.6%
- By 2050
- 195,269 · -6.1%
- By 2075
- 175,588 · -15.6%
- By 2100
- 145,827 · -29.9%
Race, ethnicity, and origin ACS 2023
- Neighborhood character
- Predominantly White (92%)
- Race & ethnicity
- White 92% Two or more races 8% Hispanic / Latino 3%
- Common ancestry
- Romanian 5% Serbian 2% Slovak 1%
- Foreign-born
- 2% · Canada
- Languages at home
- 98% English-only · Spanish 2%
Political lean MEDSL · Washington
- 2024 margin
- Strong R (+25.5) · D 36.9% · R 62.4%
- 2008→2024 swing
- -20.8pp toward R · 2008: -4.7pp · 2024: -25.5pp
- All cycles
- 2024: R+25.5 2020: R+22.8 2016: R+25.3 2012: R+13.3 2008: R+4.7
Not yet ingested
- Civics
- —
Market trends
- HPI YoY
- ▲ 3.45%
- Current HPI
- 162.029
- Rent YoY
- —
- Metro
- —
- State GDP YoY
- ▲ 1.68%
- F500 in state
- 34
Industry mix (Fortune 500 HQ in PA)
| Industry | F500 HQs | Revenue |
|---|---|---|
| Healthcare | 2 | $309B |
|
||
| Insurance | 2 | $27B |
|
||
| Telecommunications / Media | 1 | $124B |
|
||
| Industrial Distribution | 1 | $22B |
|
||
| Financial Services | 1 | $20B |
|
||
| Chemicals / Materials | 1 | $18B |
|
||
Price history
+50.9% since first listed4 events — show timeline
- 2026-01-24 Listed $89,900 West Penn MLS
- 2026-01-06 Delisted — West Penn MLS
- 2025-01-08 Listed $89,900 West Penn MLS
- 2024-04-15 Sold (Public Records) $59,568 Public Records
Property tax history
+8.3%/yrLatest (2026): $898 · +3.9% YoY. Source: county tax records.
Cash-flow waterfall
monthlySold comps — $/sqft
last 12 mo · ≤1 miLoading sold comps…