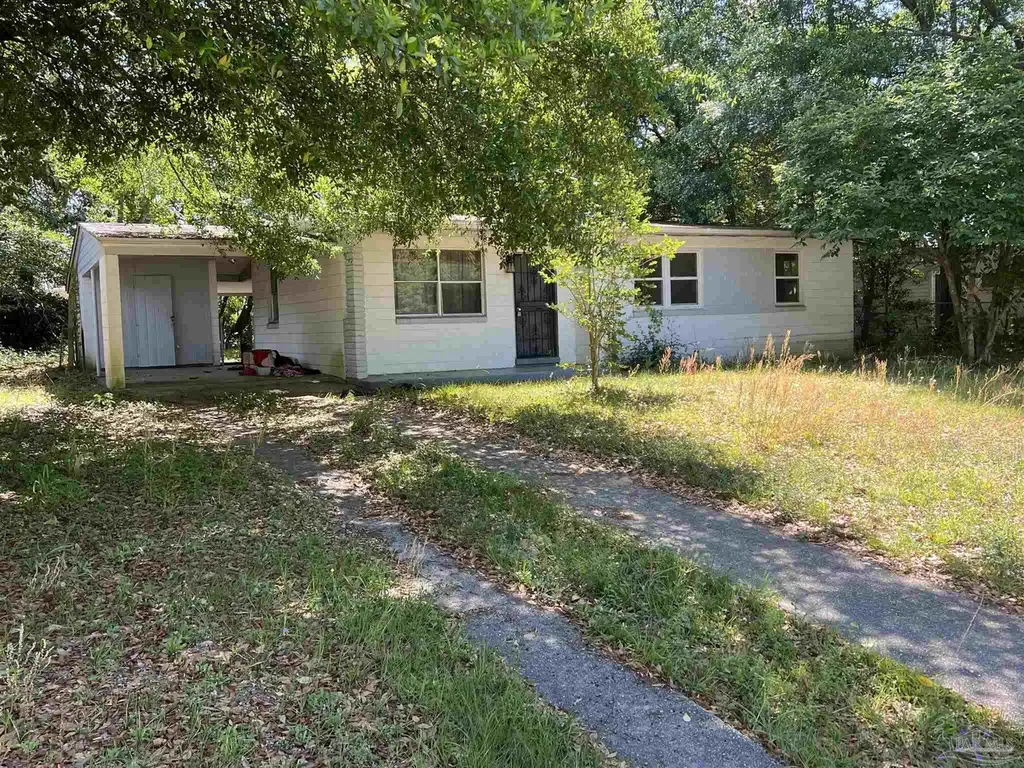
10 Pleasant Ave · West Pensacola, FL
Flood risk 5/10 · Moderate
- FEMA flood zone
- X (unshaded)
- Chance of flooding over 30 yrs
- 0.5%
- Est. flood insurance / yr
- $507 – $1,088
Fire risk 1/10 · Minimal
- Est. fire insurance / yr
- $947 – $1,759
Heat risk 10/10 · Severe
- Hot days now (above 105°F)
- 7 days/yr
- Hot days in 30 yrs
- 22 days/yr
Wind risk 9/10 · Severe
- Chance of severe wind over 30 yrs
- 99.0%
Air-quality risk 1/10 · Minimal
- Unhealthy air days now
- 0 days/yr
- Unhealthy air days in 30 yrs
- 0 days/yr
Risk factors via First Street. Map © Google.
Why this score? — see what drove the B+ grade
The composite is a weighted blend of 9 inputs, each scored 0–100. Each bar is that input's sub-score; the figure is the points it added to the 100-point composite (weight × sub-score).
- Cash flow +30.0/30.0
- ARV discount +15.0/15.0
- 1% rule +10.0/10.0
- DSCR +10.0/10.0
- Rent growth +3.7/5.0
- Schools +3.6/10.0
- Livability +3.3/5.0
- Condition / age +2.5/5.0
- Appreciation +0.0/10.0
$90,000
🖨 Deal sheet 📄 Offer letter ✓ Due diligence
Listing remarks
NICE WORKSHOP AND COVERED PATIO, VINYL SOFFIT
Key facts
- Covered patio
- Vinyl soffit
- Workshop
Tags
Property features AI
Finance
- HOA & community: No association
Exterior
- Parking: One covered parking space; Carport
- Security: Security system
- Utilities: Public water; Septic tank sewer; Electric with circuit breakers and copper wiring; Cable available
- Home design: Single-story block construction; One-level entry
- Construction: Built with block construction; Slab foundation; Composition roof; Green features include insulation, insulated walls, and ridge vent
- Exterior features: Covered porch; Covered patio; Back yard with chain link fencing; County-maintained road access; Central access to the lot
Interior
- Kitchen: Pantry; Refrigerator; Gas water heater
- Bedrooms: Master bedroom on the first floor, approximately 12 x 12; Second bedroom on the first floor, approximately 11 x 11; Third bedroom on the first floor, approximately 11 x 11
- Flooring: Tile; Laminate
- Bathrooms: One full bathroom
- Heating & cooling: Natural gas heating; Central air conditioning; Ceiling fans for additional cooling
- Interior features: Insulated doors; Double-pane windows; Storage; Ceiling fans
- Laundry & utility: Not specified
Neighborhood map
What this means for you Summary
Snapshot
- This is a 3-bed/1.0-bath single-family listed at $90k.
Deal economics
- At list price, monthly cash flow is $621 ($7k/yr) — positive.
- The deal already cash-flows at list — no discount required.
- Meets the 1% rule at list price ($2k rent vs $90k).
- Recommended offer: $87k (3.0% below list) — sets the bar for market timing.
- Cap rate 14.6% vs local median 7.7% in West Pensacola — top-decile yield for the area; either an underpriced asset or a hidden risk that comps aren't pricing in. Stress-test before assuming the spread holds.
Location & tenants
- Location reads 66/100 on livability (#629 in FL) — a middle-class / working-renter tenant base. Strengths: cost of living A+, housing A+, health & safety B+; Watch: crime D, schools F, amenities F.
- Escambia (suburban): math 40% / reading 45% proficiency, ranked #56 of 73 in FL (top 77%) — families likely to look elsewhere, expect single-tenant / working-renter base with shorter leases.
- Market conditions: Rents rising fast (+4.9%/yr); 198 active listings in the ZIP; 16 comparable units currently listed for rent nearby; rentals at typical pace (median 24d on market — plan ~3-4 weeks tenant-placement turnaround); lower-income renter base — watch delinquency; 1,479 units permitted in Escambia County in 2024 (0 in 5+ unit buildings).
- This rent runs 43% of the median local income ($45k/yr) — at the standard rent-burdened threshold; future hikes will face affordability resistance.
Forward outlook
- Local home prices are declining (-3.0%/yr); year-one equity from $622 of loan paydown is wiped out by about $3k of value loss. Plan a longer hold.
- Escambia County population projected at +13% by 2050 — modest demand growth; plan on rents tracking national, not racing it.
- At projected returns (-3.0% appreciation + 4.9% rent growth), your $25k cash investment doubles in ~4 years — after that, you're playing with house money.
Negotiation context
- It's been on market 45 days — a 3% lower offer ($87k) is reasonable based on typical stale-listing flexibility.
- 2 sale attempts with the ask held roughly flat each time — persistent listings suggest the price (not the market) is what's stuck; bring a comps-based counter.
- Current owner paid $38k; list at $90k implies a 136% gain — meaningful room to come down on a strong offer.
Risks & watch-outs
- Watch-outs: built in 1958 — expect roof / HVAC / electrical / plumbing capex.
- Climate carrying-cost: moderate flood risk; severe wind risk, 99% chance of damaging wind over 30y; extreme-heat days projected 7→22/yr by 2055 (HVAC capex compounding) — expect insurance premiums to compound above CPI over the hold.
Questions for the listing agent
- It's been on market 45 days. Have you received any prior offers? Is the seller open to a 3% concession, seller financing, or rate buy-down credit?
- Built in 1958 — when were the roof, HVAC, electrical panel, plumbing, and water heater last replaced?
- Is there a deadline driving the sale (1031 exchange, divorce, estate, relocation)? That informs how much negotiation room exists.
- Schools are F-rated, which usually means shorter tenancies and higher turnover. Who's the typical renter profile here, and what's been the actual vacancy rate?
- Crime grade is D in this area — have there been break-ins, vandalism, or insurance claims at this property in the last 3 years? What carrier currently insures it and at what premium?
- What's the average days-on-market for RENTAL listings here right now (not sales)? A rising rental-DOM trend means longer vacancies and softer asking-rent achievability than the comps imply.
- What's the recent tenant-quality profile in this submarket — average credit score on applications, eviction rate, late-payment / NSF rate, and stable-employment percentage? A property-management company in the area should have these aggregated.
- How much new for-sale + rental construction is in the pipeline within 1–3 miles? Heavy new supply typically softens prices + rents 12–24 months out; constrained supply supports both.
Investment metrics
- 1% rule
- 1.78% ✓
- Cap rate
- 14.57%
- Cash-on-cash
- 29.57%
- DSCR
- 2.32
- GRM
- 4.7
CMA / ARV
- ARV (median comp)
- $177,096
- List price
- $90,000
- Delta
- -49.18%
- Verdict
- UNDERPRICED
- Comps
- 20 within 1.0 mi
Show comp detail 12 sales within ~0.75 mi
| Address | Dist | Beds/Ba | Sqft | Sold | Price | $/sf | Match |
|---|---|---|---|---|---|---|---|
| 2906 W Moreno St | 0.31mi | 3/2.0 | 1,314 (-3%) | 8mo | $113,500 | $86 | 70 |
| 1905 N S St | 0.35mi | 3/1.5 | 1,247 (-8%) | 1mo | $95,000 | $76 | 67 |
| 78 Hunter Ave | 0.17mi | 3/2.0 | 1,188 (-13%) | 1mo | $135,000 | $114 | 66 |
| 2705 W Brainerd St | 0.62mi | 3/2.0 | 1,384 (+2%) | 1mo | $225,000 | $163 | 63 |
| 2312 W Lakeview Ave | 0.46mi | 3/2.0 | 1,425 (+5%) | 7mo | $239,000 | $168 | 61 |
| 2910 W Lee St | 0.44mi | 3/2.0 | 1,272 (-6%) | 7mo | $199,990 | $157 | 59 |
| 3258 Peagler Plaza Rd | 0.72mi | 3/2.0 | 1,310 (-4%) | 5mo | $164,000 | $125 | 52 |
| 1918 W Maxwell St | 0.72mi | 4/2.0 (+1) | 1,299 (-4%) | 8mo | $152,000 | $117 | 43 |
| 3807 W Moreno St | 0.65mi | 4/2.0 (+1) | 1,452 (+7%) | 8mo | $210,000 | $145 | 43 |
| 1009 N U St | 0.71mi | 4/2.0 (+1) | 1,485 (+9%) | 7mo | $172,872 | $116 | 37 |
| 3907 W Blount St | 0.73mi | 3/1.0 | 1,160 (-15%) | 7mo | $150,000 | $129 | 35 |
| 1100 N T St | 0.70mi | 4/2.0 (+1) | 1,520 (+12%) | 8mo | $95,000 | $63 | 32 |
Match score weights: distance 35% · size 25% · config 20% · recency 20%. Top-matched comps best support the ARV.
Projected returns pro-forma
-3.0% appreciation · 4.92% rent growth · sell at horizon
- IRR
- 26.3%
- Equity multiple
- 2.12×
- Total profit
- $28,156
- Equity at exit
- $13,419
- IRR
- 35.1%
- Equity multiple
- 4.53×
- Total profit
- $89,057
- Equity at exit
- $7,782
Cash invested: $25,200 (down + closing). Projections, not guarantees.
Landlord ↔ Tenant lean methodology
- Overall (STATE)
- 87 Strongly Landlord-Friendly
- State Florida
- 87 Strongly Landlord-Friendly · R+3
- County
- — inherits STATE
- City
- — inherits STATE
ZIP-level market 32505
- Home prices YoY
- -26.5%
- Rents YoY
- 4.9%
- Active inventory
- 198
- Price-to-rent
- 4.7×
Monthly cashflow live
- Estimated rent
- $1,602 high interval (Pro) →
- Mortgage (P&I)
- −$472
- Tax from tax record
- −$135 /mo · $1,623/yr
- Insurance
- −$38
- HOA
- −$0
- Vacancy / Maint / Mgmt
- −$336
- Net cashflow
- $621
Break-even live
UW: 25.0% down · 7.5% · 30yr · 1.5% tax · 5.0% vac · 8.0% maint · 8.0% mgmt
Financing live
Cash to close
- Down payment
- $22,500
- Closing costs
- $2,700
- Reserves months
- —
- Total cash needed
- —
Loan-product check · same deal, 3 products live
Conventional
25% down · 7.5% · 30yr
- Down + closing
- —
- Monthly P&I
- —
- Monthly cashflow
- —
- DSCR
- —
- Eligible?
- —
Personal DTI + credit; lowest rate.
DSCR
20% down · 8.5% · 30yr
- Down + closing
- —
- Monthly P&I
- —
- Monthly cashflow
- —
- DSCR
- —
- Eligible?
- —
No personal income docs; deal must DSCR.
Hard money
10% down · 12.0% · 12mo
- Down + closing
- —
- Monthly P&I
- —
- Monthly cashflow
- —
- DSCR
- —
- Eligible?
- —
Short-term bridge; refi at stabilization.
Rent comps 16 comps
| Address | Beds | Baths | Sqft | Rent | $/sqft | DOM | Units | Dist |
|---|---|---|---|---|---|---|---|---|
| 3418 Luke St Pensacola, FL | 4.0 | 2.0 | 1620 | $1,800 | $1.11 | 23d | 1 | 0.48mi |
| 3417 W Fisher St Unit C Pensacola, FL | 3.0 | 2.0 | 1106 | $1,350 | $1.22 | 23d | 1 | 0.58mi |
| 2802 W Gonzalez St Pensacola, FL | 3.0 | 2.0 | 1824 | $1,600 | $0.88 | 23d | 1 | 0.61mi |
| 2108 W Bobe St Pensacola, FL | 4.0 | 2.0 | 1752 | $2,100 | $1.20 | 23d | 1 | 0.62mi |
| 2303 W Brainerd St Pensacola, FL | 2.0 | 1.0 | 955 | $1,100 | $1.15 | 23d | 1 | 0.72mi |
| 852 Garnet St Pensacola, FL | 3.0 | 1.5 | 1150 | $1,150 | $1.00 | 13d | 1 | 0.88mi |
| 419 N Wentworth St Pensacola, FL | 2.0 | 1.0 | 1100 | $1,195 | $1.09 | 23d | 1 | 1.08mi |
| 707 New York Dr Pensacola, FL | 2.0 | 1.0 | 1266 | $1,185 | $0.94 | 23d | 1 | 1.09mi |
| 3740 Frontera Cir Pensacola, FL | 3.0 | 1.0 | 1024 | $1,295 | $1.26 | 23d | 1 | 1.20mi |
| 1717 W Cervantes St Pensacola, FL | 2.0 | 2.0 | 974 | $1,169 | $1.20 | 13d | 3 | 1.21mi |
| 315 N Pace Blvd Unit b Pensacola, FL | 3.0 | 2.0 | 1342 | $1,650 | $1.23 | 23d | 1 | 1.28mi |
| 315 N Pace Blvd Unit A Pensacola, FL | 3.0 | 2.0 | 1342 | $1,850 | $1.38 | 23d | 1 | 1.28mi |
| 309 N Pace Blvd Unit B Pensacola, FL | 3.0 | 2.0 | 1342 | $1,650 | $1.23 | 23d | 1 | 1.30mi |
| 1804 W Belmont St Unit A Pensacola, FL | 3.0 | 1.0 | 925 | $995 | $1.08 | 21d | 1 | 1.34mi |
| 721 W Jordan St Pensacola, FL | 3.0 | 2.0 | 1030 | $1,895 | $1.84 | 23d | 1 | 1.41mi |
| 239 N K St Pensacola, FL | 3.0 | 2.0 | 1392 | $1,950 | $1.40 | 23d | 1 | 1.48mi |
Listing history 11 events
-
2026-06-18days on market $90,000 Active 45 DOM
-
2026-06-17statusdays on market $90,000 Active 44 DOM
-
2026-06-07statusdays on market $90,000 Pending 43 DOM
-
2026-06-03days on market $90,000 Active 41 DOM
-
2026-06-02days on market $90,000 Active 40 DOM
-
2026-06-01days on market $90,000 Active 39 DOM
-
2026-05-31days on market $90,000 Active 38 DOM
-
2026-05-31days on market $90,000 Active 37 DOM
-
2026-04-23$90,000 Active 45-char remark
-
1992-08-01soldstatus $38,100
-
1992-04-01soldstatus $36,400
ⓘ Source: listings_history table (triggers on properties + properties_extension) + one-shot
backfill from property_details.listing_events for pre-trigger history.
Tax reassessment forecast FL · Resets to sale price
- Current annual tax
- $1,623 · $135/mo
- Projected year-2 tax
- $1,623 · $135/mo
- Expected delta
- $0/yr ($0/mo · 0.0%)
ⓘ Screening estimate from a state-policy table — verify with the county assessor before closing.
Climate risk First Street
- Flood 5/10 Major FEMA zone X (unshaded) · 50% chance over 30 yrs
- Wildfire 1/10 Low
- Heat 10/10 Extreme 7 d/yr ≥105°F today · 22 d/yr by 30 yrs out
- Wind 9/10 Extreme 99% chance of damaging wind over 30 yrs
- Air quality 1/10 Low 0 unhealthy d/yr today · 0 by 30 yrs out
Nearby sold comps map
Loading sold comps map…
Walkable amenities ~0.75 mi
Loading nearby amenities…
Taxation est. · year 1
- Rental income
- $19,225
- − Mortgage interest
- −$5,041
- − Property taxes
- −$1,623
- − Insurance
- −$450
- − Repairs & maintenance
- −$1,538
- − Management
- −$1,538
- − Depreciation
- −$2,618
- Taxable income
- $6,416
- Est. tax owed @ 24.0%
- −$1,540
- After-tax cash flow
- $5,911/yr
For passive investors: Depreciation is non-cash, so a rental often shows a tax loss while cash-flowing — sheltering income. Rental losses are passive: they offset passive income freely, and up to $25,000/yr can offset ordinary (W-2) income if you actively participate and your MAGI is under $100k (phasing out to $0 by $150k); unused losses carry forward. On sale, claimed depreciation is recaptured at up to 25%, and gains may owe capital-gains tax (a 1031 exchange can defer both). Figures are a year-1 estimate at your 24.0% rate — not tax advice; consult a CPA.
Schools (NCES district)
- District
- Escambia
- NCES district ID
- 1200510
- Math proficiency
- 40% ▼ -9.00%
- Reading proficiency
- 45% ▼ -4.00%
- Median HH income
- $44,649
- Composite
- 36.04/100
- National rank
- #4773
- State rank
- #56 of 73 in FL
Livability — West Pensacola
- Score
- 66/100
- State rank
- #629
- US rank
- #12275
Category grades
Schools grade is shown separately in the Schools card above.
Census & demographics
- Census place
- West Pensacola, FL
- County
- Escambia County · 301,722 people
- Metro
- Pensacola-Ferry Pass-Brent, FL
- Population (ZIP)
- 27,877
- Household income
- $44,783
- Rent vs Own
- Severe rent burden
- 1458.0
Population outlook (Escambia County) Hauer SSP2
- Today (2025)
- 334,637 people
- By 2030
- 345,779 · +3.3%
- By 2040
- 364,828 · +9.0%
- By 2050
- 378,514 · +13.1%
- By 2075
- 403,220 · +20.5%
- By 2100
- 386,125 · +15.4%
Race, ethnicity, and origin ACS 2023
- Neighborhood character
- Diverse neighborhood (Simpson 0.66)
- Race & ethnicity
- Black 48% White 32% Hispanic / Latino 11% Two or more races 9% Asian 2%
- Hispanic origin (detail)
- Mexican 5% Cuban 2%
- Common ancestry
- Slovak 2% Italian 1% Serbian 1%
- Foreign-born
- 9% · Canada, Vietnam
- Languages at home
- 87% English-only · Spanish 9% Other Indo-European 1% Vietnamese 1%
Political lean MEDSL · Escambia
- 2024 margin
- R (+19.5) · D 39.7% · R 59.2% · Other 1.1%
- 2008→2024 swing
- -0.2pp no change · 2008: -19.3pp · 2024: -19.5pp
- All cycles
- 2024: R+19.5 2020: R+15.1 2016: R+20.6 2012: R+20.6 2008: R+19.3
Not yet ingested
- Civics
- —
Market trends
- HPI YoY
- ▼ -74.10%
- Current HPI
- 205.45
- Rent YoY
- ▲ 4.92%
- Metro
- Pensacola-Ferry Pass-Brent, FL
- State GDP YoY
- ▲ 3.28%
- F500 in state
- 36
Industry mix (Fortune 500 HQ in FL)
| Industry | F500 HQs | Revenue |
|---|---|---|
| Industrial Technology | 2 | $29B |
|
||
| Insurance | 2 | $17B |
|
||
| Retail | 1 | $60B |
|
||
| Technology Distribution | 1 | $58B |
|
||
| Homebuilding | 1 | $35B |
|
||
| Technology Manufacturing | 1 | $35B |
|
||
Price history
+147.3% since first listed5 events — show timeline
- 2026-06-16 Relisted — PARMLS
- 2026-06-05 Pending — PARMLS
- 2026-04-23 Listed $90,000 PARMLS
- 1992-08-01 Sold (Public Records) $38,100 Public Records
- 1992-04-01 Sold (Public Records) $36,400 Public Records
Property tax history
+5.9%/yrLatest (2025): $1,623 · +15.1% YoY. Source: county tax records.
Cash-flow waterfall
monthlySold comps — $/sqft
last 12 mo · ≤1 miLoading sold comps…