 Duplex
629 E 6th St · Salem, OH
Flood risk 1/10 · Minimal
- FEMA flood zone
- X (unshaded)
- Chance of flooding over 30 yrs
- 0.0%
- Est. flood insurance / yr
- $473 – $860
Fire risk 1/10 · Minimal
- Est. fire insurance / yr
- $713 – $1,323
Heat risk 3/10 · Minor
- Hot days now (above 95°F)
- 7 days/yr
- Hot days in 30 yrs
- 18 days/yr
Wind risk 1/10 · Minimal
- Chance of severe wind over 30 yrs
- —
Air-quality risk 2/10 · Minimal
- Unhealthy air days now
- 1 days/yr
- Unhealthy air days in 30 yrs
- 2 days/yr
Risk factors via First Street. Map © Google.
Why this score? — see what drove the C+ grade
The composite is a weighted blend of 9 inputs, each scored 0–100. Each bar is that input's sub-score; the figure is the points it added to the 100-point composite (weight × sub-score).
- Cash flow +26.5/30.0
- DSCR +9.1/10.0
- ARV discount +7.5/15.0
- 1% rule +6.4/10.0
- Schools +4.6/10.0
- Livability +3.4/5.0
- Rent growth +2.5/5.0
- Condition / age +2.5/5.0
- Appreciation +0.0/10.0
$168,520
🖨 Deal sheet (PDF) 📄 Offer letter ✓ Due diligence
Multi-family units
County records classify this as Multi-Family (2-4 Unit). Listing-text estimate: 2 units. confirmed
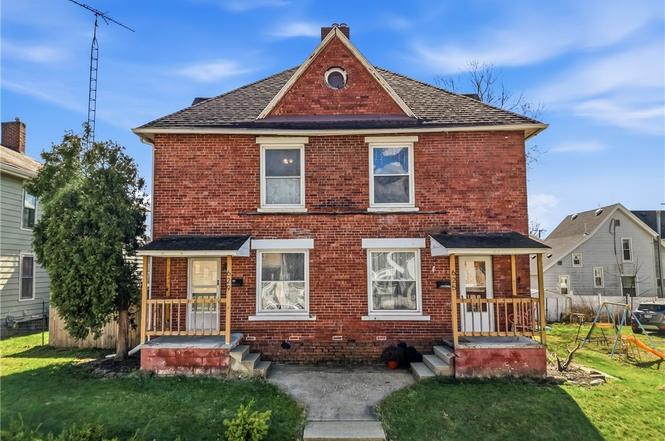
Listing remarks MLS
Brick side-by-side duplex. Great income potential. Each unit has LR, DR, Kitchen, Den or 3rd BD, 1st floor laundry (toilet), 2 BD's & Full Bath. Both units have nice size rooms. 2 car detached garage. 2 New electric panels 2007, Chimney repaired & relined 2009, New gutters with gutter guards 2011, New roof over back addition 2012, New roof to main house 2014. 625 has updated water supply & drains to upstairs bathroom, updated drains in laundry & downstairs bathroom.
Key facts
- Good-sized kitchen
- Formal dining room
- Large living room
Tags
Property features AI
Exterior
- Parking: Detached 2-car garage with alley access
- Utilities: Public water; Public sewer
- Home design: Two stories; Brick construction; Asbestos shingle roof
- Construction: Built (year from public records)
- Exterior features: Wood backyard fence
Interior
- Bedrooms: Two separate three-bedroom units (each unit is three bedrooms)
- Bathrooms: Three full bathrooms and one half bathroom total; Unit breakdown: one unit with 1 bath, the other unit with 2 baths
- Heating & cooling: Central air conditioning; Forced-air gas heating
- Interior features: Full, unfinished basement; 14 total rooms
- Laundry & utility: Main-level laundry
Neighborhood map
What this means for you Summary
Snapshot
- This is a 2 × 3-bed/2.2-bath units multifamily listed at $169k.
Deal economics
- At list price, monthly cash flow is $447 ($5k/yr) — positive. Per door: $224/mo.
- The deal already cash-flows at list — no discount required.
- Meets the 1% rule at list price ($2k rent vs $169k).
- Recommended offer: $158k (6.0% below list) — sets the bar for market timing.
- Cap rate 9.5% vs local median 2.7% in Salem — top-decile yield for the area; either an underpriced asset or a hidden risk that comps aren't pricing in. Stress-test before assuming the spread holds.
Location & tenants
- Location reads 68/100 on livability (#538 in OH) — a middle-class / working-renter tenant base. Strengths: cost of living A+, housing A, crime B; Watch: amenities F, commute F, employment F.
- Salem City (town): math 53% / reading 56% proficiency, ranked #389 of 656 in OH (top 59%) — acceptable for families but not a draw, mixed tenant base, ~2y average lease.
- Zoned schools: Buckeye Elementary School (431 students, 0% FRL); Salem Junior High School (math 51% / reading 52%, grade C, #401 of 654 statewide, top 62%, 310 students, 54% FRL); Salem High School (math 47% / reading 77%, grade B-, #202 of 781 statewide, top 29%, 638 students, 42% FRL) — zoned schools average 32% FRL vs 48% district-wide (17 pts lower); this property's tenant base skews higher-income than the district average.
- Market conditions: 91 active listings in the ZIP; 49 units permitted in Columbiana County in 2024 (0 in 5+ unit buildings).
- This rent runs 38% of the median local income ($60k/yr) — at the standard rent-burdened threshold; future hikes will face affordability resistance.
Forward outlook
- Local home prices are declining (-3.0%/yr); year-one equity from $1k of loan paydown is wiped out by about $5k of value loss. Plan a longer hold.
- Columbiana County population projected at -23% by 2050 — secular population decline; favor cash flow + early exit over multi-decade hold.
- At projected returns (-3.0% appreciation + 3.0% rent growth), your $47k cash investment doubles in ~10 years — after that, you're playing with house money.
Negotiation context
- It's been on market 90 days — a 6% lower offer ($158k) is reasonable based on typical stale-listing flexibility.
- 4 sale attempts since 19y ago with the ask held roughly flat each time — persistent listings suggest the price (not the market) is what's stuck; bring a comps-based counter.
- Current owner paid $90k; list at $169k implies a 87% gain — meaningful room to come down on a strong offer.
Risks & watch-outs
- Watch-outs: built in 1900 — expect roof / HVAC / electrical / plumbing capex.
Questions for the listing agent
- It's been on market 90 days. Have you received any prior offers? Is the seller open to a 6% concession, seller financing, or rate buy-down credit?
- Can we see the unit-by-unit rent roll, current vacancy, and any below-market leases? What's the average tenancy length?
- What capital expenditures (roof, boiler, parking lot, exteriors) have been made in the last 5 years, and what's planned in the next 2?
- Built in 1900 — when were the roof, HVAC, electrical panel, plumbing, and water heater last replaced?
- Why hasn't it sold? Are there any deal-killer items the seller is aware of (foundation, flood, title, zoning, code violations)?
- Is there a deadline driving the sale (1031 exchange, divorce, estate, relocation)? That informs how much negotiation room exists.
- Schools are B-rated — typically a magnet for longer-tenancy family renters. What's the average tenant stay here, and is there a school-zone premium baked into asking?
- What's the average days-on-market for RENTAL listings here right now (not sales)? A rising rental-DOM trend means longer vacancies and softer asking-rent achievability than the comps imply.
- What's the recent tenant-quality profile in this submarket — average credit score on applications, eviction rate, late-payment / NSF rate, and stable-employment percentage? A property-management company in the area should have these aggregated.
- How much new apartment / multifamily construction is in the pipeline within 1–3 miles? Heavy new supply (>2% of stock underway) typically softens rents 12–24 months out; light construction supports rent growth.
Investment metrics
- 1% rule
- 1.14% ✓
- Cap rate
- 9.48%
- Cash-on-cash
- 11.38%
- DSCR
- 1.51
- GRM
- 7.3
CMA / ARV
- ARV (on-the-fly)
- $92,548
- Comps found
- 1
Show comp detail 1 sale within ~0.75 mi
| Address | Dist | Beds/Ba | Sqft | Sold | Price | $/sf | Match |
|---|---|---|---|---|---|---|---|
| 836 E 3rd St | 0.25mi | 4/3.0 | 2,900 (+6%) | 21mo | $97,500 | $34 | 56 |
Match score weights: distance 35% · size 25% · config 20% · recency 20%. Top-matched comps best support the ARV.
Projected returns pro-forma
-3.0% appreciation · 3.0% rent growth · sell at horizon
- IRR
- 0.6%
- Equity multiple
- 1.02×
- Total profit
- $1,153
- Equity at exit
- $25,127
- IRR
- 10.3%
- Equity multiple
- 1.80×
- Total profit
- $37,569
- Equity at exit
- $14,571
Cash invested: $47,186 (down + closing). Projections, not guarantees.
Landlord ↔ Tenant lean methodology
- Overall (STATE)
- 73 Landlord-Friendly
- State Ohio
- 73 Landlord-Friendly · R+6
- County
- — inherits STATE
- City
- — inherits STATE
ZIP-level market 44460
- Home prices YoY
- -32.5%
- Active inventory
- 91
- Price-to-rent
- 14.6×
Monthly cashflow live
- Estimated rent
- $1,919 medium interval (Pro) →
- Mortgage (P&I)
- −$884
- Tax from tax record
- −$115 /mo · $1,377/yr
- Insurance
- −$70
- HOA
- −$0
- Vacancy / Maint / Mgmt
- −$403
- Net cashflow
- $447
Break-even live
Sensitivity live
| Price | -10% $543 | -5% $495 | +0% $447 | +5% $400 | +10% $352 |
|---|---|---|---|---|---|
| Rent | -10% $296 | -5% $372 | +0% $447 | +5% $523 | +10% $599 |
| Rate | -1.0pp $532 | -0.5pp $490 | base $447 | +0.5pp $404 | +1.0pp $359 |
2-unit breakdown (identical units grouped — click to expand)
| Units | Beds | Baths | Est. rent |
|---|---|---|---|
| 2× units | 3 | 2.2 | $1,920 |
| #1 | 3 | 2.2 | $960 |
| #2 | 3 | 2.2 | $960 |
| Total (2 units) | $1,919 | ||
UW: 25.0% down · 7.5% · 30yr · 1.5% tax · 5.0% vac · 8.0% maint · 8.0% mgmt
Financing live
Cash to close
- Down payment
- $42,130
- Closing costs
- $5,056
- Reserves months
- —
- Total cash needed
- —
Loan-product check · same deal, 3 products live
Conventional
25% down · 7.5% · 30yr
- Down + closing
- —
- Monthly P&I
- —
- Monthly cashflow
- —
- DSCR
- —
- Eligible?
- —
Personal DTI + credit; lowest rate.
DSCR
20% down · 8.5% · 30yr
- Down + closing
- —
- Monthly P&I
- —
- Monthly cashflow
- —
- DSCR
- —
- Eligible?
- —
No personal income docs; deal must DSCR.
Hard money
10% down · 12.0% · 12mo
- Down + closing
- —
- Monthly P&I
- —
- Monthly cashflow
- —
- DSCR
- —
- Eligible?
- —
Short-term bridge; refi at stabilization.
Listing history 22 events
-
2026-06-12statusdays on market $168,520 Pending 90 DOM
-
2026-06-09days on market $168,520 Contingent 87 DOM
-
2026-06-08days on market $168,520 Contingent 86 DOM
-
2026-06-08days on market $168,520 Contingent 85 DOM
-
2026-06-05days on market $168,520 Contingent 83 DOM
-
2026-06-04days on market $168,520 Contingent 81 DOM
-
2026-06-02days on market $168,520 Contingent 80 DOM
-
2026-06-01days on market $168,520 Contingent 79 DOM
-
2026-05-31days on market $168,520 Contingent 78 DOM
-
2026-03-22historical Contingent
-
2026-03-15price $168,520
-
2026-03-12$168,000 Active
-
2021-09-03soldstatus $90,000
-
2021-09-01soldstatus $90,000 Closed 496-char remark
Show marketing remark (496 chars)
Brick side-by-side duplex. Great income potential. Each unit has LR, DR, Kitchen, Den or 3rd BD, 1st floor laundry (toilet), 2 BD's & Full Bath. Both units have nice size rooms. 2 car detached garage. 2 New electric panels 2007, Chimney repaired & relined 2009, New gutters with gutter guards 2011, New roof over back addition 2012, New roof to main house 2014. 625 has updated water supply & drains to upstairs bathroom, updated drains in laundry & downstairs bathroom.
-
2021-08-30status Pending 496-char remark
Show marketing remark (496 chars)
Brick side-by-side duplex. Great income potential. Each unit has LR, DR, Kitchen, Den or 3rd BD, 1st floor laundry (toilet), 2 BD's & Full Bath. Both units have nice size rooms. 2 car detached garage. 2 New electric panels 2007, Chimney repaired & relined 2009, New gutters with gutter guards 2011, New roof over back addition 2012, New roof to main house 2014. 625 has updated water supply & drains to upstairs bathroom, updated drains in laundry & downstairs bathroom.
-
2021-08-12historical Contingent 496-char remark
Show marketing remark (496 chars)
Brick side-by-side duplex. Great income potential. Each unit has LR, DR, Kitchen, Den or 3rd BD, 1st floor laundry (toilet), 2 BD's & Full Bath. Both units have nice size rooms. 2 car detached garage. 2 New electric panels 2007, Chimney repaired & relined 2009, New gutters with gutter guards 2011, New roof over back addition 2012, New roof to main house 2014. 625 has updated water supply & drains to upstairs bathroom, updated drains in laundry & downstairs bathroom.
-
2021-07-01$94,900 Active 496-char remark
Show marketing remark (496 chars)
Brick side-by-side duplex. Great income potential. Each unit has LR, DR, Kitchen, Den or 3rd BD, 1st floor laundry (toilet), 2 BD's & Full Bath. Both units have nice size rooms. 2 car detached garage. 2 New electric panels 2007, Chimney repaired & relined 2009, New gutters with gutter guards 2011, New roof over back addition 2012, New roof to main house 2014. 625 has updated water supply & drains to upstairs bathroom, updated drains in laundry & downstairs bathroom.
-
2009-08-27historical
-
2009-02-27$69,900
-
2007-06-26soldstatus $56,000
-
2007-06-26soldstatus $56,000
-
2007-04-19$62,000
ⓘ Source: listings_history table (triggers on properties + properties_extension) + one-shot
backfill from property_details.listing_events for pre-trigger history.
Tax reassessment forecast OH · Partial reset (capped growth)
- Current annual tax
- $1,377 · $115/mo
- Projected year-2 tax
- $2,003 · $167/mo
- Expected delta
- +$626/yr (+$52/mo · 45.5%)
ⓘ Screening estimate from a state-policy table — verify with the county assessor before closing.
Climate risk First Street
- Flood 1/10 Low FEMA zone X (unshaded) · 0% chance over 30 yrs
- Wildfire 1/10 Low
- Heat 3/10 Moderate 7 d/yr ≥95°F today · 18 d/yr by 30 yrs out
- Wind 1/10 Low
- Air quality 2/10 Low 1 unhealthy d/yr today · 2 by 30 yrs out
Nearby sold comps map
Loading sold comps map…
Walkable amenities ~0.75 mi
Loading nearby amenities…
Taxation est. · year 1
- Rental income
- $23,028
- − Mortgage interest
- −$9,440
- − Property taxes
- −$1,377
- − Insurance
- −$843
- − Repairs & maintenance
- −$1,842
- − Management
- −$1,842
- − Depreciation
- −$4,902
- Taxable income
- $2,782
- Est. tax owed @ 24.0%
- −$668
- After-tax cash flow
- $4,700/yr
For passive investors: Depreciation is non-cash, so a rental often shows a tax loss while cash-flowing — sheltering income. Rental losses are passive: they offset passive income freely, and up to $25,000/yr can offset ordinary (W-2) income if you actively participate and your MAGI is under $100k (phasing out to $0 by $150k); unused losses carry forward. On sale, claimed depreciation is recaptured at up to 25%, and gains may owe capital-gains tax (a 1031 exchange can defer both). Figures are a year-1 estimate at your 24.0% rate — not tax advice; consult a CPA.
Schools (NCES district)
- District
- Salem City
- NCES district ID
- 3910006
- Math proficiency
- 53% ▼ -14.00%
- Reading proficiency
- 56% ▼ -12.00%
- Median HH income
- $41,145
- Composite
- 45.66/100
- National rank
- #2582
- State rank
- #389 of 656 in OH
Livability — Salem
- Score
- 68/100
- State rank
- #538
- US rank
- #9073
Category grades
Schools grade is shown separately in the Schools card above.
Census & demographics
- Census place
- Salem, OH
- County
- Columbiana · 99,532 people
- City population
- 25,289
- Population (ZIP)
- 25,289
- Household income
- $59,882
- Rent vs Own
- Severe rent burden
- 9.0
Population outlook (Columbiana County) Hauer SSP2
- Today (2025)
- 98,353 people
- By 2030
- 94,225 · -4.2%
- By 2040
- 85,169 · -13.4%
- By 2050
- 76,157 · -22.6%
- By 2075
- 58,451 · -40.6%
- By 2100
- 42,805 · -56.5%
Race, ethnicity, and origin ACS 2023
- Neighborhood character
- Predominantly White (96%)
- Race & ethnicity
- White 96% Two or more races 2%
- Common ancestry
- Slovak 4% Lithuanian 3% Romanian 2%
- Foreign-born
- 1% · Canada
- Languages at home
- 98% English-only · Spanish 1%
Political lean MEDSL · Columbiana
- 2024 margin
- Solid R (+49.0) · D 25.1% · R 74.1%
- 2008→2024 swing
- -41.4pp toward R · 2008: -7.6pp · 2024: -49.0pp
- All cycles
- 2024: R+49.0 2020: R+44.9 2016: R+41.6 2012: R+12.0 2008: R+7.6
Not yet ingested
- Civics
- —
Market trends
- HPI YoY
- ▼ -102.42%
- Current HPI
- 212.8922
- Rent YoY
- —
- Metro
- —
- State GDP YoY
- ▲ 1.98%
- F500 in state
- 48
Industry mix (Fortune 500 HQ in OH)
| Industry | F500 HQs | Revenue |
|---|---|---|
| Insurance | 3 | $145B |
|
||
| Industrial Machinery | 3 | $49B |
|
||
| Financial Services | 3 | $24B |
|
||
| Consumer Goods | 2 | $93B |
|
||
| Aerospace / Defense | 2 | $47B |
|
||
| Utilities | 2 | $33B |
|
||
Price history
+171.8% since first listed13 events — show timeline
- 2026-03-22 Contingent — MLSNOW
- 2026-03-15 Price Changed $168,520 MLSNOW
- 2026-03-12 Listed $168,000 MLSNOW
- 2021-09-03 Sold (Public Records) $90,000 Public Records
- 2021-09-01 Sold (MLS) $90,000 MLSNOW
- 2021-08-30 Pending — MLSNOW
- 2021-08-12 Contingent — MLSNOW
- 2021-07-01 Listed $94,900 MLSNOW
- 2009-08-27 Listing Removed — MLSNOW
- 2009-02-27 Listed $69,900 MLSNOW
- 2007-06-26 Sold (Public Records) $56,000 Public Records
- 2007-06-26 Sold (MLS) $56,000 MLSNOW
- 2007-04-19 Listed $62,000 MLSNOW
Property tax history
+0.8%/yrLatest (2025): $1,377 · +18.2% YoY. Source: county tax records.
Cash-flow waterfall
monthlySold comps — $/sqft
last 12 mo · ≤1 miLoading sold comps…