 7-Plex
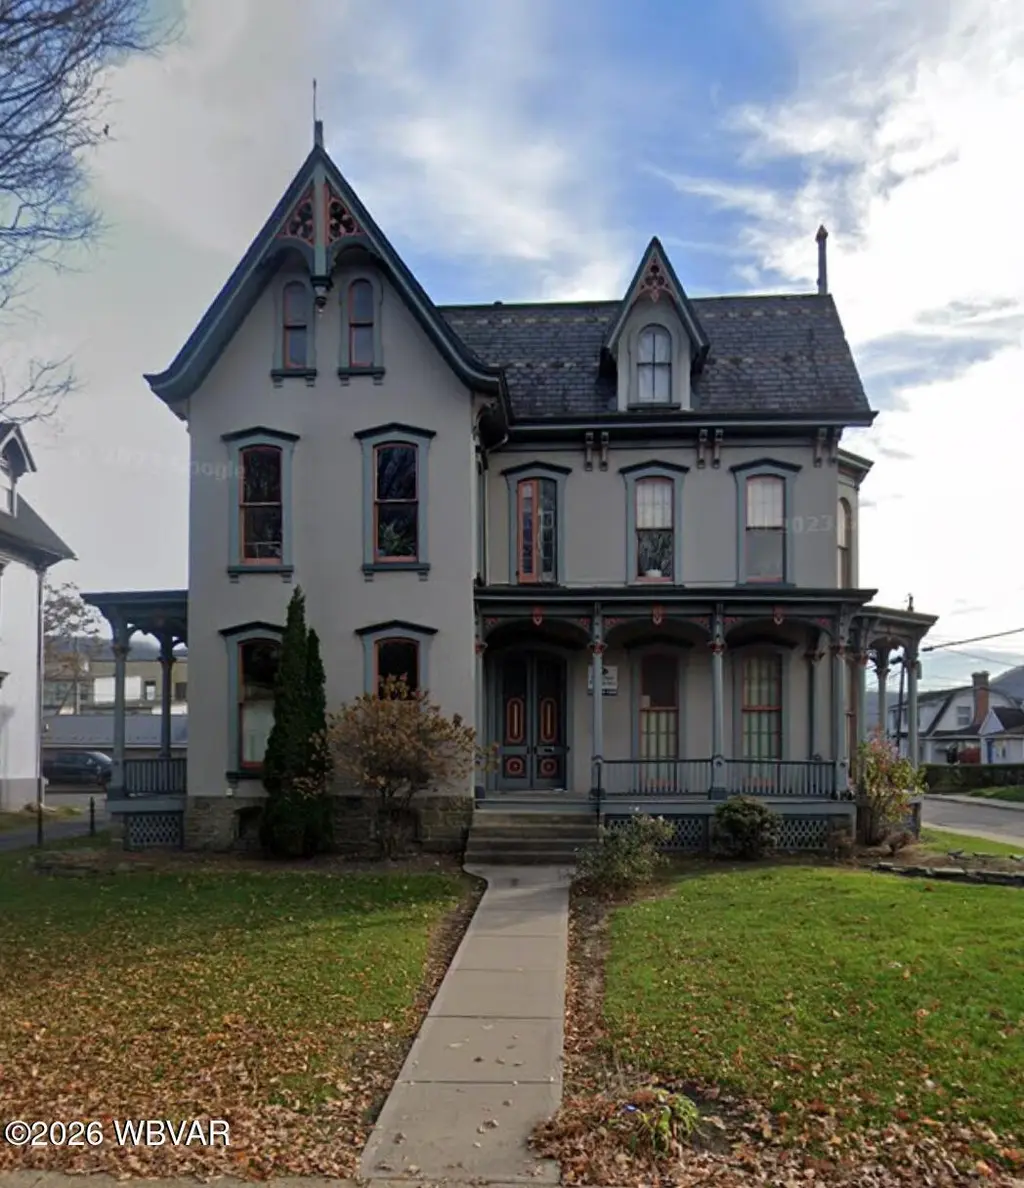
1075 W 4th St · Williamsport, PA
Flood risk 6/10 · Moderate
- FEMA flood zone
- X
- Chance of flooding over 30 yrs
- 0.27%
- Est. flood insurance / yr
- $473 – $860
Fire risk 1/10 · Minimal
- Est. fire insurance / yr
- $511 – $949
Heat risk 4/10 · Minor
- Hot days now (above 97°F)
- 7 days/yr
- Hot days in 30 yrs
- 16 days/yr
Wind risk 2/10 · Minimal
- Chance of severe wind over 30 yrs
- 2.0%
Air-quality risk 2/10 · Minimal
- Unhealthy air days now
- 0 days/yr
- Unhealthy air days in 30 yrs
- 1 days/yr
Risk factors via First Street. Map © Google.
Why this score? — see what drove the B grade
The composite is a weighted blend of 9 inputs, each scored 0–100. Each bar is that input's sub-score; the figure is the points it added to the 100-point composite (weight × sub-score).
- Cash flow +30.0/30.0
- 1% rule +10.0/10.0
- DSCR +10.0/10.0
- ARV discount +7.5/15.0
- Livability +3.7/5.0
- Rent growth +3.6/5.0
- Schools +3.5/10.0
- Condition / age +2.5/5.0
- Appreciation +0.0/10.0
$400,000
🖨 Deal sheet 📄 Offer letter ✓ Due diligence
Multi-family units
County records classify this as Multi-Family (5+ Unit). Listing-text estimate: 7 units. confirmed
5+ unit building — per-unit beds/baths from public records are typically unavailable; the breakdown below (if shown) is an estimate from the listing text.
Listing remarks MLS
Here is an opportunity to invest in a 7 unit building presently used for Penn College Students, but could work for any kind of renter. This historic property is only 1/2 block from PCT, so it's well situated to benefit college kids. At over 5,000 sq/ft, this property offers 5 ''studio'' apartments, 1 (3) bedroom apartment and 1 (4) bedroom apartment, giving you 12 total beds to rent. At the PCT average of $2,500 per bed per semester/$5,000 per bed per year, that's $60,000 in annual rent at the AVERAGE price. Please contact Rob Pierce / Fish Real Estate / for info and showing instructions.
Key facts
- 0.28 acre lot
- 12 parking spots
- Built 1901
Property features AI
Exterior
- Parking: Gravel parking; 12 open parking spaces
- Utilities: Public water; Electric service with circuit breakers
- Home design: Residential income property (multi-family / multi-units)
- Construction: Stone veneer exterior; Stone foundation; Built area approximately 5,374
- Exterior features: Shingle roof; Zoned R3
Interior
- Flooring: Wood; Vinyl; Carpet
- Heating & cooling: Heating: Electric, natural gas, baseboard; No cooling
- Interior features: Wood, vinyl, and carpet flooring; Full basement
Neighborhood map
What this means for you Summary
Snapshot
- This is a 5×1bd/1ba + 1×3bd/1ba + 1×4bd/1ba units multifamily listed at $400k.
Deal economics
- At list price, monthly cash flow is $3k ($34k/yr) — positive. Per door: $405/mo.
- The deal already cash-flows at list — no discount required.
- Meets the 1% rule at list price ($7k rent vs $400k).
- Cap rate 14.8% vs local median 5.6% in Williamsport — top-decile yield for the area; either an underpriced asset or a hidden risk that comps aren't pricing in. Stress-test before assuming the spread holds.
Location & tenants
- Location reads 74/100 on livability (#523 in PA, #4,841 nationally) — a middle-class / working-renter tenant base. Strengths: cost of living A+, housing A+, health & safety A+; Watch: crime C-, employment D, amenities F.
- Williamsport Area SD (urban): math 38% / reading 45% proficiency, ranked #349 of 539 in PA (top 65%) — families likely to look elsewhere, expect single-tenant / working-renter base with shorter leases.
- Market conditions: Rents rising fast (+4.4%/yr); 188 active listings in the ZIP; 73 units permitted in Lycoming County in 2024 (15 in 5+ unit buildings).
- At $7,163/mo this rent would consume 161% of the median local household income ($53k/yr) (locally 2178% of renters already pay >50% of income on rent) — very limited rent-growth headroom before tenants either downsize or default.
Forward outlook
- Local home prices are declining (-3.0%/yr); year-one equity from $3k of loan paydown is wiped out by about $12k of value loss. Plan a longer hold.
- Lycoming County population projected to shrink 10% by 2050 — rents likely to lag national; underwrite the cash flow, not the appreciation.
- At projected returns (-3.0% appreciation + 4.4% rent growth), your $112k cash investment doubles in ~4 years — after that, you're playing with house money.
Negotiation context
- Only 1 days on market — expect competitive offers; lowballing is unlikely to land.
- 2 sale attempts since 5y ago with the ask held roughly flat each time — persistent listings suggest the price (not the market) is what's stuck; bring a comps-based counter.
- Current owner paid $115k; list at $400k implies a 248% gain — meaningful room to come down on a strong offer.
Risks & watch-outs
- Watch-outs: built in 1901 — expect roof / HVAC / electrical / plumbing capex.
- Climate carrying-cost: major flood risk — expect insurance premiums to compound above CPI over the hold.
Questions for the listing agent
- Can we see the unit-by-unit rent roll, current vacancy, and any below-market leases? What's the average tenancy length?
- What capital expenditures (roof, boiler, parking lot, exteriors) have been made in the last 5 years, and what's planned in the next 2?
- Built in 1901 — when were the roof, HVAC, electrical panel, plumbing, and water heater last replaced?
- Is there a deadline driving the sale (1031 exchange, divorce, estate, relocation)? That informs how much negotiation room exists.
- What's the average days-on-market for RENTAL listings here right now (not sales)? A rising rental-DOM trend means longer vacancies and softer asking-rent achievability than the comps imply.
- What's the recent tenant-quality profile in this submarket — average credit score on applications, eviction rate, late-payment / NSF rate, and stable-employment percentage? A property-management company in the area should have these aggregated.
- How much new apartment / multifamily construction is in the pipeline within 1–3 miles? Heavy new supply (>2% of stock underway) typically softens rents 12–24 months out; light construction supports rent growth.
Investment metrics
- 1% rule
- 1.79% ✓
- Cap rate
- 14.80%
- Cash-on-cash
- 30.38%
- DSCR
- 2.35
- GRM
- 4.7
CMA / ARV
No comps found within radius.
Projected returns pro-forma
-3.0% appreciation · 4.43% rent growth · sell at horizon
- IRR
- 26.7%
- Equity multiple
- 2.13×
- Total profit
- $126,366
- Equity at exit
- $59,641
- IRR
- 35.2%
- Equity multiple
- 4.46×
- Total profit
- $387,321
- Equity at exit
- $34,585
Cash invested: $112,000 (down + closing). Projections, not guarantees.
Landlord ↔ Tenant lean methodology
- Overall (STATE)
- 62 Landlord-Friendly
- State Pennsylvania
- 62 Landlord-Friendly · EVEN
- County
- — inherits STATE
- City
- — inherits STATE
ZIP-level market 17701
- Rents YoY
- 4.4%
- Active inventory
- 188
- Price-to-rent
- 37.8×
Monthly cashflow live
- Estimated rent
- $7,163 medium interval (Pro) →
- Mortgage (P&I)
- −$2,098
- Tax from tax record
- −$559 /mo · $6,709/yr
- Insurance
- −$167
- HOA
- −$0
- Vacancy / Maint / Mgmt
- −$1,504
- Net cashflow
- $2,835
Break-even live
7-unit breakdown (identical units grouped — click to expand)
| Units | Beds | Baths | Est. rent |
|---|---|---|---|
| 5× units | 1 | 1 | $4,415 |
| #1 | 1 | 1 | $883 |
| #2 | 1 | 1 | $883 |
| #3 | 1 | 1 | $883 |
| #4 | 1 | 1 | $883 |
| #5 | 1 | 1 | $883 |
| 1× unit | 3 | 1 | $1,265 |
| 1× unit | 4 | 1 | $1,485 |
| Total (7 units) | $7,163 | ||
UW: 25.0% down · 7.5% · 30yr · 1.5% tax · 5.0% vac · 8.0% maint · 8.0% mgmt
Financing live
Cash to close
- Down payment
- $100,000
- Closing costs
- $12,000
- Reserves months
- —
- Total cash needed
- —
Loan-product check · same deal, 3 products live
Conventional
25% down · 7.5% · 30yr
- Down + closing
- —
- Monthly P&I
- —
- Monthly cashflow
- —
- DSCR
- —
- Eligible?
- —
Personal DTI + credit; lowest rate.
DSCR
20% down · 8.5% · 30yr
- Down + closing
- —
- Monthly P&I
- —
- Monthly cashflow
- —
- DSCR
- —
- Eligible?
- —
No personal income docs; deal must DSCR.
Hard money
10% down · 12.0% · 12mo
- Down + closing
- —
- Monthly P&I
- —
- Monthly cashflow
- —
- DSCR
- —
- Eligible?
- —
Short-term bridge; refi at stabilization.
Listing history 5 events
-
2026-05-10status Pending
-
2026-05-09$400,000 Active
-
2021-04-23soldstatus 596-char remark
Show marketing remark (596 chars)
Here is an opportunity to invest in a 7 unit building presently used for Penn College Students, but could work for any kind of renter. This historic property is only 1/2 block from PCT, so it's well situated to benefit college kids. At over 5,000 sq/ft, this property offers 5 ''studio'' apartments, 1 (3) bedroom apartment and 1 (4) bedroom apartment, giving you 12 total beds to rent. At the PCT average of $2,500 per bed per semester/$5,000 per bed per year, that's $60,000 in annual rent at the AVERAGE price. Please contact Rob Pierce / Fish Real Estate / for info and showing instructions.
-
2021-02-25$299,900 596-char remark
Show marketing remark (596 chars)
Here is an opportunity to invest in a 7 unit building presently used for Penn College Students, but could work for any kind of renter. This historic property is only 1/2 block from PCT, so it's well situated to benefit college kids. At over 5,000 sq/ft, this property offers 5 ''studio'' apartments, 1 (3) bedroom apartment and 1 (4) bedroom apartment, giving you 12 total beds to rent. At the PCT average of $2,500 per bed per semester/$5,000 per bed per year, that's $60,000 in annual rent at the AVERAGE price. Please contact Rob Pierce / Fish Real Estate / for info and showing instructions.
-
2001-04-06soldstatus $115,000
ⓘ Source: listings_history table (triggers on properties + properties_extension) + one-shot
backfill from property_details.listing_events for pre-trigger history.
Tax reassessment forecast PA · Partial reset (capped growth)
- Current annual tax
- $6,709 · $559/mo
- Projected year-2 tax
- $6,709 · $559/mo
- Expected delta
- $0/yr ($0/mo · 0.0%)
ⓘ Screening estimate from a state-policy table — verify with the county assessor before closing.
Climate risk First Street
- Flood 6/10 Major FEMA zone X · 27% chance over 30 yrs
- Wildfire 1/10 Low
- Heat 4/10 Moderate 7 d/yr ≥97°F today · 16 d/yr by 30 yrs out
- Wind 2/10 Low 2% chance of damaging wind over 30 yrs
- Air quality 2/10 Low 0 unhealthy d/yr today · 1 by 30 yrs out
Nearby sold comps map
Loading sold comps map…
Walkable amenities ~0.75 mi
Loading nearby amenities…
Taxation est. · year 1
- Rental income
- $85,956
- − Mortgage interest
- −$22,406
- − Property taxes
- −$6,709
- − Insurance
- −$2,000
- − Repairs & maintenance
- −$6,876
- − Management
- −$6,876
- − Depreciation
- −$11,636
- Taxable income
- $29,451
- Est. tax owed @ 24.0%
- −$7,068
- After-tax cash flow
- $26,956/yr
For passive investors: Depreciation is non-cash, so a rental often shows a tax loss while cash-flowing — sheltering income. Rental losses are passive: they offset passive income freely, and up to $25,000/yr can offset ordinary (W-2) income if you actively participate and your MAGI is under $100k (phasing out to $0 by $150k); unused losses carry forward. On sale, claimed depreciation is recaptured at up to 25%, and gains may owe capital-gains tax (a 1031 exchange can defer both). Figures are a year-1 estimate at your 24.0% rate — not tax advice; consult a CPA.
Schools (NCES district)
- District
- Williamsport Area SD
- NCES district ID
- 4226460
- Math proficiency
- 38% ▼ -9.00%
- Reading proficiency
- 45% ▼ -12.00%
- Median HH income
- $38,637
- Composite
- 34.63/100
- National rank
- #5150
- State rank
- #349 of 539 in PA
Livability — Williamsport
- Score
- 74/100
- State rank
- #523
- US rank
- #4841
Category grades
Schools grade is shown separately in the Schools card above.
Census & demographics
- Census place
- Williamsport, PA
- County
- Lycoming County · 43,104 people
- City population
- 43,104
- Metro
- Williamsport, PA
- Population (ZIP)
- 43,104
- Household income
- $53,237
- Rent vs Own
- Severe rent burden
- 2178.0
Population outlook (Lycoming County) Hauer SSP2
- Today (2025)
- 114,164 people
- By 2030
- 112,221 · -1.7%
- By 2040
- 107,613 · -5.7%
- By 2050
- 102,950 · -9.8%
- By 2075
- 92,987 · -18.5%
- By 2100
- 80,924 · -29.1%
Race, ethnicity, and origin ACS 2023
- Neighborhood character
- Predominantly White (80%)
- Race & ethnicity
- White 80% Black 10% Two or more races 7% Hispanic / Latino 3% Asian 1%
- Common ancestry
- Romanian 3% Lithuanian 2% Slovak 2%
- Foreign-born
- 2% · Canada
- Languages at home
- 96% English-only · Spanish 1% French/Haitian/Cajun 1% German/W. Germanic 1%
Political lean MEDSL · Lycoming
- 2024 margin
- Solid R (+41.5) · D 28.8% · R 70.3%
- 2008→2024 swing
- -17.3pp toward R · 2008: -24.2pp · 2024: -41.5pp
- All cycles
- 2024: R+41.5 2020: R+41.3 2016: R+44.8 2012: R+33.3 2008: R+24.2
Not yet ingested
- Civics
- —
Market trends
- HPI YoY
- ▼ -142.61%
- Current HPI
- 216.7203
- Rent YoY
- ▲ 4.43%
- Metro
- Williamsport, PA
- State GDP YoY
- ▲ 1.68%
- F500 in state
- 34
Industry mix (Fortune 500 HQ in PA)
| Industry | F500 HQs | Revenue |
|---|---|---|
| Healthcare | 2 | $309B |
|
||
| Insurance | 2 | $27B |
|
||
| Telecommunications / Media | 1 | $124B |
|
||
| Industrial Distribution | 1 | $22B |
|
||
| Financial Services | 1 | $20B |
|
||
| Chemicals / Materials | 1 | $18B |
|
||
Price history
+247.8% since first listed5 events — show timeline
- 2026-05-10 Pending — WBVAR
- 2026-05-09 Listed $400,000 WBVAR
- 2021-04-23 Sold (MLS) — WBVAR
- 2021-02-25 Listed $299,900 WBVAR
- 2001-04-06 Sold (Public Records) $115,000 Public Records
Property tax history
+2.0%/yrLatest (2026): $6,709 · +2.5% YoY. Source: county tax records.
Cash-flow waterfall
monthlySold comps — $/sqft
last 12 mo · ≤1 miLoading sold comps…