1749 Morris Ave · East Point, GA
Flood risk 1/10 · Minimal
- FEMA flood zone
- X (unshaded)
- Chance of flooding over 30 yrs
- 0.0%
- Est. flood insurance / yr
- $473 – $860
Fire risk 1/10 · Minimal
- Est. fire insurance / yr
- $963 – $1,789
Heat risk 6/10 · Moderate
- Hot days now (above 103°F)
- 7 days/yr
- Hot days in 30 yrs
- 18 days/yr
Wind risk 6/10 · Moderate
- Chance of severe wind over 30 yrs
- 27.0%
Air-quality risk 4/10 · Minor
- Unhealthy air days now
- 4 days/yr
- Unhealthy air days in 30 yrs
- 6 days/yr
Risk factors via First Street. Map © Google.
Why this score? — see what drove the B grade
The composite is a weighted blend of 9 inputs, each scored 0–100. Each bar is that input's sub-score; the figure is the points it added to the 100-point composite (weight × sub-score).
- Cash flow +30.0/30.0
- DSCR +10.0/10.0
- 1% rule +9.4/10.0
- ARV discount +7.5/15.0
- Schools +4.5/10.0
- Livability +3.6/5.0
- Rent growth +2.8/5.0
- Condition / age +2.5/5.0
- Appreciation +0.0/10.0
$100,000
🖨 Deal sheet 📄 Offer letter ✓ Due diligence
Listing remarks MLS
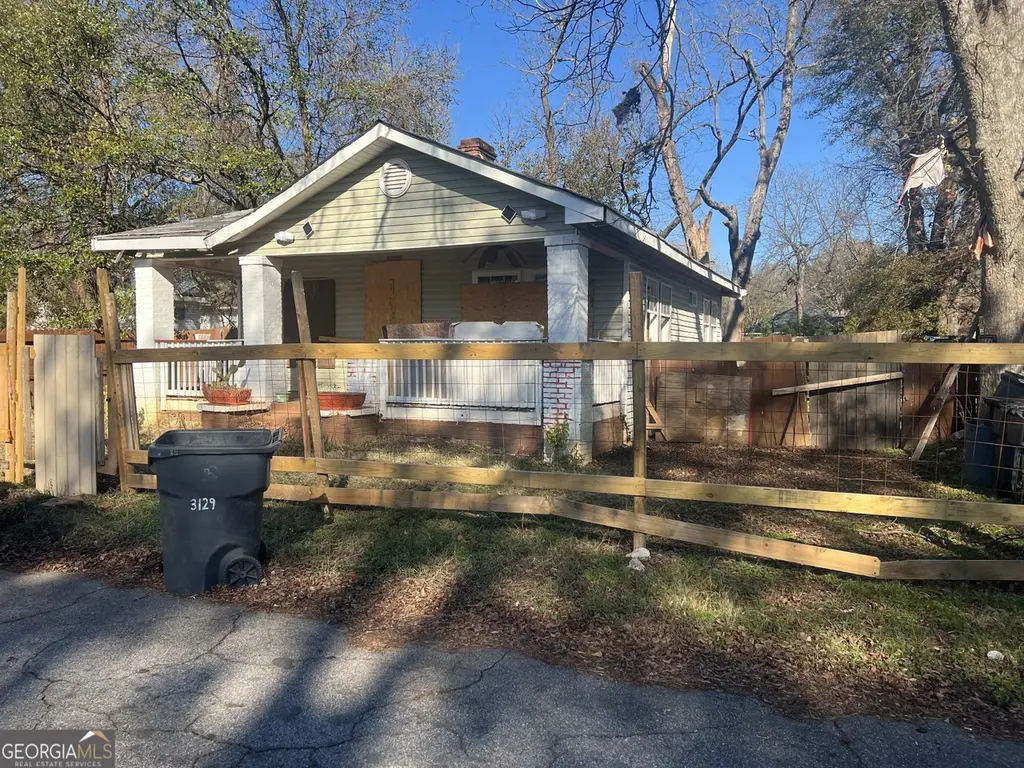
INVESTOR SPECIAL! Exceptional redevelopment opportunity in East Point. This property is in need of a complete renovation and is being sold strictly AS-IS, WHERE-IS. The existing structure requires a full gut renovation down to the studs and is not currently habitable. Seller will make no repairs and will not remove any personal property, debris, or other items remaining on the premises. Per seller's information, current zoning may allow for duplex development, making this an attractive opportunity for investors, builders, and developers. Buyers are encouraged to independently verify zoning, land use, development potential, and all intended uses with the City of East Point. USE EXTREME CAUTION WHEN VISITING THE PROPERTY. The structure is in poor condition and entry may require a drill and/or crowbar. Access is at your own risk. A signed Hold Harmless Agreement and Liability Waiver is required prior to receiving showing approval. Due to the condition of the property, all visitors enter at their own risk. Seller and listing broker assume no liability for injuries or damages resulting from access to or inspection of the property. Cash buyers preferred. No disclosures available. Buyer to conduct all due diligence prior to submitting an offer.
Key facts
- Duplex development
- Complete renovation
- 5,501 sq ft lot
Tags
Property features AI
Finance
- Other: Property listed in fixer condition
- HOA & community: Near public transportation and shopping; Close to airport/runway
Exterior
- Parking: Two total parking spaces; On-street parking available; Open parking
- Utilities: Public water; Public sewer; Electric service (other); Cable, electricity, phone, sewer and water available
- Home design: Single-story (one level)
- Construction: Block and vinyl siding construction; Composition roof; Raised foundation with brick/mortar piers/posts
- Exterior features: Private entrance; Private yard; Rear stairs; Front porch; Chain link and wood fencing
Interior
- Kitchen: No specific kitchen features listed
- Bedrooms: Two main-level bedrooms; Primary bedroom on the main level
- Bathrooms: One full bathroom (located on the main level)
- Interior features: High ceilings (9 ft on main level, 10 ft on lower level); One fireplace with stone surround and wood-burning stove in the great room; No shared/common walls; Crawl space foundation
- Laundry & utility: Laundry located in kitchen and in a common area
Neighborhood map
What this means for you Summary
Snapshot
- This is a 3-bed/1.0-bath single-family listed at $100k.
Deal economics
- At list price, monthly cash flow is $424 ($5k/yr) — positive.
- The deal already cash-flows at list — no discount required.
- Meets the 1% rule at list price ($1k rent vs $100k).
- Cap rate 11.4% vs local median 5.1% in East Point — top-decile yield for the area; either an underpriced asset or a hidden risk that comps aren't pricing in. Stress-test before assuming the spread holds.
Location & tenants
- Location reads 72/100 on livability (#72 in GA) — a middle-class / working-renter tenant base. Strengths: commute A+, cost of living A+, housing A+; Watch: employment D+, crime F, amenities F.
- Fulton County (suburban): math 49% / reading 53% proficiency, ranked #12 of 174 in GA (top 7%) — acceptable for families but not a draw, mixed tenant base, ~2y average lease.
- Zoned schools: Paul D. West Middle School (math 17% / reading 17%, grade F, #381 of 470 statewide, top 82%, 803 students, 100% FRL); Tri-Cities High School (math 5% / reading 30%, grade F, #264 of 424 statewide, top 63%, 1,483 students, 100% FRL) — zoned schools average 100% FRL vs 41% district-wide (59 pts higher); higher-poverty schools than district average — tighter screening recommended.
- Zoned-school proficiency averages 17% at this address vs 51% district-wide (-34 pts) — the specific schools serving this property underperform the Fulton County average; the district grade overstates school quality for this exact location.
- Market conditions: Rents rising (+1.4%/yr); 283 active listings in the ZIP; 40 comparable units currently listed for rent nearby; rentals at typical pace (median 24d on market — plan ~3-4 weeks tenant-placement turnaround); 45% of comp listings sitting > 30 days — soft ceiling on asking rent; 11,565 units permitted in Fulton County in 2024 (8,159 in 5+ unit buildings).
Forward outlook
- Local home prices are declining (-3.0%/yr); year-one equity from $691 of loan paydown is wiped out by about $3k of value loss. Plan a longer hold.
- Fulton County population projected at +38% by 2050 — long-run rental-demand tailwind backs the buy-and-hold thesis.
- At projected returns (-3.0% appreciation + 1.4% rent growth), your $28k cash investment doubles in ~8 years — after that, you're playing with house money.
Negotiation context
- Only 3 days on market — expect competitive offers; lowballing is unlikely to land.
- 4 sale attempts since 4y ago with the ask held roughly flat each time — persistent listings suggest the price (not the market) is what's stuck; bring a comps-based counter.
- Current owner paid $80k; 25% above their basis — modest negotiation headroom, anchor on the comps not their cost.
Risks & watch-outs
- Watch-outs: built in 1920 — expect roof / HVAC / electrical / plumbing capex.
- Climate carrying-cost: major wind risk, 27% chance of damaging wind over 30y; extreme-heat days projected 7→18/yr by 2055 (HVAC capex compounding) — expect insurance premiums to compound above CPI over the hold.
Questions for the listing agent
- Built in 1920 — when were the roof, HVAC, electrical panel, plumbing, and water heater last replaced?
- Is there a deadline driving the sale (1031 exchange, divorce, estate, relocation)? That informs how much negotiation room exists.
- Schools are F-rated, which usually means shorter tenancies and higher turnover. Who's the typical renter profile here, and what's been the actual vacancy rate?
- Crime grade is F in this area — have there been break-ins, vandalism, or insurance claims at this property in the last 3 years? What carrier currently insures it and at what premium?
- What's the average days-on-market for RENTAL listings here right now (not sales)? A rising rental-DOM trend means longer vacancies and softer asking-rent achievability than the comps imply.
- What's the recent tenant-quality profile in this submarket — average credit score on applications, eviction rate, late-payment / NSF rate, and stable-employment percentage? A property-management company in the area should have these aggregated.
- How much new for-sale + rental construction is in the pipeline within 1–3 miles? Heavy new supply typically softens prices + rents 12–24 months out; constrained supply supports both.
Investment metrics
- 1% rule
- 1.44% ✓
- Cap rate
- 11.38%
- Cash-on-cash
- 18.16%
- DSCR
- 1.81
- GRM
- 5.8
CMA / ARV
- ARV (on-the-fly)
- $200,158
- Comps found
- 8
Show comp detail 8 sales within ~0.75 mi
| Address | Dist | Beds/Ba | Sqft | Sold | Price | $/sf | Match |
|---|---|---|---|---|---|---|---|
| 3122 Semmes St | 0.08mi | 3/1.0 | 1,002 (+2%) | 17mo | $155,000 | $155 | 79 |
| 3242 College St | 0.32mi | 3/2.0 | 1,104 (+12%) | 10mo | $224,500 | $203 | 53 |
| 3115 Cloverhurst Dr | 0.57mi | 3/1.0 | 906 (-8%) | 16mo | $232,000 | $256 | 46 |
| 2875 Jones St | 0.50mi | 2/1.0 (-1) | 904 (-8%) | 18mo | $170,000 | $188 | 43 |
| 1882 Dorsey Ave | 0.61mi | 2/1.0 (-1) | 1,028 (+4%) | 20mo | $235,000 | $229 | 42 |
| 3020 Washington Rd | 0.60mi | 2/1.0 (-1) | 1,101 (+12%) | 8mo | $155,000 | $141 | 41 |
| 2116 Ben Hill Rd | 0.74mi | 3/2.0 | 1,092 (+11%) | 18mo | $142,000 | $130 | 29 |
| 3176 Pollard St | 0.74mi | 3/2.0 | 1,129 (+14%) | 11mo | $275,000 | $244 | 28 |
Match score weights: distance 35% · size 25% · config 20% · recency 20%. Top-matched comps best support the ARV.
Projected returns pro-forma
-3.0% appreciation · 1.35% rent growth · sell at horizon
- IRR
- 7.9%
- Equity multiple
- 1.30×
- Total profit
- $8,472
- Equity at exit
- $14,910
- IRR
- 15.7%
- Equity multiple
- 2.18×
- Total profit
- $32,948
- Equity at exit
- $8,646
Cash invested: $28,000 (down + closing). Projections, not guarantees.
Landlord ↔ Tenant lean methodology
- Overall (STATE)
- 90 Strongly Landlord-Friendly
- State Georgia
- 90 Strongly Landlord-Friendly · R+3
- County
- — inherits STATE
- City
- — inherits STATE
ZIP-level market 30344
- Home prices YoY
- -31.0%
- Rents YoY
- 1.4%
- Active inventory
- 283
- Price-to-rent
- 5.8×
Monthly cashflow live
- Estimated rent
- $1,439 high interval (Pro) →
- Mortgage (P&I)
- −$524
- Tax from tax record
- −$147 /mo · $1,760/yr
- Insurance
- −$42
- HOA
- −$0
- Vacancy / Maint / Mgmt
- −$302
- Net cashflow
- $424
Break-even live
UW: 25.0% down · 7.5% · 30yr · 1.5% tax · 5.0% vac · 8.0% maint · 8.0% mgmt
Financing live
Cash to close
- Down payment
- $25,000
- Closing costs
- $3,000
- Reserves months
- —
- Total cash needed
- —
Loan-product check · same deal, 3 products live
Conventional
25% down · 7.5% · 30yr
- Down + closing
- —
- Monthly P&I
- —
- Monthly cashflow
- —
- DSCR
- —
- Eligible?
- —
Personal DTI + credit; lowest rate.
DSCR
20% down · 8.5% · 30yr
- Down + closing
- —
- Monthly P&I
- —
- Monthly cashflow
- —
- DSCR
- —
- Eligible?
- —
No personal income docs; deal must DSCR.
Hard money
10% down · 12.0% · 12mo
- Down + closing
- —
- Monthly P&I
- —
- Monthly cashflow
- —
- DSCR
- —
- Eligible?
- —
Short-term bridge; refi at stabilization.
Rent comps 40 comps
| Address | Beds | Baths | Sqft | Rent | $/sqft | DOM | Units | Dist |
|---|---|---|---|---|---|---|---|---|
| 3100 E Point St Atlanta, GA | 2.0 | 1.0 | 850 | $1,224 | $1.44 | 5d | 3 | 0.09mi |
| 3193 E Point St Unit 4 Atlanta, GA | 2.0 | 1.0 | 800 | $1,350 | $1.69 | 20d | 1 | 0.11mi |
| 3193 E Point St Unit 4 Atlanta, GA | 2.0 | 1.0 | 800 | $1,350 | $1.69 | 10d | 1 | 0.11mi |
| 3203 E Point St Apt 4 Atlanta, GA | 2.0 | 1.0 | 800 | $1,350 | $1.69 | 10d | 1 | 0.13mi |
| 3203 E Point St Apt 4 Atlanta, GA | 2.0 | 1.0 | 800 | $1,350 | $1.69 | 24d | 1 | 0.13mi |
| 1836 Dunlap Ave Apt 90 Atlanta, GA | 2.0 | 1.5 | 1030 | $1,150 | $1.12 | 24d | 1 | 0.19mi |
| 3045 Semmes St Atlanta, GA | 2.0 | 1.5 | 1000 | $1,400 | $1.40 | 43d | 3 | 0.20mi |
| 1818 Vesta Ave Atlanta, GA | 1.0–2.0 | 1.0 | 811 | $1,450 | $1.79 | 43d | 5 | 0.25mi |
| 2997 Park St Unit 2 Atlanta, GA | 2.0 | 1.5 | 860 | $1,549 | $1.80 | 5d | 1 | 0.26mi |
| 2997 Park St Unit 3 Atlanta, GA | 2.0 | 1.5 | 860 | $1,499 | $1.74 | 43d | 1 | 0.26mi |
| 1804 Lyle Ave Unit 4 College Park, GA | 2.0 | 1.5 | 900 | $1,350 | $1.50 | 43d | 1 | 0.31mi |
| 1910 Center Ave Atlanta, GA | 2.0 | 1.0 | 800 | $1,300 | $1.62 | 43d | 1 | 0.31mi |
| 2982 Pearl St Unit LEFT SIDE East Point, GA | 2.0 | 1.0 | 676 | $1,125 | $1.66 | 43d | 1 | 0.37mi |
| 1907 Lyle Ave Atlanta, GA | 2.0 | 1.0 | 736 | $1,300 | $1.77 | 43d | 1 | 0.40mi |
| 2977 Pearl St Unit 2 Atlanta, GA | 2.0 | 1.0 | 800 | $1,390 | $1.74 | 1d | 1 | 0.40mi |
| 3300 College St Unit 5 College Park, GA | 2.0 | 1.0 | 760 | $975 | $1.28 | 2d | 1 | 0.40mi |
| 2874 Cheney St Atlanta, GA | 2.0 | 1.0 | 900 | $1,300 | $1.44 | 43d | 1 | 0.47mi |
| 3100 Larose St Atlanta, GA | 3.0 | 1.0 | 1121 | $1,600 | $1.43 | 43d | 1 | 0.48mi |
| 1744 Cambridge Ave #2 Atlanta, GA | 2.0 | 1.5 | 1100 | $1,599 | $1.45 | 43d | 1 | 0.59mi |
| 1744 Cambridge Ave College Park, GA | 2.0 | 1.5 | 1100 | $1,600 | $1.45 | 5d | 2 | 0.59mi |
| 2730 Pearl St Unit 1 East Point, GA | 2.0 | 1.0 | 910 | $1,175 | $1.29 | 43d | 1 | 0.78mi |
| 1408 Lyle Ave Unit A Atlanta, GA | 2.0 | 1.0 | 842 | $1,350 | $1.60 | 24d | 1 | 0.78mi |
| 1761 John Calvin Ave Unit 1 Atlanta, GA | 2.0 | 1.0 | 950 | $1,300 | $1.37 | 22d | 1 | 0.81mi |
| 1332 Eubanks Ave Atlanta, GA | 2.0 | 1.0 | 714 | $1,025 | $1.44 | 43d | 1 | 0.83mi |
| 3526 Conley St College Park, GA | 3.0 | 1.0 | 952 | $1,425 | $1.50 | 24d | 1 | 0.88mi |
| 3567 Adams St Unit A College Park, GA | 2.0 | 1.0 | 850 | $1,300 | $1.53 | 43d | 1 | 0.89mi |
| 3586 Jackson St Atlanta, GA | 2.0 | 2.0 | 1015 | $1,399 | $1.38 | 3d | 1 | 0.89mi |
| 3041 North St Unit B East Point, GA | 2.0 | 1.0 | 650 | $895 | $1.38 | 43d | 1 | 0.89mi |
| 1377 Pine Ave Atlanta, GA | 3.0 | 2.0 | 1100 | $1,675 | $1.52 | 22d | 1 | 0.92mi |
| 1742 Ware Ave Atlanta, GA | 2.0 | 1.0 | 916 | $1,300 | $1.42 | 24d | 1 | 0.92mi |
| 2637 Lester St Atlanta, GA | 2.0 | 1.0 | 750 | $1,300 | $1.73 | 19d | 1 | 0.93mi |
| 3128 Chateau Blvd East Point, GA | 1.0–2.0 | 1.0 | 1000 | $1,395 | $1.40 | 15d | 12 | 0.96mi |
| 1244 Calhoun Ave Atlanta, GA | 3.0 | 1.5 | 1072 | $1,673 | $1.56 | 43d | 1 | 0.97mi |
| 3631 Washington St Unit 5 College Park, GA | 2.0 | 1.0 | 800 | $1,125 | $1.41 | 5d | 1 | 0.97mi |
| 2627 N Church St East Point, GA | 2.0–3.0 | 1.0–2.0 | 1020 | $1,375 | $1.35 | 22d | 2 | 0.99mi |
| 1784 Temple Ave Unit 4 College Park, GA | 2.0 | 1.0 | 900 | $1,349 | $1.50 | 43d | 1 | 1.00mi |
| 3198 Washington Rd Atlanta, GA | 2.0 | 1.5 | 1000 | $1,500 | $1.50 | 43d | 1 | 1.01mi |
| 3445 Almand Dr Atlanta, GA | 2.0 | 2.0 | 1018 | $1,700 | $1.67 | 20d | 1 | 1.01mi |
| 3633 Howard Dr Atlanta, GA | 2.0 | 1.0–2.0 | 906 | $1,250 | $1.38 | 43d | 1 | 1.04mi |
| 3030 Remington St Atlanta, GA | 3.0 | 1.0 | 1100 | $1,200 | $1.09 | 24d | 1 | 1.06mi |
Listing history 3 events
-
2026-06-08statusdays on market $100,000 Pending 3 DOM
-
2026-06-07remarks 699-char remark
-
2026-06-07$100,000 Active 2 DOM
ⓘ Source: listings_history table (triggers on properties + properties_extension) + one-shot
backfill from property_details.listing_events for pre-trigger history.
Tax reassessment forecast GA · Resets to sale price
- Current annual tax
- $1,760 · $147/mo
- Projected year-2 tax
- $1,760 · $147/mo
- Expected delta
- $0/yr ($0/mo · 0.0%)
ⓘ Screening estimate from a state-policy table — verify with the county assessor before closing.
Climate risk First Street
- Flood 1/10 Low FEMA zone X (unshaded) · 0% chance over 30 yrs
- Wildfire 1/10 Low
- Heat 6/10 Major 7 d/yr ≥103°F today · 18 d/yr by 30 yrs out
- Wind 6/10 Major 27% chance of damaging wind over 30 yrs
- Air quality 4/10 Moderate 4 unhealthy d/yr today · 6 by 30 yrs out
Nearby sold comps map
Loading sold comps map…
Walkable amenities ~0.75 mi
Loading nearby amenities…
Taxation est. · year 1
- Rental income
- $17,264
- − Mortgage interest
- −$5,602
- − Property taxes
- −$1,760
- − Insurance
- −$500
- − Repairs & maintenance
- −$1,381
- − Management
- −$1,381
- − Depreciation
- −$2,909
- Taxable income
- $3,731
- Est. tax owed @ 24.0%
- −$895
- After-tax cash flow
- $4,190/yr
For passive investors: Depreciation is non-cash, so a rental often shows a tax loss while cash-flowing — sheltering income. Rental losses are passive: they offset passive income freely, and up to $25,000/yr can offset ordinary (W-2) income if you actively participate and your MAGI is under $100k (phasing out to $0 by $150k); unused losses carry forward. On sale, claimed depreciation is recaptured at up to 25%, and gains may owe capital-gains tax (a 1031 exchange can defer both). Figures are a year-1 estimate at your 24.0% rate — not tax advice; consult a CPA.
Schools (NCES district)
- District
- Fulton County
- NCES district ID
- 1302280
- Math proficiency
- 49% ▼ -2.00%
- Reading proficiency
- 53% ▬ 0.00%
- Median HH income
- $68,035
- Composite
- 45.33/100
- National rank
- #2640
- State rank
- #12 of 174 in GA
Livability — East Point
- Score
- 72/100
- State rank
- #72
- US rank
- #6314
Category grades
Schools grade is shown separately in the Schools card above.
Census & demographics
- Census place
- East Point, GA
- County
- Fulton County · 1,094,430 people
- City population
- 35,456
- Metro
- Atlanta-Sandy Springs-Alpharetta, GA
- Population (ZIP)
- 35,456
- Household income
- $68,380
- Rent vs Own
- Severe rent burden
- 2226.0
Population outlook (Fulton County) Hauer SSP2
- Today (2025)
- 1,203,707 people
- By 2030
- 1,299,706 · +8.0%
- By 2040
- 1,488,256 · +23.6%
- By 2050
- 1,664,580 · +38.3%
- By 2075
- 2,036,072 · +69.2%
- By 2100
- 2,222,402 · +84.6%
Race, ethnicity, and origin ACS 2023
- Neighborhood character
- Predominantly Black (74%)
- Race & ethnicity
- Black 74% White 11% Hispanic / Latino 11% Two or more races 6%
- Hispanic origin (detail)
- Mexican 7% Puerto Rican 1%
- Common ancestry
- Italian 1% Swiss 1% Russian 1%
- Foreign-born
- 6% · Canada, Jamaica
- Languages at home
- 87% English-only · Spanish 9% Other Indo-European 1% German/W. Germanic 1%
Political lean MEDSL · Fulton
- 2024 margin
- Solid D (+44.9) · D 71.9% · R 27.0% · Other 1.1%
- 2008→2024 swing
- +9.8pp toward D · 2008: 35.0pp · 2024: 44.9pp
- All cycles
- 2024: D+44.9 2020: D+46.4 2016: D+42.1 2012: D+29.6 2008: D+35.0
Not yet ingested
- Civics
- —
Market trends
- HPI YoY
- ▼ -113.15%
- Current HPI
- 251.7916
- Rent YoY
- ▲ 1.35%
- Metro
- Atlanta-Sandy Springs-Alpharetta, GA
- State GDP YoY
- ▲ 2.66%
- F500 in state
- 28
Industry mix (Fortune 500 HQ in GA)
| Industry | F500 HQs | Revenue |
|---|---|---|
| Paper / Packaging | 2 | $29B |
|
||
| Retail | 1 | $160B |
|
||
| Transportation / Logistics | 1 | $91B |
|
||
| Airlines | 1 | $62B |
|
||
| Consumer Goods | 1 | $47B |
|
||
| Utilities | 1 | $25B |
|
||
Price history
+81.8% since first listed10 events — show timeline
- 2026-05-28 Listed $100,000 FMLS
- 2026-05-28 Listed $100,000 GAMLS
- 2022-11-30 Listing Removed — GAMLS
- 2022-06-16 Relisted — GAMLS
- 2022-06-16 Price Changed $150,000 GAMLS
- 2022-06-03 Pending — GAMLS
- 2022-05-03 Listed $160,000 GAMLS
- 2004-09-14 Sold (Public Records) $80,000 Public Records
- 2004-09-08 Sold (Public Records) $63,000 Public Records
- 2002-04-29 Sold (Public Records) $55,000 Public Records
Property tax history
+2.2%/yrLatest (2025): $1,760 · -19.9% YoY. Source: county tax records.
Cash-flow waterfall
monthlySold comps — $/sqft
last 12 mo · ≤1 miLoading sold comps…