 Duplex
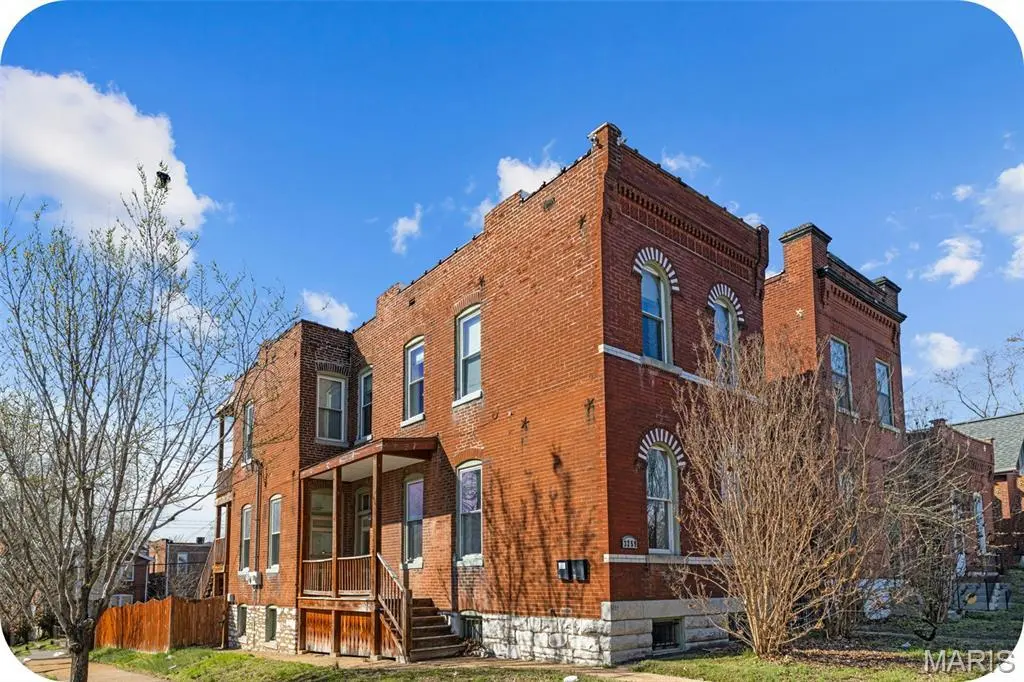
3259 Minnesota Ave · St. Louis, MO
Flood risk 1/10 · Minimal
- FEMA flood zone
- X (unshaded)
- Chance of flooding over 30 yrs
- 0.0%
- Est. flood insurance / yr
- $473 – $860
Fire risk 1/10 · Minimal
- Est. fire insurance / yr
- $1,054 – $1,958
Heat risk 5/10 · Moderate
- Hot days now (above 108°F)
- 7 days/yr
- Hot days in 30 yrs
- 21 days/yr
Wind risk 2/10 · Minimal
- Chance of severe wind over 30 yrs
- 1.0%
Air-quality risk 3/10 · Minor
- Unhealthy air days now
- 3 days/yr
- Unhealthy air days in 30 yrs
- 4 days/yr
Risk factors via First Street. Map © Google.
Why this score? — see what drove the C grade
The composite is a weighted blend of 9 inputs, each scored 0–100. Each bar is that input's sub-score; the figure is the points it added to the 100-point composite (weight × sub-score).
- Cash flow +24.3/30.0
- DSCR +7.8/10.0
- ARV discount +7.5/15.0
- 1% rule +6.3/10.0
- Rent growth +3.7/5.0
- Livability +2.5/5.0
- Condition / age +2.5/5.0
- Schools +1.2/10.0
- Appreciation +0.0/10.0
$200,000
🖨 Deal sheet (PDF) 📄 Offer letter ✓ Due diligence
Multi-family units
County records classify this as Multi-Family (2-4 Unit). Listing-text estimate: 2 units. confirmed
Listing remarks
Historic brick 2-family in the heart of Benton Park West offering an excellent opportunity for a seasoned investor looking to add to their portfolio or for someone looking to get started in real estate investing with a solid investment property. This classic 2-story building features two nearly 900 sq ft units, each offering 2 bedrooms, 1 bathroom, in-unit laundry, and well-maintained, updated interiors. Both units are occupied with strong rental income already in place. One lease is through 10/2026 and the other through 5/2027, providing immediate cash flow and stability. Additional features include a fenced backyard and off-street 2-car parking pad in the rear. Fantastic city location jus
Key facts
- Updated interiors
- Fenced backyard
- Strong rental income
Tags
Property features AI
Finance
- Financial info: Residential income property with 2 total units (both currently leased)
Exterior
- Parking: Off-street parking pad (alley access)
- Utilities: Public water; Single phase electric
- Home design: Duplex / multi-family property; Two-story building; Above-grade finished area approximately 1,776 (public records)
- Construction: Brick and stone construction; Stone foundation
- Exterior features: Back yard fencing; Off-street parking with concrete parking pad and alley access
Interior
- Bedrooms: Two 2-bedroom units (one 2-bedroom unit and another 2-bedroom unit)
- Bathrooms: Each unit has 1 bathroom
- Heating & cooling: Forced air heating; Central air conditioning
- Interior features: Full unfinished walk-out basement
Neighborhood map
What this means for you Summary
Snapshot
- This is a 2 × 2-bed/1.0-bath units multifamily listed at $200k.
Deal economics
- At list price, monthly cash flow is $401 ($5k/yr) — positive. Per door: $200/mo.
- The deal already cash-flows at list — no discount required.
- Meets the 1% rule at list price ($2k rent vs $200k).
- Cap rate 8.7% vs local median 5.0% in St. Louis — top-decile yield for the area; either an underpriced asset or a hidden risk that comps aren't pricing in. Stress-test before assuming the spread holds.
Location & tenants
- Location reads: area grade C — affects rentability + tenant quality, not the cash-flow math above.
- St. Louis City (urban): math 10% / reading 18% proficiency, ranked #312 of 324 in MO (top 96%) — low school quality limits family demand, transient renter base, plan for 1-2y turnover; 80% free/reduced lunch — lower-income household profile, screen leases tightly.
- Zoned schools: Froebel Elem. (math 8% / reading 8%, grade F, #1,052 of 1,115 statewide, top 95%, 176 students, 98% FRL); Gateway Middle (math 0% / reading 8%, grade F, #389 of 391 statewide, top 100%, 506 students, 99% FRL); Roosevelt High (math 2% / reading 8%, grade F, #517 of 521 statewide, top 100%, 460 students, 99% FRL) — zoned schools average 99% FRL vs 80% district-wide (18 pts higher); higher-poverty schools than district average — tighter screening recommended.
- Market conditions: Rents rising fast (+4.9%/yr); 242 active listings in the ZIP; 38 comparable units currently listed for rent nearby; rentals at typical pace (median 16d on market — plan ~3-4 weeks tenant-placement turnaround); 294 units permitted in St. Louis city in 2024 (227 in 5+ unit buildings).
- At $2,257/mo this rent would consume 47% of the median local household income ($58k/yr) (locally 1495% of renters already pay >50% of income on rent) — very limited rent-growth headroom before tenants either downsize or default.
Forward outlook
- Local home prices are declining (-3.0%/yr); year-one equity from $1k of loan paydown is wiped out by about $6k of value loss. Plan a longer hold.
- St. Louis County population projected to shrink 6% by 2050 — rents likely to lag national; underwrite the cash flow, not the appreciation.
- At projected returns (-3.0% appreciation + 4.9% rent growth), your $56k cash investment doubles in ~10 years — after that, you're playing with house money.
Negotiation context
- Only 6 days on market — expect competitive offers; lowballing is unlikely to land.
Risks & watch-outs
- Watch-outs: built in 1896 — expect roof / HVAC / electrical / plumbing capex.
- Climate carrying-cost: extreme-heat days projected 7→21/yr by 2055 (HVAC capex compounding) — expect insurance premiums to compound above CPI over the hold.
Questions for the listing agent
- Can we see the unit-by-unit rent roll, current vacancy, and any below-market leases? What's the average tenancy length?
- What capital expenditures (roof, boiler, parking lot, exteriors) have been made in the last 5 years, and what's planned in the next 2?
- Built in 1896 — when were the roof, HVAC, electrical panel, plumbing, and water heater last replaced?
- Is there a deadline driving the sale (1031 exchange, divorce, estate, relocation)? That informs how much negotiation room exists.
- What's the average days-on-market for RENTAL listings here right now (not sales)? A rising rental-DOM trend means longer vacancies and softer asking-rent achievability than the comps imply.
- What's the recent tenant-quality profile in this submarket — average credit score on applications, eviction rate, late-payment / NSF rate, and stable-employment percentage? A property-management company in the area should have these aggregated.
- How much new apartment / multifamily construction is in the pipeline within 1–3 miles? Heavy new supply (>2% of stock underway) typically softens rents 12–24 months out; light construction supports rent growth.
Investment metrics
- 1% rule
- 1.13% ✓
- Cap rate
- 8.70%
- Cash-on-cash
- 8.59%
- DSCR
- 1.38
- GRM
- 7.4
CMA / ARV
- ARV (on-the-fly)
- $115,440
- Comps found
- 9
Show comp detail 9 sales within ~0.75 mi
| Address | Dist | Beds/Ba | Sqft | Sold | Price | $/sf | Match |
|---|---|---|---|---|---|---|---|
| 3231 Gravois Ave | 0.17mi | 4/2.0 | 1,776 (0%) | 4mo | $265,000 | $149 | 89 |
| 3229 Gravois Ave | 0.17mi | 4/2.0 | 1,776 (0%) | 15mo | $110,000 | $62 | 80 |
| 3507 Pennsylvania Ave | 0.28mi | 4/2.0 | 1,760 (-1%) | 14mo | $155,000 | $88 | 74 |
| 3118 Utah St | 0.03mi | 4/2.0 | 1,980 (+12%) | 17mo | $114,900 | $58 | 65 |
| 2804 Wyoming St | 0.27mi | 4/2.0 | 1,862 (+5%) | 21mo | $260,000 | $140 | 62 |
| 3512 Minnesota Ave | 0.29mi | 4/2.0 | 2,000 (+13%) | 18mo | $129,900 | $65 | 50 |
| 3707 Oregon Ave | 0.56mi | 3/2.0 (-1) | 1,632 (-8%) | 14mo | $59,900 | $37 | 44 |
| 3641 Michigan Ave | 0.47mi | 4/2.0 | 1,998 (+12%) | 23mo | $34,900 | $17 | 38 |
| 3733 Michigan Ave | 0.58mi | 4/2.0 | 1,978 (+11%) | 22mo | $134,900 | $68 | 36 |
Match score weights: distance 35% · size 25% · config 20% · recency 20%. Top-matched comps best support the ARV.
Projected returns pro-forma
-3.0% appreciation · 4.89% rent growth · sell at horizon
- IRR
- -1.1%
- Equity multiple
- 0.96×
- Total profit
- $-2,470
- Equity at exit
- $29,821
- IRR
- 10.5%
- Equity multiple
- 1.88×
- Total profit
- $49,515
- Equity at exit
- $17,292
Cash invested: $56,000 (down + closing). Projections, not guarantees.
Landlord ↔ Tenant lean methodology
- Overall (STATE)
- 81 Strongly Landlord-Friendly
- State Missouri
- 81 Strongly Landlord-Friendly · R+10
- County
- — inherits STATE
- City
- — inherits STATE
ZIP-level market 63118
- Rents YoY
- 4.9%
- Active inventory
- 242
- Price-to-rent
- 14.8×
Monthly cashflow live
- Estimated rent
- $2,257 high interval (Pro) →
- Mortgage (P&I)
- −$1,049
- Tax est. 1.5%
- −$250 /mo · $3,000/yr
- Insurance
- −$83
- HOA
- −$0
- Vacancy / Maint / Mgmt
- −$474
- Net cashflow
- $401
Break-even live
Sensitivity live
| Price | -10% $539 | -5% $470 | +0% $401 | +5% $332 | +10% $263 |
|---|---|---|---|---|---|
| Rent | -10% $223 | -5% $312 | +0% $401 | +5% $490 | +10% $579 |
| Rate | -1.0pp $502 | -0.5pp $452 | base $401 | +0.5pp $349 | +1.0pp $296 |
2-unit breakdown (identical units grouped — click to expand)
| Units | Beds | Baths | Est. rent |
|---|---|---|---|
| 2× units | 2 | 1 | $2,256 |
| #1 | 2 | 1 | $1,128 |
| #2 | 2 | 1 | $1,128 |
| Total (2 units) | $2,257 | ||
UW: 25.0% down · 7.5% · 30yr · 1.5% tax · 5.0% vac · 8.0% maint · 8.0% mgmt
Financing live
Cash to close
- Down payment
- $50,000
- Closing costs
- $6,000
- Reserves months
- —
- Total cash needed
- —
Loan-product check · same deal, 3 products live
Conventional
25% down · 7.5% · 30yr
- Down + closing
- —
- Monthly P&I
- —
- Monthly cashflow
- —
- DSCR
- —
- Eligible?
- —
Personal DTI + credit; lowest rate.
DSCR
20% down · 8.5% · 30yr
- Down + closing
- —
- Monthly P&I
- —
- Monthly cashflow
- —
- DSCR
- —
- Eligible?
- —
No personal income docs; deal must DSCR.
Hard money
10% down · 12.0% · 12mo
- Down + closing
- —
- Monthly P&I
- —
- Monthly cashflow
- —
- DSCR
- —
- Eligible?
- —
Short-term bridge; refi at stabilization.
Rent comps 38 comps
| Address | Beds | Baths | Sqft | Rent | $/sqft | DOM | Units | Dist |
|---|---|---|---|---|---|---|---|---|
| 3411 Cherokee St St. Louis, MO | 4.0 | 2.0 | 1568 | $1,825 | $1.16 | 0d | 1 | 0.31mi |
| 3540 Michigan Ave Saint Louis, MO | 4.0 | 2.0 | 1758 | $1,800 | $1.02 | 3d | 1 | 0.33mi |
| 3510 California Ave Saint Louis, MO | 3.0 | 2.0 | 1800 | $1,200 | $0.67 | 45d | 1 | 0.36mi |
| 3429 Ohio Ave Saint Louis, MO | 3.0 | 3.0 | 1938 | $2,250 | $1.16 | 18d | 1 | 0.39mi |
| 2643 Wyoming St Saint Louis, MO | 3.0 | 2.5 | 2592 | $2,600 | $1.00 | 45d | 1 | 0.41mi |
| 3628 Wyoming St Unit 2F St. Louis, MO | 4.0 | 1.0 | 1700 | $1,950 | $1.15 | 45d | 1 | 0.58mi |
| 3458 Giles Ave Saint Louis, MO | 3.0 | 2.5 | 2204 | $2,400 | $1.09 | 9d | 1 | 0.64mi |
| 2664 Nebraska Ave Unit 2F Saint Louis, MO | 3.0 | 1.0 | 1350 | $1,150 | $0.85 | 25d | 1 | 0.67mi |
| 2648 California Ave Saint Louis, MO | 4.0 | 2.0 | 2458 | $2,000 | $0.81 | 25d | 1 | 0.71mi |
| 3131 Keokuk St #3131 Saint Louis, MO | 3.0 | 2.0 | 1500 | $1,475 | $0.98 | 16d | 1 | 0.73mi |
| 3526 S Spring Ave Saint Louis, MO | 4.0 | 2.0 | 2244 | $2,877 | $1.28 | 45d | 1 | 0.75mi |
| 3146 Keokuk St Saint Louis, MO | 3.0 | 1.0 | 1528 | $1,500 | $0.98 | 25d | 1 | 0.76mi |
| 3450 Wisconsin Ave Saint Louis, MO | 1.0–3.0 | 1.0–2.0 | 1219 | $2,300 | $1.89 | 0d | 15 | 0.78mi |
| 3807 Potomac St Saint Louis, MO | 3.0 | 1.0 | 2588 | $1,300 | $0.50 | 9d | 1 | 0.82mi |
| 3807 Potomac St Saint Louis, MO | 3.0 | 1.0 | 2588 | $1,100 | $0.43 | 45d | 1 | 0.82mi |
| 2327 Texas Ave Apt 205 St. Louis, MO | 3.0 | 2.0 | 1375 | $2,095 | $1.52 | 19d | 1 | 0.92mi |
| 3908 McDonald Ave Saint Louis, MO | 3.0 | 2.0 | 1927 | $2,500 | $1.30 | 6d | 1 | 0.92mi |
| 3176 Gustine Ave Apt 1S St. Louis, MO | 3.0 | 1.0 | 1600 | $1,675 | $1.05 | 0d | 1 | 0.92mi |
| 4005 S Grand Blvd Saint Louis, MO | 4.0 | 1.0 | 1323 | $1,150 | $0.87 | 18d | 1 | 1.00mi |
| 4135 S Compton Ave Saint Louis, MO | 3.0 | 2.0 | 2104 | $1,600 | $0.76 | 45d | 1 | 1.07mi |
| 4145 S Compton Ave Saint Louis, MO | 3.0 | 2.0 | 1656 | $1,520 | $0.92 | 45d | 1 | 1.09mi |
| 2253 Indiana Ave Saint Louis, MO | 4.0 | 3.5 | 1760 | $2,600 | $1.48 | 9d | 1 | 1.09mi |
| 3637 Meramec St Saint Louis, MO | 3.0 | 1.5 | 1632 | $1,925 | $1.18 | 19d | 1 | 1.17mi |
| 3802 Flad Ave St. Louis, MO | 3.0 | 1.0 | 1350 | $1,399 | $1.04 | 0d | 1 | 1.18mi |
| 3802 Flad Ave St. Louis, MO | 3.0 | 1.0 | 1350 | $1,499 | $1.11 | 9d | 1 | 1.18mi |
| 3925 Shenandoah Ave St. Louis, MO | 3.0 | 1.0 | 1250 | $1,500 | $1.20 | 4d | 1 | 1.22mi |
| 4217 S Grand Blvd Unit 1 St. Louis, MO | 3.0 | 1.0 | 1250 | $1,400 | $1.12 | 5d | 1 | 1.22mi |
| 4222 S 38th St St. Louis, MO | 3.0 | 2.0 | 1836 | $1,400 | $0.76 | 0d | 1 | 1.23mi |
| 4222 S 38th St Unit 4222 St. Louis, MO | 3.0 | 2.0 | 1836 | $1,400 | $0.76 | 22d | 1 | 1.23mi |
| 4312 Oregon Ave Saint Louis, MO | 4.0 | 2.0 | 2032 | $2,000 | $0.98 | 0d | 1 | 1.28mi |
| 2018 Ann Ave Unit 1F St. Louis, MO | 3.0 | 1.0 | 1300 | $1,450 | $1.12 | 45d | 1 | 1.28mi |
| 4145-4147 Hartford St St. Louis, MO | 4.0 | 3.5 | 2400 | $3,800 | $1.58 | 13d | 1 | 1.34mi |
| 2027 Russell Blvd Saint Louis, MO | 3.0 | 2.5 | 1687 | $2,100 | $1.24 | 13d | 1 | 1.36mi |
| 2027 Russell Blvd Saint Louis, MO | 3.0 | 2.5 | 1687 | $2,100 | $1.24 | 21d | 1 | 1.36mi |
| 2029 Russell Blvd Saint Louis, MO | 3.0 | 3.0 | 1500 | $1,900 | $1.27 | 45d | 1 | 1.36mi |
| 3628 Shaw Blvd Unit 1F St. Louis, MO | 3.0 | 2.0 | 1350 | $1,995 | $1.48 | 9d | 1 | 1.36mi |
| 4450 Pennsylvania Ave Saint Louis, MO | 3.0 | 1.0 | 1500 | $1,250 | $0.83 | 0d | 1 | 1.47mi |
| 2406 S 10th St Saint Louis, MO | 3.0 | 2.0 | 2000 | $1,795 | $0.90 | 0d | 1 | 1.47mi |
Listing history 3 events
-
2026-05-22$200,000 Active
-
2007-10-24soldstatus
-
2007-06-07soldstatus
ⓘ Source: listings_history table (triggers on properties + properties_extension) + one-shot
backfill from property_details.listing_events for pre-trigger history.
Climate risk First Street
- Flood 1/10 Low FEMA zone X (unshaded) · 0% chance over 30 yrs
- Wildfire 1/10 Low
- Heat 5/10 Major 7 d/yr ≥108°F today · 21 d/yr by 30 yrs out
- Wind 2/10 Low 100% chance of damaging wind over 30 yrs
- Air quality 3/10 Moderate 3 unhealthy d/yr today · 4 by 30 yrs out
Nearby sold comps map
Loading sold comps map…
Walkable amenities ~0.75 mi
Loading nearby amenities…
Taxation est. · year 1
- Rental income
- $27,084
- − Mortgage interest
- −$11,203
- − Property taxes
- −$3,000
- − Insurance
- −$1,000
- − Repairs & maintenance
- −$2,167
- − Management
- −$2,167
- − Depreciation
- −$5,818
- Taxable income
- $1,729
- Est. tax owed @ 24.0%
- −$415
- After-tax cash flow
- $4,395/yr
For passive investors: Depreciation is non-cash, so a rental often shows a tax loss while cash-flowing — sheltering income. Rental losses are passive: they offset passive income freely, and up to $25,000/yr can offset ordinary (W-2) income if you actively participate and your MAGI is under $100k (phasing out to $0 by $150k); unused losses carry forward. On sale, claimed depreciation is recaptured at up to 25%, and gains may owe capital-gains tax (a 1031 exchange can defer both). Figures are a year-1 estimate at your 24.0% rate — not tax advice; consult a CPA.
Schools (NCES district)
- District
- St. Louis City
- NCES district ID
- 2929280
- Math proficiency
- 10% ▼ -6.00%
- Reading proficiency
- 18% ▼ -3.00%
- Median HH income
- $35,685
- Composite
- 11.54/100
- National rank
- #9699
- State rank
- #312 of 324 in MO
Livability — St. Louis
No livability data for this city. (Only ~50 U.S. cities are tracked.)
Census & demographics
- Census place
- St. Louis, MO
- County
- Saint Louis City · 254,015 people
- City population
- 283,259
- Metro
- St. Louis, MO-IL
- Population (ZIP)
- 25,913
- Household income
- $57,762
- Rent vs Own
- Severe rent burden
- 1495.0
Population outlook (St. Louis County) Hauer SSP2
- Today (2025)
- 315,737 people
- By 2030
- 313,865 · -0.6%
- By 2040
- 305,439 · -3.3%
- By 2050
- 296,529 · -6.1%
- By 2075
- 271,028 · -14.2%
- By 2100
- 255,359 · -19.1%
Race, ethnicity, and origin ACS 2023
- Neighborhood character
- Diverse neighborhood (Simpson 0.63)
- Race & ethnicity
- White 44% Black 41% Two or more races 8% Hispanic / Latino 8% Asian 2%
- Hispanic origin (detail)
- Mexican 6%
- Common ancestry
- Slovak 2% Lithuanian 2% Romanian 2%
- Foreign-born
- 6% · Canada, Vietnam
- Languages at home
- 90% English-only · Spanish 5% Vietnamese 1% French/Haitian/Cajun 1%
Political lean MEDSL · St. Louis
- 2024 margin
- Solid D (+64.7) · D 81.4% · R 16.7% · Other 2.0%
- 2008→2024 swing
- -3.5pp toward R · 2008: 68.2pp · 2024: 64.7pp
- All cycles
- 2024: D+64.7 2020: D+66.2 2016: D+63.7 2012: D+66.6 2008: D+68.2
Not yet ingested
- Civics
- —
Market trends
- HPI YoY
- ▼ -347.51%
- Current HPI
- 171.5963
- Rent YoY
- ▲ 4.89%
- Metro
- St. Louis, MO-IL
- State GDP YoY
- ▲ 1.84%
- F500 in state
- 20
Industry mix (Fortune 500 HQ in MO)
| Industry | F500 HQs | Revenue |
|---|---|---|
| Healthcare | 1 | $163B |
|
||
| Insurance | 1 | $21B |
|
||
| Industrial Technology | 1 | $17B |
|
||
| Retail | 1 | $16B |
|
||
| Industrial Distribution | 1 | $10B |
|
||
| Utilities | 1 | $9B |
|
||
Price history
3 events — show timeline
- 2026-05-22 Listed $200,000 MARIS as Distributed by MLS Grid
- 2007-10-24 Sold (Public Records) — Public Records
- 2007-06-07 Sold (Public Records) — Public Records
Property tax history
+2.9%/yrLatest (2024): $357 · +4.8% YoY. Source: county tax records.
Cash-flow waterfall
monthlySold comps — $/sqft
last 12 mo · ≤1 miLoading sold comps…