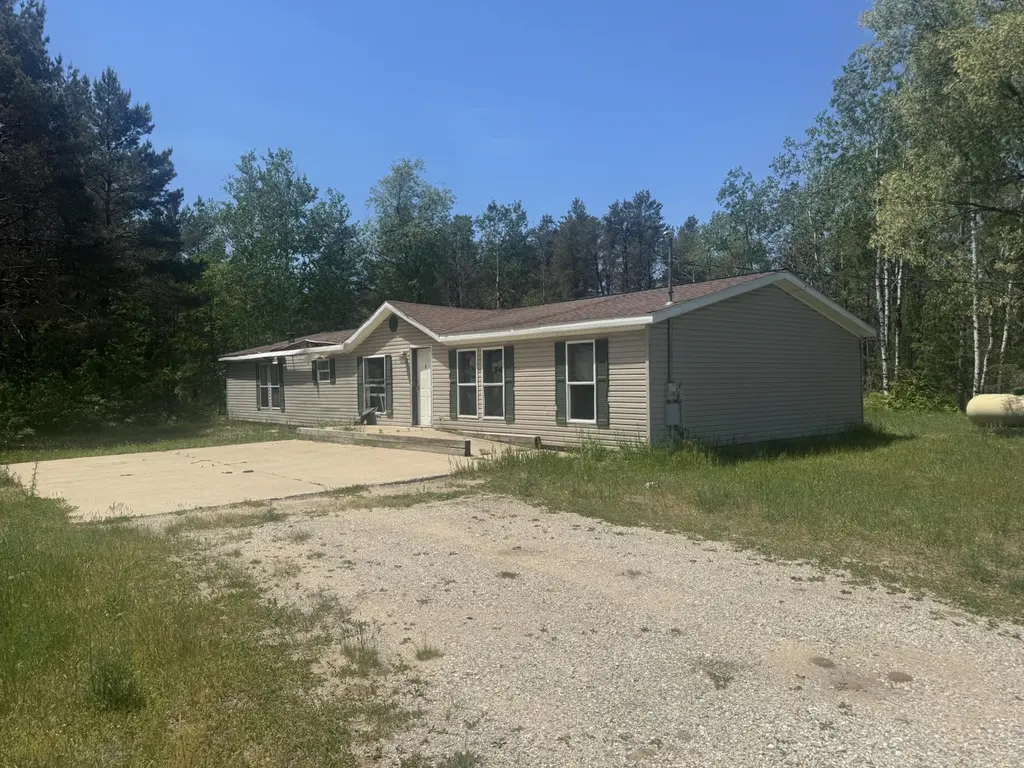
9789 N Wheeler Lake Rd NE · Mancelona, MI
Flood risk 1/10 · Minimal
- FEMA flood zone
- —
- Chance of flooding over 30 yrs
- 0.0%
- Est. flood insurance / yr
- —
Fire risk 4/10 · Minor
- Est. fire insurance / yr
- $784 – $1,456
Heat risk 1/10 · Minimal
- Hot days now (above 92°F)
- 7 days/yr
- Hot days in 30 yrs
- 13 days/yr
Wind risk 1/10 · Minimal
- Chance of severe wind over 30 yrs
- —
Air-quality risk 2/10 · Minimal
- Unhealthy air days now
- 0 days/yr
- Unhealthy air days in 30 yrs
- 1 days/yr
Risk factors via First Street. Map © Google.
Why this score? — see what drove the B- grade
The composite is a weighted blend of 9 inputs, each scored 0–100. Each bar is that input's sub-score; the figure is the points it added to the 100-point composite (weight × sub-score).
- Cash flow +30.0/30.0
- 1% rule +10.0/10.0
- DSCR +10.0/10.0
- ARV discount +7.5/15.0
- Livability +3.9/5.0
- Schools +2.9/10.0
- Rent growth +2.5/5.0
- Condition / age +2.5/5.0
- Appreciation +0.0/10.0
$40,000
🖨 Deal sheet (PDF) 📄 Offer letter ✓ Due diligence
Listing remarks MLS
Manufactured 4BR 2BA 2116 sf home on 1 acre. Located between Kalkaska and Mancelona. This home has lots of space to spread out with a family and a living room, along with an additional office/computer room. Comes with all appliances including washer and dryer. New roof in 2012, front and back deck for enjoying the privacy and quiet of this location. Easy commute to both Mancelona and Kalkaska. Affordable housing.
Key facts
- Listed 11 days
Tags
Property features AI
Exterior
- Utilities: Well water; Septic tank
- Home design: Single-family residence; Residential property
- Exterior features: Gravel road access; Approximately 1 acre lot
Interior
- Bathrooms: 2 full bathrooms
- Heating & cooling: Propane heating; Heating present
- Interior features: Crawl space basement
- Laundry & utility: Laundry on the main level
Neighborhood map
What this means for you Summary
Snapshot
- This is a 3-bed/1.5-bath single-family listed at $40k.
Deal economics
- At list price, monthly cash flow is $660 ($8k/yr) — positive.
- The deal already cash-flows at list — no discount required.
- Meets the 1% rule at list price ($1k rent vs $40k).
- Cap rate 26.1% vs local median 3.3% in Mancelona — top-decile yield for the area; either an underpriced asset or a hidden risk that comps aren't pricing in. Stress-test before assuming the spread holds.
Location & tenants
- Location reads 78/100 on livability (#105 in MI, #2,568 nationally) — a middle-class / working-renter tenant base. Strengths: cost of living A+, housing A+, health & safety A+; Watch: schools D-, amenities F, commute F.
- Mancelona Public Schools (rural): math 28% / reading 41% proficiency, ranked #310 of 540 in MI (top 57%) — families likely to look elsewhere, expect single-tenant / working-renter base with shorter leases; 60% free/reduced lunch — lower-income household profile, screen leases tightly.
- Market conditions: 155 active listings in the ZIP; 38 units permitted in Kalkaska County in 2024 (0 in 5+ unit buildings).
Forward outlook
- Local home prices are declining (-3.0%/yr); year-one equity from $277 of loan paydown is wiped out by about $1k of value loss. Plan a longer hold.
- Kalkaska County population projected to shrink 9% by 2050 — rents likely to lag national; underwrite the cash flow, not the appreciation.
- At projected returns (-3.0% appreciation + 3.0% rent growth), your $11k cash investment doubles in ~2 years — after that, you're playing with house money.
Negotiation context
- Only 11 days on market — expect competitive offers; lowballing is unlikely to land.
- 4 sale attempts since 20y ago with the ask held roughly flat each time — persistent listings suggest the price (not the market) is what's stuck; bring a comps-based counter.
Risks & watch-outs
- Watch-outs: property tax is 3.6% of price.
Questions for the listing agent
- Property tax is high relative to price — has the assessment been appealed recently, and will the sale trigger a re-assessment?
- Is there a deadline driving the sale (1031 exchange, divorce, estate, relocation)? That informs how much negotiation room exists.
- Schools are D-rated, which usually means shorter tenancies and higher turnover. Who's the typical renter profile here, and what's been the actual vacancy rate?
- What's the average days-on-market for RENTAL listings here right now (not sales)? A rising rental-DOM trend means longer vacancies and softer asking-rent achievability than the comps imply.
- What's the recent tenant-quality profile in this submarket — average credit score on applications, eviction rate, late-payment / NSF rate, and stable-employment percentage? A property-management company in the area should have these aggregated.
- How much new for-sale + rental construction is in the pipeline within 1–3 miles? Heavy new supply typically softens prices + rents 12–24 months out; constrained supply supports both.
Investment metrics
- 1% rule
- 3.18% ✓
- Cap rate
- 26.10%
- Cash-on-cash
- 70.73%
- DSCR
- 4.15
- GRM
- 2.6
CMA / ARV
No comps found within radius.
Projected returns pro-forma
-3.0% appreciation · 3.0% rent growth · sell at horizon
- IRR
- 70.4%
- Equity multiple
- 4.18×
- Total profit
- $35,626
- Equity at exit
- $5,964
- IRR
- 74.4%
- Equity multiple
- 8.63×
- Total profit
- $85,414
- Equity at exit
- $3,458
Cash invested: $11,200 (down + closing). Projections, not guarantees.
Landlord ↔ Tenant lean methodology
- Overall (STATE)
- 62 Landlord-Friendly
- State Michigan
- 62 Landlord-Friendly · EVEN
- County
- — inherits STATE
- City
- — inherits STATE
ZIP-level market 49659
- Home prices YoY
- -29.7%
- Active inventory
- 155
- Price-to-rent
- 2.6×
Monthly cashflow live
- Estimated rent
- $1,273 medium interval (Pro) →
- Mortgage (P&I)
- −$210
- Tax from tax record
- −$119 /mo · $1,432/yr
- Insurance
- −$17
- HOA
- −$0
- Vacancy / Maint / Mgmt
- −$267
- Net cashflow
- $660
Break-even live
Sensitivity live
| Price | -10% $683 | -5% $671 | +0% $660 | +5% $649 | +10% $638 |
|---|---|---|---|---|---|
| Rent | -10% $560 | -5% $610 | +0% $660 | +5% $710 | +10% $761 |
| Rate | -1.0pp $680 | -0.5pp $670 | base $660 | +0.5pp $650 | +1.0pp $639 |
UW: 25.0% down · 7.5% · 30yr · 1.5% tax · 5.0% vac · 8.0% maint · 8.0% mgmt
Financing live
Cash to close
- Down payment
- $10,000
- Closing costs
- $1,200
- Reserves months
- —
- Total cash needed
- —
Loan-product check · same deal, 3 products live
Conventional
25% down · 7.5% · 30yr
- Down + closing
- —
- Monthly P&I
- —
- Monthly cashflow
- —
- DSCR
- —
- Eligible?
- —
Personal DTI + credit; lowest rate.
DSCR
20% down · 8.5% · 30yr
- Down + closing
- —
- Monthly P&I
- —
- Monthly cashflow
- —
- DSCR
- —
- Eligible?
- —
No personal income docs; deal must DSCR.
Hard money
10% down · 12.0% · 12mo
- Down + closing
- —
- Monthly P&I
- —
- Monthly cashflow
- —
- DSCR
- —
- Eligible?
- —
Short-term bridge; refi at stabilization.
Listing history 10 events
-
2026-06-17status $40,000 Pending 11 DOM
-
2026-06-16days on market $40,000 Active Under Contract 11 DOM
-
2026-06-16status $40,000 Active Under Contract 10 DOM
-
2026-06-15days on market $40,000 Active 10 DOM
-
2026-06-13days on market $40,000 Active 8 DOM
-
2026-06-12days on market $40,000 Active 7 DOM
-
2026-06-09days on market $40,000 Active 4 DOM
-
2026-06-08days on market $40,000 Active 3 DOM
-
2026-06-07remarks 449-char remark
-
2026-06-07$40,000 Active 2 DOM
ⓘ Source: listings_history table (triggers on properties + properties_extension) + one-shot
backfill from property_details.listing_events for pre-trigger history.
Tax reassessment forecast MI · Partial reset (capped growth)
- Current annual tax
- $1,432 · $119/mo
- Projected year-2 tax
- $1,432 · $119/mo
- Expected delta
- $0/yr ($0/mo · 0.0%)
ⓘ Screening estimate from a state-policy table — verify with the county assessor before closing.
Climate risk First Street
- Flood 1/10 Low 0% chance over 30 yrs
- Wildfire 4/10 Moderate
- Heat 1/10 Low 7 d/yr ≥92°F today · 13 d/yr by 30 yrs out
- Wind 1/10 Low
- Air quality 2/10 Low 0 unhealthy d/yr today · 1 by 30 yrs out
Nearby sold comps map
Loading sold comps map…
Walkable amenities ~0.75 mi
Loading nearby amenities…
Taxation est. · year 1
- Rental income
- $15,279
- − Mortgage interest
- −$2,241
- − Property taxes
- −$1,432
- − Insurance
- −$200
- − Repairs & maintenance
- −$1,222
- − Management
- −$1,222
- − Depreciation
- −$1,164
- Taxable income
- $7,799
- Est. tax owed @ 24.0%
- −$1,872
- After-tax cash flow
- $6,050/yr
For passive investors: Depreciation is non-cash, so a rental often shows a tax loss while cash-flowing — sheltering income. Rental losses are passive: they offset passive income freely, and up to $25,000/yr can offset ordinary (W-2) income if you actively participate and your MAGI is under $100k (phasing out to $0 by $150k); unused losses carry forward. On sale, claimed depreciation is recaptured at up to 25%, and gains may owe capital-gains tax (a 1031 exchange can defer both). Figures are a year-1 estimate at your 24.0% rate — not tax advice; consult a CPA.
Schools (NCES district)
- District
- Mancelona Public Schools
- NCES district ID
- 2622350
- Math proficiency
- 28% ▼ -5.00%
- Reading proficiency
- 41% ▼ -9.00%
- Median HH income
- $39,613
- Composite
- 28.89/100
- National rank
- #6639
- State rank
- #310 of 540 in MI
Livability — Mancelona
- Score
- 78/100
- State rank
- #105
- US rank
- #2568
Category grades
Schools grade is shown separately in the Schools card above.
Census & demographics
- Population (ZIP)
- 7,226
Population outlook (Kalkaska County) Hauer SSP2
- Today (2025)
- 17,359 people
- By 2030
- 17,222 · -0.8%
- By 2040
- 16,643 · -4.1%
- By 2050
- 15,810 · -8.9%
- By 2075
- 13,772 · -20.7%
- By 2100
- 10,976 · -36.8%
Race, ethnicity, and origin ACS 2023
- Neighborhood character
- Predominantly White (93%)
- Race & ethnicity
- White 93% Two or more races 4% Hispanic / Latino 3%
- Common ancestry
- Lithuanian 7% Romanian 5% Italian 4%
- Foreign-born
- 1% · Canada
Political lean MEDSL · Kalkaska
- 2024 margin
- Solid R (+42.9) · D 27.8% · R 70.7% · Other 1.5%
- 2008→2024 swing
- -34.1pp toward R · 2008: -8.8pp · 2024: -42.9pp
- All cycles
- 2024: R+42.9 2020: R+41.7 2016: R+44.1 2012: R+19.7 2008: R+8.8
Not yet ingested
- Civics
- —
Market trends
- HPI YoY
- ▼ -103.79%
- Current HPI
- 245.5937
- Rent YoY
- —
- Metro
- —
- State GDP YoY
- ▲ 1.37%
- F500 in state
- 28
Industry mix (Fortune 500 HQ in MI)
| Industry | F500 HQs | Revenue |
|---|---|---|
| Automotive Parts | 3 | $48B |
|
||
| Automotive | 2 | $372B |
|
||
| Chemicals | 1 | $45B |
|
||
| Automotive Retail | 1 | $29B |
|
||
| Healthcare / Medical Devices | 1 | $23B |
|
||
| Automotive Technology | 1 | $20B |
|
||
Price history
-49.9% since first listed8 events — show timeline
- 2026-06-04 Listed $40,000 WWMLS
- 2021-10-19 Sold (MLS) $78,000 REALCOMP
- 2021-10-19 Sold (MLS) $78,000 MiRealSource-MiMLS
- 2021-01-28 Listed $89,900 REALCOMP
- 2021-01-28 Listed $89,900 MiRealSource-MiMLS
- 2011-10-31 Sold (Public Records) $35,000 Public Records
- 2007-01-12 Sold (MLS) $79,900 MiRealSource-MiMLS
- 2006-12-20 Listed $79,900 MiRealSource-MiMLS
Property tax history
+4.7%/yrLatest (2025): $1,432 · +2.7% YoY. Source: county tax records.
Cash-flow waterfall
monthlySold comps — $/sqft
last 12 mo · ≤1 miLoading sold comps…