 Duplex
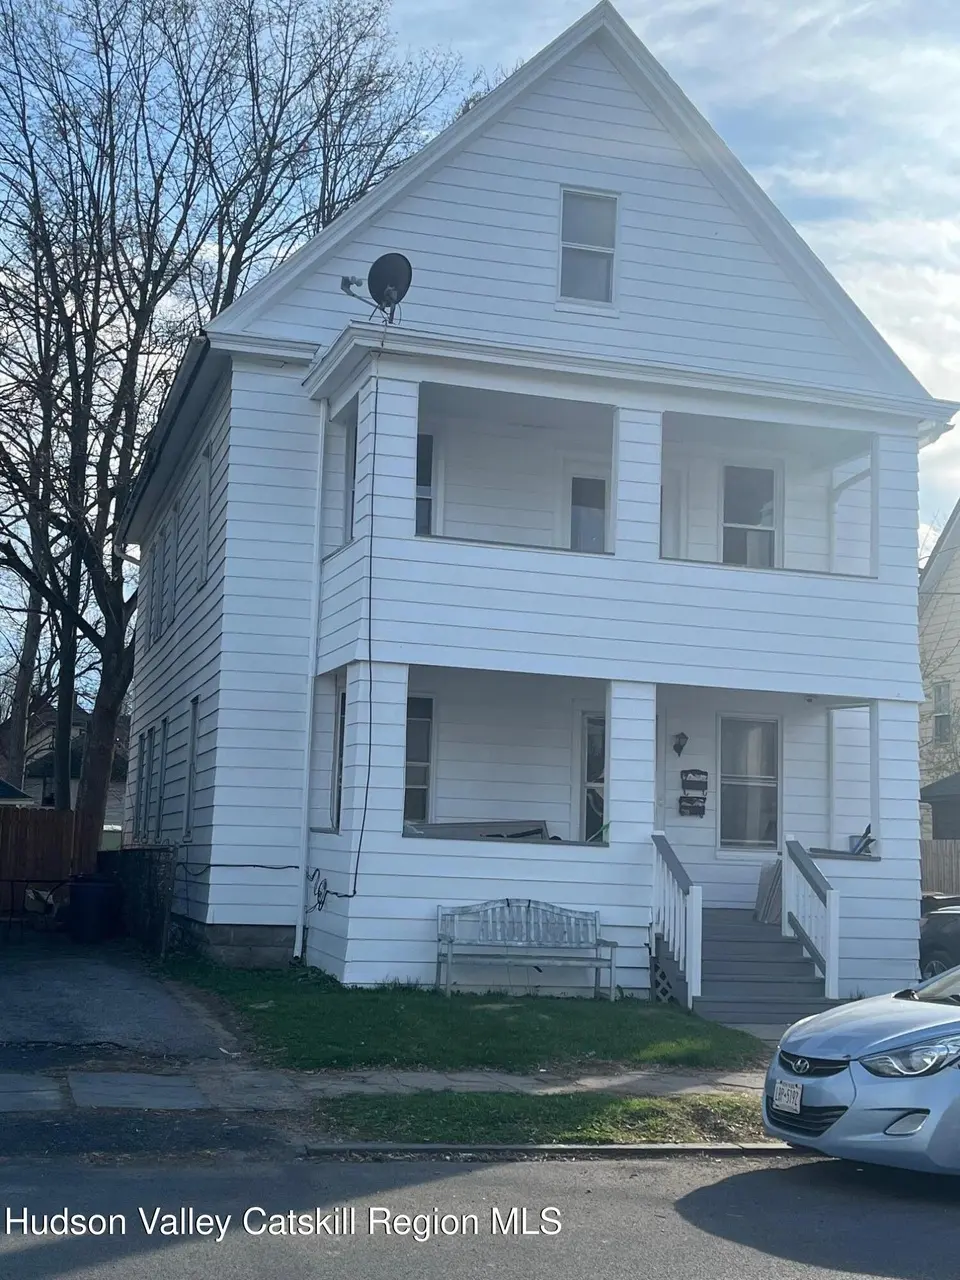
235 Smith Ave · Kingston, NY
Flood risk 1/10 · Minimal
- FEMA flood zone
- X (unshaded)
- Chance of flooding over 30 yrs
- 0.0%
- Est. flood insurance / yr
- $473 – $860
Fire risk 3/10 · Minor
- Est. fire insurance / yr
- $691 – $1,283
Heat risk 4/10 · Minor
- Hot days now (above 100°F)
- 7 days/yr
- Hot days in 30 yrs
- 16 days/yr
Wind risk 3/10 · Minor
- Chance of severe wind over 30 yrs
- 7.0%
Air-quality risk 2/10 · Minimal
- Unhealthy air days now
- 1 days/yr
- Unhealthy air days in 30 yrs
- 1 days/yr
Risk factors via First Street. Map © Google.
Why this score? — see what drove the D grade
The composite is a weighted blend of 9 inputs, each scored 0–100. Each bar is that input's sub-score; the figure is the points it added to the 100-point composite (weight × sub-score).
- Cash flow +17.5/30.0
- DSCR +5.5/10.0
- 1% rule +5.2/10.0
- Rent growth +4.5/5.0
- Schools +4.4/10.0
- Livability +4.1/5.0
- Condition / age +2.5/5.0
- ARV discount +0.0/15.0
- Appreciation +0.0/10.0
$449,000
🖨 Deal sheet 📄 Offer letter ✓ Due diligence
Multi-family units
County records classify this as Multi-Family (2-4 Unit). Listing-text estimate: 2 units. confirmed
Listing remarks MLS
Have your rental income supplement your monthly expenses. Great location in the heart of Kingston. Multi family with 2 separate large units. First floor apartment consists of 2 bedrooms and one full bath, Second floor, large 2 bedrooms with 2 extra bedrooms on third floor Legal 2 family with 6 bedrooms with a finished third floor with half bath according to city records. Possibly a third apartment with municipal approval Come take a look. Schedule an appointment today!
Key facts
- Finished third floor
- Legal 2 family
- 3,220 sq ft lot
Tags
Property features AI
Exterior
- Parking: Off-street parking; Other parking
- Utilities: Central Hudson electric; Public sewer; Cable connected; Electricity connected; Natural gas connected; Sewer connected; Water connected; Public trash collection
- Home design: Duplex; Total building area approximately 2,583 sq ft
- Construction: Aluminum siding construction
- Exterior features: Aluminum siding; Not waterfront
Interior
- Bedrooms: One 2-bedroom unit
- Bathrooms: Three full bathrooms
- Heating & cooling: Hot water heating; Oil heating; Wall/window air conditioning units
- Interior features: Finished attic; Full basement
Neighborhood map
What this means for you Summary
Snapshot
- This is a 2 × 3-bed/?-bath units multifamily listed at $449k.
Deal economics
- At list price, monthly cash flow is $341 ($4k/yr) — positive. Per door: $171/mo.
- The deal already cash-flows at list — no discount required.
- Meets the 1% rule at list price ($5k rent vs $449k).
- Recommended offer: $436k (3.0% below list) — sets the bar for market timing.
- Cap rate 7.2% vs local median 3.0% in Kingston — top-decile yield for the area; either an underpriced asset or a hidden risk that comps aren't pricing in. Stress-test before assuming the spread holds.
Location & tenants
- Location reads 82/100 on livability (#74 in NY, #1,143 nationally) — a professional / high-income tenant draw. Strengths: amenities A+, housing A+, health & safety A+; Watch: crime C-, schools D+.
- Kingston City School District (urban): math 44% / reading 59% proficiency, ranked #355 of 590 in NY (top 60%) — acceptable for families but not a draw, mixed tenant base, ~2y average lease.
- Market conditions: Rents rising fast (+7.8%/yr); 225 active listings in the ZIP; 464 units permitted in Ulster County in 2024 (170 in 5+ unit buildings).
- At $4,567/mo this rent would consume 79% of the median local household income ($69k/yr) (locally 2045% of renters already pay >50% of income on rent) — very limited rent-growth headroom before tenants either downsize or default.
Forward outlook
- Local home prices are declining (-3.0%/yr); year-one equity from $3k of loan paydown is wiped out by about $13k of value loss. Plan a longer hold.
- Ulster County population projected at -14% by 2050 — secular population decline; favor cash flow + early exit over multi-decade hold.
- At projected returns (-3.0% appreciation + 7.8% rent growth), your $126k cash investment doubles in ~10 years — after that, you're playing with house money.
Negotiation context
- It's been on market 54 days — a 3% lower offer ($436k) is reasonable based on typical stale-listing flexibility.
- 2 sale attempts with the ask held roughly flat each time — persistent listings suggest the price (not the market) is what's stuck; bring a comps-based counter.
- Current owner paid $31k; list at $449k implies a 1348% gain — meaningful room to come down on a strong offer.
Risks & watch-outs
- Watch-outs: built in 1915 — expect roof / HVAC / electrical / plumbing capex.
Questions for the listing agent
- It's been on market 54 days. Have you received any prior offers? Is the seller open to a 3% concession, seller financing, or rate buy-down credit?
- Can we see the unit-by-unit rent roll, current vacancy, and any below-market leases? What's the average tenancy length?
- What capital expenditures (roof, boiler, parking lot, exteriors) have been made in the last 5 years, and what's planned in the next 2?
- Built in 1915 — when were the roof, HVAC, electrical panel, plumbing, and water heater last replaced?
- Is there a deadline driving the sale (1031 exchange, divorce, estate, relocation)? That informs how much negotiation room exists.
- Schools are D-rated, which usually means shorter tenancies and higher turnover. Who's the typical renter profile here, and what's been the actual vacancy rate?
- The area grade is low — what's the realistic commute time and amenity access for the typical tenant pool here? Any planned neighborhood developments (good or bad) we should know about?
- What's the average days-on-market for RENTAL listings here right now (not sales)? A rising rental-DOM trend means longer vacancies and softer asking-rent achievability than the comps imply.
- What's the recent tenant-quality profile in this submarket — average credit score on applications, eviction rate, late-payment / NSF rate, and stable-employment percentage? A property-management company in the area should have these aggregated.
- How much new apartment / multifamily construction is in the pipeline within 1–3 miles? Heavy new supply (>2% of stock underway) typically softens rents 12–24 months out; light construction supports rent growth.
Investment metrics
- 1% rule
- 1.02% ✓
- Cap rate
- 7.21%
- Cash-on-cash
- 3.26%
- DSCR
- 1.15
- GRM
- 8.2
CMA / ARV
- ARV (on-the-fly)
- $382,284
- Comps found
- 4
Show comp detail 4 sales within ~0.75 mi
| Address | Dist | Beds/Ba | Sqft | Sold | Price | $/sf | Match |
|---|---|---|---|---|---|---|---|
| 36 Prince St | 0.58mi | 5/— (-1) | 2,450 (-5%) | 0mo | $374,000 | $153 | 59 |
| 12 Prince St | 0.61mi | 5/4.0 (-1) | 2,669 (+3%) | 1mo | $396,000 | $148 | 54 |
| 23 Van Buren St | 0.31mi | 6/2.0 | 2,375 (-8%) | 20mo | $289,000 | $122 | 54 |
| 442 Hasbrouck Ave | 0.59mi | 6/2.0 | 2,310 (-11%) | 18mo | $330,000 | $143 | 38 |
Match score weights: distance 35% · size 25% · config 20% · recency 20%. Top-matched comps best support the ARV.
Projected returns pro-forma
-3.0% appreciation · 7.81% rent growth · sell at horizon
- IRR
- -5.6%
- Equity multiple
- 0.78×
- Total profit
- $-27,665
- Equity at exit
- $66,947
- IRR
- 9.2%
- Equity multiple
- 1.87×
- Total profit
- $109,658
- Equity at exit
- $38,821
Cash invested: $125,720 (down + closing). Projections, not guarantees.
Landlord ↔ Tenant lean methodology
- Overall (STATE)
- 15 Strongly Tenant-Friendly
- State New York
- 15 Strongly Tenant-Friendly · D+10
- County
- — inherits STATE
- City
- — inherits STATE
ZIP-level market 12401
- Rents YoY
- 7.8%
- Active inventory
- 225
- Price-to-rent
- 16.4×
Monthly cashflow live
- Estimated rent
- $4,567 medium interval (Pro) →
- Mortgage (P&I)
- −$2,355
- Tax from tax record
- −$725 /mo · $8,697/yr
- Insurance
- −$187
- HOA
- −$0
- Vacancy / Maint / Mgmt
- −$959
- Net cashflow
- $341
Break-even live
2-unit breakdown (identical units grouped — click to expand)
| Units | Beds | Baths | Est. rent |
|---|---|---|---|
| 2× units | 3 | — | $4,568 |
| #1 | 3 | — | $2,284 |
| #2 | 3 | — | $2,284 |
| Total (2 units) | $4,567 | ||
UW: 25.0% down · 7.5% · 30yr · 1.5% tax · 5.0% vac · 8.0% maint · 8.0% mgmt
Financing live
Cash to close
- Down payment
- $112,250
- Closing costs
- $13,470
- Reserves months
- —
- Total cash needed
- —
Loan-product check · same deal, 3 products live
Conventional
25% down · 7.5% · 30yr
- Down + closing
- —
- Monthly P&I
- —
- Monthly cashflow
- —
- DSCR
- —
- Eligible?
- —
Personal DTI + credit; lowest rate.
DSCR
20% down · 8.5% · 30yr
- Down + closing
- —
- Monthly P&I
- —
- Monthly cashflow
- —
- DSCR
- —
- Eligible?
- —
No personal income docs; deal must DSCR.
Hard money
10% down · 12.0% · 12mo
- Down + closing
- —
- Monthly P&I
- —
- Monthly cashflow
- —
- DSCR
- —
- Eligible?
- —
Short-term bridge; refi at stabilization.
Listing history 18 events
-
2026-06-19days on market $449,000 Active 54 DOM
-
2026-06-18days on market $449,000 Active 53 DOM
-
2026-06-17days on market $449,000 Active 52 DOM
-
2026-06-16days on market $449,000 Active 51 DOM
-
2026-06-15days on market $449,000 Active 50 DOM
-
2026-06-14days on market $449,000 Active 48 DOM
-
2026-06-12days on market $449,000 Active 47 DOM
-
2026-06-09days on market $449,000 Active 44 DOM
-
2026-06-08days on market $449,000 Active 43 DOM
-
2026-06-07days on market $449,000 Active 42 DOM
-
2026-06-03days on market $449,000 Active 38 DOM
-
2026-06-02days on market $449,000 Active 37 DOM
-
2026-06-01days on market $449,000 Active 36 DOM
-
2026-05-31days on market $449,000 Active 35 DOM
-
2026-05-30days on market $449,000 Active 34 DOM
-
2026-04-27$449,000 Active 476-char remark
Show marketing remark (476 chars)
Have your rental income supplement your monthly expenses. Great location in the heart of Kingston. Multi family with 2 separate large units. First floor apartment consists of 2 bedrooms and one full bath, Second floor, large 2 bedrooms with 2 extra bedrooms on third floor Legal 2 family with 6 bedrooms with a finished third floor with half bath according to city records. Possibly a third apartment with municipal approval Come take a look. Schedule an appointment today!
-
2026-04-25$449,000 Active
-
1990-10-24soldstatus $31,000
ⓘ Source: listings_history table (triggers on properties + properties_extension) + one-shot
backfill from property_details.listing_events for pre-trigger history.
Tax reassessment forecast NY · Partial reset (capped growth)
- Current annual tax
- $8,697 · $725/mo
- Projected year-2 tax
- $8,697 · $725/mo
- Expected delta
- $0/yr ($0/mo · 0.0%)
ⓘ Screening estimate from a state-policy table — verify with the county assessor before closing.
Climate risk First Street
- Flood 1/10 Low FEMA zone X (unshaded) · 0% chance over 30 yrs
- Wildfire 3/10 Moderate
- Heat 4/10 Moderate 7 d/yr ≥100°F today · 16 d/yr by 30 yrs out
- Wind 3/10 Moderate 7% chance of damaging wind over 30 yrs
- Air quality 2/10 Low 1 unhealthy d/yr today · 1 by 30 yrs out
Nearby sold comps map
Loading sold comps map…
Walkable amenities ~0.75 mi
Loading nearby amenities…
Taxation est. · year 1
- Rental income
- $54,804
- − Mortgage interest
- −$25,151
- − Property taxes
- −$8,697
- − Insurance
- −$2,245
- − Repairs & maintenance
- −$4,384
- − Management
- −$4,384
- − Depreciation
- −$13,062
- Taxable loss
- −$3,120
- Est. tax savings @ 24.0%
- +$749
- After-tax cash flow
- $4,846/yr
For passive investors: Depreciation is non-cash, so a rental often shows a tax loss while cash-flowing — sheltering income. Rental losses are passive: they offset passive income freely, and up to $25,000/yr can offset ordinary (W-2) income if you actively participate and your MAGI is under $100k (phasing out to $0 by $150k); unused losses carry forward. On sale, claimed depreciation is recaptured at up to 25%, and gains may owe capital-gains tax (a 1031 exchange can defer both). Figures are a year-1 estimate at your 24.0% rate — not tax advice; consult a CPA.
Schools (NCES district)
- District
- Kingston City School District
- NCES district ID
- 3616290
- Math proficiency
- 44% ▲ 1.00%
- Reading proficiency
- 59% ▲ 20.00%
- Median HH income
- $52,586
- Composite
- 44.22/100
- National rank
- #2849
- State rank
- #355 of 590 in NY
Livability — Kingston
- Score
- 82/100
- State rank
- #74
- US rank
- #1143
Category grades
Schools grade is shown separately in the Schools card above.
Census & demographics
- Census place
- Kingston, NY
- County
- Ulster County · 56,183 people
- City population
- 35,136
- Metro
- Kingston, NY
- Population (ZIP)
- 35,136
- Household income
- $69,305
- Rent vs Own
- Severe rent burden
- 2045.0
Population outlook (Ulster County) Hauer SSP2
- Today (2025)
- 175,887 people
- By 2030
- 171,876 · -2.3%
- By 2040
- 161,771 · -8.0%
- By 2050
- 151,470 · -13.9%
- By 2075
- 133,023 · -24.4%
- By 2100
- 113,504 · -35.5%
Race, ethnicity, and origin ACS 2023
- Neighborhood character
- Predominantly White (68%)
- Race & ethnicity
- White 68% Hispanic / Latino 14% Black 11% Two or more races 10% Asian 2% Native American 1%
- Hispanic origin (detail)
- Mexican 5% Puerto Rican 4%
- Common ancestry
- Romanian 5% Iranian 3% Lithuanian 2%
- Foreign-born
- 11% · Canada, China
- Languages at home
- 85% English-only · Spanish 9% Other Indo-European 2% French/Haitian/Cajun 1%
Political lean MEDSL · Ulster
- 2024 margin
- D (+18.7) · D 59.3% · R 40.7%
- 2008→2024 swing
- -4.9pp toward R · 2008: 23.6pp · 2024: 18.7pp
- All cycles
- 2024: D+18.7 2020: D+20.9 2016: D+9.1 2012: D+21.9 2008: D+23.6
Not yet ingested
- Civics
- —
Market trends
- HPI YoY
- ▼ -262.90%
- Current HPI
- 369.1984
- Rent YoY
- ▲ 7.81%
- Metro
- Kingston, NY
- State GDP YoY
- ▲ 2.60%
- F500 in state
- 92
Industry mix (Fortune 500 HQ in NY)
| Industry | F500 HQs | Revenue |
|---|---|---|
| Financial Services | 10 | $950B |
|
||
| Consumer Goods | 9 | $162B |
|
||
| Insurance | 4 | $225B |
|
||
| Telecommunications | 2 | $144B |
|
||
| Pharmaceuticals | 2 | $112B |
|
||
| Media / Entertainment | 2 | $69B |
|
||
Price history
+1348.4% since first listed3 events — show timeline
- 2026-04-27 Listed $449,000 HVCRMLS
- 2026-04-25 Listed $449,000 OneKey® MLS as Distributed by MLS Grid
- 1990-10-24 Sold (Public Records) $31,000 Public Records
Property tax history
+6.1%/yrLatest (2025): $8,697 · +11.0% YoY. Source: county tax records.
Cash-flow waterfall
monthlySold comps — $/sqft
last 12 mo · ≤1 miLoading sold comps…