828 E Main St · Prescott, AR
Flood risk 1/10 · Minimal
- FEMA flood zone
- —
- Chance of flooding over 30 yrs
- 0.0%
- Est. flood insurance / yr
- —
Fire risk 5/10 · Moderate
- Est. fire insurance / yr
- $1,499 – $2,785
Heat risk 6/10 · Moderate
- Hot days now (above 111°F)
- 7 days/yr
- Hot days in 30 yrs
- 21 days/yr
Wind risk 4/10 · Minor
- Chance of severe wind over 30 yrs
- 23.0%
Air-quality risk 1/10 · Minimal
- Unhealthy air days now
- 0 days/yr
- Unhealthy air days in 30 yrs
- 0 days/yr
Risk factors via First Street. Map © Google.
Why this score? — see what drove the B- grade
The composite is a weighted blend of 9 inputs, each scored 0–100. Each bar is that input's sub-score; the figure is the points it added to the 100-point composite (weight × sub-score).
- Cash flow +30.0/30.0
- DSCR +10.0/10.0
- 1% rule +7.6/10.0
- ARV discount +4.5/15.0
- Appreciation +3.6/10.0
- Livability +3.3/5.0
- Rent growth +2.5/5.0
- Condition / age +2.5/5.0
- Schools +1.4/10.0
$98,500
🖨 Deal sheet 📄 Offer letter ✓ Due diligence
Listing remarks MLS
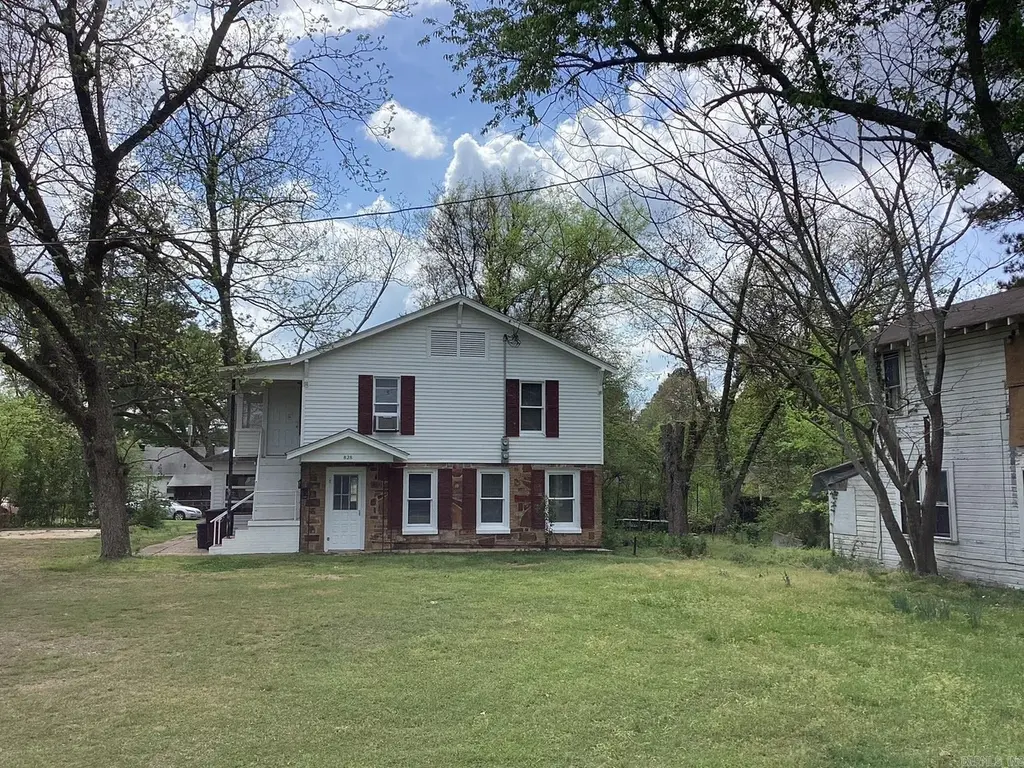
Two-story duplex in Prescott, Arkansas offering a great opportunity for investors or buyers looking for a renovation project. This fixer-upper features two separate living units and plenty of potential to customize or modernize. With repairs and updates, this property could serve as a long-term rental, multi-family investment, or resale opportunity. Plenty of parking around the building with a concrete slab for outdoor grilling. Within walking distance to Kofield cafe. 2 bedrooms and a bathroom upstairs, 2 bedroom and a bathroom downstairs. see agent remarks
Key facts
- Concrete slab
- Two story duplex
- Built 1946
Tags
Neighborhood map
What this means for you Summary
Snapshot
- This is a 4-bed/2.0-bath single-family listed at $98k.
Deal economics
- At list price, monthly cash flow is $382 ($5k/yr) — positive.
- The deal already cash-flows at list — no discount required.
- Meets the 1% rule at list price ($1k rent vs $98k).
- Recommended offer: $87k (12.0% below list) — sets the bar for market timing.
Location & tenants
- Location reads 66/100 on livability (#130 in AR) — a middle-class / working-renter tenant base. Strengths: cost of living A+, health & safety A+, housing A; Watch: schools F, amenities F, commute F.
- Prescott School District (town): math 16% / reading 19% proficiency, ranked #218 of 238 in AR (top 92%) — low school quality limits family demand, transient renter base, plan for 1-2y turnover; 69% free/reduced lunch — lower-income household profile, screen leases tightly.
- Market conditions: 20 active listings in the ZIP.
Forward outlook
- Local home prices are declining (-2.7%/yr); year-one equity from $681 of loan paydown is wiped out by about $3k of value loss. Plan a longer hold.
- Nevada County population projected at -24% by 2050 — secular population decline; favor cash flow + early exit over multi-decade hold.
- At projected returns (-2.7% appreciation + 3.0% rent growth), your $28k cash investment doubles in ~7 years — after that, you're playing with house money.
Negotiation context
- It's been on market 172 days — a 12% lower offer ($87k) is reasonable based on typical stale-listing flexibility.
Risks & watch-outs
- Watch-outs: built in 1946 — expect roof / HVAC / electrical / plumbing capex.
- Climate carrying-cost: moderate wildfire risk; extreme-heat days projected 7→21/yr by 2055 (HVAC capex compounding) — expect insurance premiums to compound above CPI over the hold.
Questions for the listing agent
- It's been on market 172 days. Have you received any prior offers? Is the seller open to a 12% concession, seller financing, or rate buy-down credit?
- Built in 1946 — when were the roof, HVAC, electrical panel, plumbing, and water heater last replaced?
- Why hasn't it sold? Are there any deal-killer items the seller is aware of (foundation, flood, title, zoning, code violations)?
- Is there a deadline driving the sale (1031 exchange, divorce, estate, relocation)? That informs how much negotiation room exists.
- Schools are F-rated, which usually means shorter tenancies and higher turnover. Who's the typical renter profile here, and what's been the actual vacancy rate?
- What's the average days-on-market for RENTAL listings here right now (not sales)? A rising rental-DOM trend means longer vacancies and softer asking-rent achievability than the comps imply.
- What's the recent tenant-quality profile in this submarket — average credit score on applications, eviction rate, late-payment / NSF rate, and stable-employment percentage? A property-management company in the area should have these aggregated.
- How much new for-sale + rental construction is in the pipeline within 1–3 miles? Heavy new supply typically softens prices + rents 12–24 months out; constrained supply supports both.
Investment metrics
- 1% rule
- 1.26% ✓
- Cap rate
- 10.95%
- Cash-on-cash
- 16.64%
- DSCR
- 1.74
- GRM
- 6.6
CMA / ARV
- ARV (median comp)
- $92,331
- List price
- $98,500
- Delta
- 6.68%
- Verdict
- FAIR
- Comps
- 13 within 1.0 mi
Show comp detail 6 sales within ~0.75 mi
| Address | Dist | Beds/Ba | Sqft | Sold | Price | $/sf | Match |
|---|---|---|---|---|---|---|---|
| 737 E Elm St | 0.07mi | 3/2.0 (-1) | 1,762 (+9%) | 9mo | $36,000 | $20 | 69 |
| 100 Elizabeth St | 0.53mi | 3/2.0 (-1) | 1,613 (+0%) | 11mo | $110,000 | $68 | 61 |
| 104 Friar Tuck Ln | 0.56mi | 3/2.0 (-1) | 1,584 (-2%) | 13mo | $155,000 | $98 | 55 |
| 226 E 6th St | 0.24mi | 3/2.0 (-1) | 1,448 (-10%) | 15mo | $105,000 | $73 | 54 |
| 519 E 4th St | 0.44mi | 3/1.0 (-1) | 1,440 (-11%) | 0mo | $40,000 | $28 | 53 |
| 503 Sherwood St | 0.45mi | 3/2.0 (-1) | 1,505 (-7%) | 18mo | $119,000 | $79 | 48 |
Match score weights: distance 35% · size 25% · config 20% · recency 20%. Top-matched comps best support the ARV.
Projected returns pro-forma
-2.71% appreciation · 3.0% rent growth · sell at horizon
- IRR
- 8.7%
- Equity multiple
- 1.35×
- Total profit
- $9,553
- Equity at exit
- $15,956
- IRR
- 17.4%
- Equity multiple
- 2.47×
- Total profit
- $40,572
- Equity at exit
- $10,712
Cash invested: $27,580 (down + closing). Projections, not guarantees.
Landlord ↔ Tenant lean methodology
- Overall (STATE)
- 92 Strongly Landlord-Friendly
- State Arkansas
- 92 Strongly Landlord-Friendly · R+14
- County
- — inherits STATE
- City
- — inherits STATE
ZIP-level market 71857
- Home prices YoY
- -1.5%
- Active inventory
- 20
- Price-to-rent
- 6.6×
Monthly cashflow live
- Estimated rent
- $1,241 medium interval (Pro) →
- Mortgage (P&I)
- −$517
- Tax from tax record
- −$40 /mo · $485/yr
- Insurance
- −$41
- HOA
- −$0
- Vacancy / Maint / Mgmt
- −$261
- Net cashflow
- $382
Break-even live
UW: 25.0% down · 7.5% · 30yr · 1.5% tax · 5.0% vac · 8.0% maint · 8.0% mgmt
Financing live
Cash to close
- Down payment
- $24,625
- Closing costs
- $2,955
- Reserves months
- —
- Total cash needed
- —
Loan-product check · same deal, 3 products live
Conventional
25% down · 7.5% · 30yr
- Down + closing
- —
- Monthly P&I
- —
- Monthly cashflow
- —
- DSCR
- —
- Eligible?
- —
Personal DTI + credit; lowest rate.
DSCR
20% down · 8.5% · 30yr
- Down + closing
- —
- Monthly P&I
- —
- Monthly cashflow
- —
- DSCR
- —
- Eligible?
- —
No personal income docs; deal must DSCR.
Hard money
10% down · 12.0% · 12mo
- Down + closing
- —
- Monthly P&I
- —
- Monthly cashflow
- —
- DSCR
- —
- Eligible?
- —
Short-term bridge; refi at stabilization.
Listing history 17 events
-
2026-06-19days on market $98,500 Active 172 DOM
-
2026-06-18days on market $98,500 Active 171 DOM
-
2026-06-17days on market $98,500 Active 170 DOM
-
2026-06-16days on market $98,500 Active 169 DOM
-
2026-06-15days on market $98,500 Active 168 DOM
-
2026-06-14days on market $98,500 Active 166 DOM
-
2026-06-12days on market $98,500 Active 165 DOM
-
2026-06-09days on market $98,500 Active 162 DOM
-
2026-06-08days on market $98,500 Active 161 DOM
-
2026-06-07days on market $98,500 Active 160 DOM
-
2026-06-07days on market $98,500 Active 159 DOM
-
2026-06-04days on market $98,500 Active 156 DOM
-
2026-06-02days on market $98,500 Active 155 DOM
-
2026-06-01days on market $98,500 Active 154 DOM
-
2026-05-31days on market $98,500 Active 153 DOM
-
2026-05-31days on market $98,500 Active 152 DOM
-
2025-12-29$98,500 New Listing 564-char remark
Show marketing remark (564 chars)
Two-story duplex in Prescott, Arkansas offering a great opportunity for investors or buyers looking for a renovation project. This fixer-upper features two separate living units and plenty of potential to customize or modernize. With repairs and updates, this property could serve as a long-term rental, multi-family investment, or resale opportunity. Plenty of parking around the building with a concrete slab for outdoor grilling. Within walking distance to Kofield cafe. 2 bedrooms and a bathroom upstairs, 2 bedroom and a bathroom downstairs. see agent remarks
ⓘ Source: listings_history table (triggers on properties + properties_extension) + one-shot
backfill from property_details.listing_events for pre-trigger history.
Tax reassessment forecast AR · Resets to sale price
- Current annual tax
- $485 · $40/mo
- Projected year-2 tax
- $630 · $53/mo
- Expected delta
- +$145/yr (+$12/mo · 29.9%)
ⓘ Screening estimate from a state-policy table — verify with the county assessor before closing.
Climate risk First Street
- Flood 1/10 Low 0% chance over 30 yrs
- Wildfire 5/10 Major
- Heat 6/10 Major 7 d/yr ≥111°F today · 21 d/yr by 30 yrs out
- Wind 4/10 Moderate 23% chance of damaging wind over 30 yrs
- Air quality 1/10 Low 0 unhealthy d/yr today · 0 by 30 yrs out
Nearby sold comps map
Loading sold comps map…
Walkable amenities ~0.75 mi
Loading nearby amenities…
Taxation est. · year 1
- Rental income
- $14,892
- − Mortgage interest
- −$5,518
- − Property taxes
- −$485
- − Insurance
- −$492
- − Repairs & maintenance
- −$1,191
- − Management
- −$1,191
- − Depreciation
- −$2,865
- Taxable income
- $3,149
- Est. tax owed @ 24.0%
- −$756
- After-tax cash flow
- $3,833/yr
For passive investors: Depreciation is non-cash, so a rental often shows a tax loss while cash-flowing — sheltering income. Rental losses are passive: they offset passive income freely, and up to $25,000/yr can offset ordinary (W-2) income if you actively participate and your MAGI is under $100k (phasing out to $0 by $150k); unused losses carry forward. On sale, claimed depreciation is recaptured at up to 25%, and gains may owe capital-gains tax (a 1031 exchange can defer both). Figures are a year-1 estimate at your 24.0% rate — not tax advice; consult a CPA.
Schools (NCES district)
- District
- Prescott School District
- NCES district ID
- 0511820
- Math proficiency
- 16% ▼ -15.00%
- Reading proficiency
- 19% ▼ -11.00%
- Median HH income
- $34,757
- Composite
- 14.38/100
- National rank
- #9435
- State rank
- #218 of 238 in AR
Livability — Prescott
- Score
- 66/100
- State rank
- #130
- US rank
- #12044
Category grades
Schools grade is shown separately in the Schools card above.
Census & demographics
- Census place
- Prescott, AR
- Population (ZIP)
- 5,569
Population outlook (Nevada County) Hauer SSP2
- Today (2025)
- 7,890 people
- By 2030
- 7,473 · -5.3%
- By 2040
- 6,681 · -15.3%
- By 2050
- 6,034 · -23.5%
- By 2075
- 5,068 · -35.8%
- By 2100
- 4,689 · -40.6%
Race, ethnicity, and origin ACS 2023
- Neighborhood character
- Majority White (61%)
- Race & ethnicity
- White 61% Black 27% Hispanic / Latino 10% Two or more races 2%
- Hispanic origin (detail)
- Mexican 7%
- Common ancestry
- Hungarian 1% Serbian 1% Lithuanian 1%
- Foreign-born
- 0%
- Languages at home
- 93% English-only · Spanish 7%
Political lean MEDSL · Nevada
- 2024 margin
- Solid R (+39.7) · D 29.2% · R 68.9% · Other 1.9%
- 2008→2024 swing
- -23.5pp toward R · 2008: -16.2pp · 2024: -39.7pp
- All cycles
- 2024: R+39.7 2020: R+31.5 2016: R+26.1 2012: R+20.1 2008: R+16.2
Not yet ingested
- Civics
- —
Market trends
- HPI YoY
- ▼ -2.71%
- Current HPI
- 175.9236
- Rent YoY
- —
- Metro
- —
- State GDP YoY
- ▲ 3.80%
- F500 in state
- 10
Industry mix (Fortune 500 HQ in AR)
| Industry | F500 HQs | Revenue |
|---|---|---|
| Retail | 1 | $681B |
|
||
| Food / Agriculture | 1 | $53B |
|
||
| Retail / Energy | 1 | $22B |
|
||
| Transportation / Logistics | 1 | $12B |
|
||
| Energy | 1 | $4B |
|
||
Price history
1 event — show timeline
- 2025-12-29 Listed $98,500 CARMLS
Property tax history
+2.7%/yrLatest (2025): $485 · +9.1% YoY. Source: county tax records.
Cash-flow waterfall
monthlySold comps — $/sqft
last 12 mo · ≤1 miLoading sold comps…