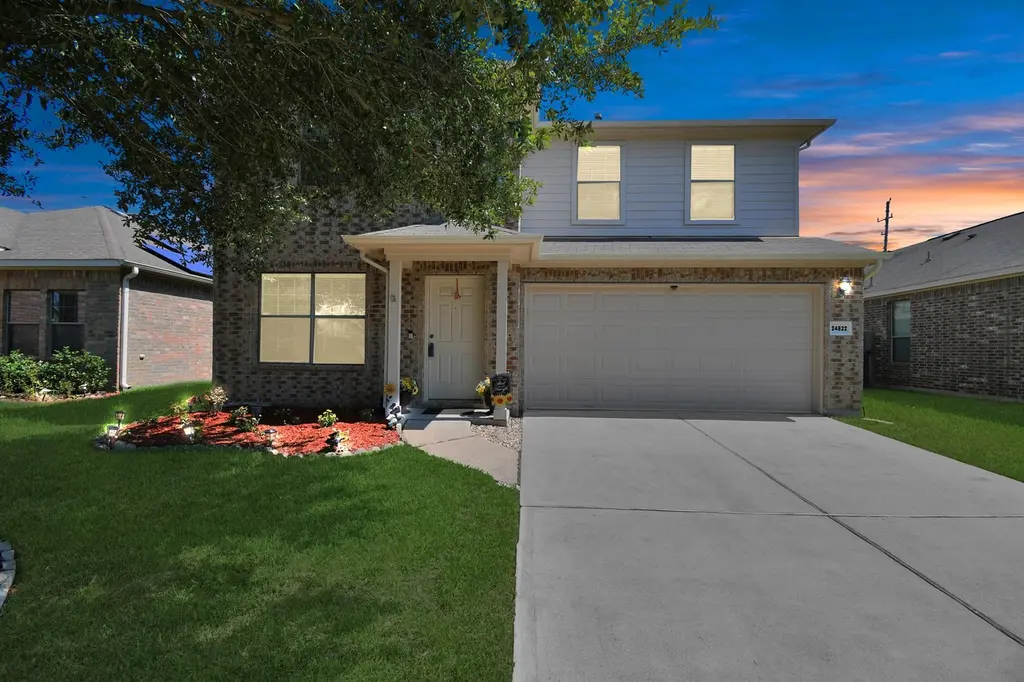
24822 Colonial Maple Dr · Katy, TX
Flood risk 5/10 · Moderate
- FEMA flood zone
- X (unshaded)
- Chance of flooding over 30 yrs
- 0.66%
- Est. flood insurance / yr
- $507 – $1,088
Fire risk 3/10 · Minor
- Est. fire insurance / yr
- $1,222 – $2,270
Heat risk 9/10 · Severe
- Hot days now (above 111°F)
- 7 days/yr
- Hot days in 30 yrs
- 24 days/yr
Wind risk 8/10 · Major
- Chance of severe wind over 30 yrs
- 99.0%
Air-quality risk 2/10 · Minimal
- Unhealthy air days now
- 1 days/yr
- Unhealthy air days in 30 yrs
- 2 days/yr
Risk factors via First Street. Map © Google.
Why this score? — see what drove the D grade
The composite is a weighted blend of 9 inputs, each scored 0–100. Each bar is that input's sub-score; the figure is the points it added to the 100-point composite (weight × sub-score).
- ARV discount +10.6/15.0
- Cash flow +8.6/30.0
- Schools +5.7/10.0
- 1% rule +4.3/10.0
- Livability +3.8/5.0
- Condition / age +2.5/5.0
- DSCR +2.4/10.0
- Rent growth +2.3/5.0
- Appreciation +0.0/10.0
$310,000
🖨 Deal sheet (PDF) 📄 Offer letter ✓ Due diligence
Listing remarks MLS
Say Hello Home Sweet Home in Katy,TX! Spectacular 4/5 BDRM home in the established Stonecrest Crest community. Spacious areas throughout with updated bathroom showers, flooring, cabinets countertops, and fresh paint ready for new owners to enjoy. NO BACK NEIGHBORS. Conveniently located minutes from I-10, with easy access to GPWY99. Short drive to Energy Corridor, premier shopping, dining, and entertainment. Katy Mills Mall, Typhoon Texas Waterpark, and Katy Asian Town are less than 10 miles away! Zoned to award winning Katy Independent School District. Contact us today for a showing.
Key facts
- Updated cabinets
- Fresh paint
- Updated flooring
Tags
Neighborhood map
What this means for you Summary
Snapshot
- This is a 3-bed/2.5-bath single-family listed at $310k.
Deal economics
- At list price, monthly cash flow is $-268 ($-3k/yr) — negative.
- To cash-flow at today's rent, offer at most $263k (15.3% below list).
- To meet the 1% rule (rent ≥ 1% of price), the offer needs to be $288k (7.2% below list).
- Recommended offer: $263k (15.3% below list) — sets the bar for cash-flow.
- Cap rate 5.3% vs local median 3.0% in Katy — top-decile yield for the area; either an underpriced asset or a hidden risk that comps aren't pricing in. Stress-test before assuming the spread holds.
Location & tenants
- Location reads 76/100 on livability (#111 in TX, #3,613 nationally) — a middle-class / working-renter tenant base. Strengths: employment A+, cost of living A+, housing A+; Watch: crime C-, amenities D, commute F.
- Katy ISD (suburban): math 61% / reading 63% proficiency, ranked #29 of 826 in TX (top 4%) — acceptable for families but not a draw, mixed tenant base, ~2y average lease.
- Zoned schools: Robert King El (math 41% / reading 44%, grade F, #1,313 of 4,322 statewide, top 31%, 981 students, 68% FRL); Katy J H (math 52% / reading 51%, grade C, #318 of 1,662 statewide, top 20%, 1,094 students, 53% FRL); Katy H S (math 62% / reading 74%, grade B, #150 of 1,632 statewide, top 10%, 3,330 students, 38% FRL) — zoned schools average 53% FRL vs 27% district-wide (25 pts higher); higher-poverty schools than district average — tighter screening recommended.
- Market conditions: Rents soft (-0.8%/yr); 2729 active listings in the ZIP; 6 comparable units currently listed for rent nearby; rentals at typical pace (median 15d on market — plan ~3-4 weeks tenant-placement turnaround); high-income renter base; 29,883 units permitted in Harris County in 2024 (8,621 in 5+ unit buildings).
Forward outlook
- Local home prices are declining (-3.0%/yr); year-one equity from $2k of loan paydown is wiped out by about $9k of value loss. Plan a longer hold.
- Harris County population projected at +47% by 2050 — long-run rental-demand tailwind backs the buy-and-hold thesis.
Negotiation context
- It's been on market 88 days — a 6% lower offer ($291k) is reasonable based on typical stale-listing flexibility.
- 3 sale attempts since 7y ago; this cycle's ask has dropped $29k (9%) from the opening price — seller is motivated, your offer sets the floor, not the list.
Risks & watch-outs
- Watch-outs: property tax is 2.9% of price.
- Climate carrying-cost: moderate flood risk; severe wind risk, 99% chance of damaging wind over 30y; extreme-heat days projected 7→24/yr by 2055 (HVAC capex compounding) — expect insurance premiums to compound above CPI over the hold.
Questions for the listing agent
- What do current leases actually rent for vs. the listed asking? Can we see a recent rent roll and the last 12 months of T-12 income?
- It's been on market 88 days. Have you received any prior offers? Is the seller open to a 15% concession, seller financing, or rate buy-down credit?
- Property tax is high relative to price — has the assessment been appealed recently, and will the sale trigger a re-assessment?
- What does the HOA fee cover, when was the last increase, and are there any pending special assessments or reserve-fund shortfalls?
- Why hasn't it sold? Are there any deal-killer items the seller is aware of (foundation, flood, title, zoning, code violations)?
- Is there a deadline driving the sale (1031 exchange, divorce, estate, relocation)? That informs how much negotiation room exists.
- Schools are B-rated — typically a magnet for longer-tenancy family renters. What's the average tenant stay here, and is there a school-zone premium baked into asking?
- The area grade is low — what's the realistic commute time and amenity access for the typical tenant pool here? Any planned neighborhood developments (good or bad) we should know about?
- What's the average days-on-market for RENTAL listings here right now (not sales)? A rising rental-DOM trend means longer vacancies and softer asking-rent achievability than the comps imply.
- What's the recent tenant-quality profile in this submarket — average credit score on applications, eviction rate, late-payment / NSF rate, and stable-employment percentage? A property-management company in the area should have these aggregated.
- How much new for-sale + rental construction is in the pipeline within 1–3 miles? Heavy new supply typically softens prices + rents 12–24 months out; constrained supply supports both.
Investment metrics
- 1% rule
- 0.93% ✗
- Cap rate
- 5.26%
- Cash-on-cash
- -3.70%
- DSCR
- 0.84
- GRM
- 9.0
CMA / ARV
- ARV (median comp)
- $332,608
- List price
- $310,000
- Delta
- -6.80%
- Verdict
- FAIR
- Comps
- 20 within 1.0 mi
Show comp detail 12 sales within ~0.75 mi
| Address | Dist | Beds/Ba | Sqft | Sold | Price | $/sf | Match |
|---|---|---|---|---|---|---|---|
| 24802 Colonial Maple Dr | 0.05mi | 4/2.5 (+1) | 2,637 (+1%) | 3mo | $334,999 | $127 | 88 |
| 24735 Colonial Maple Dr | 0.06mi | 4/3.5 (+1) | 2,802 (+7%) | 7mo | $333,000 | $119 | 70 |
| 5084 Morrison Blvd | 0.35mi | 3/2.5 | 2,406 (-8%) | 1mo | $365,000 | $152 | 70 |
| 24610 Mason Knights Ct | 0.19mi | 4/3.5 (+1) | 2,772 (+6%) | 7mo | $345,000 | $124 | 66 |
| 25007 Lenora Dr | 0.37mi | 4/2.5 (+1) | 2,443 (-6%) | 6mo | $324,990 | $133 | 62 |
| 24930 Lakecrest Manor Dr | 0.35mi | 4/2.5 (+1) | 2,443 (-6%) | 8mo | $305,000 | $125 | 62 |
| 1247 S Maple Dr | 0.23mi | 4/3.5 (+1) | 2,932 (+12%) | 1mo | $375,000 | $128 | 59 |
| 24306 Lanning Dr | 0.68mi | 4/2.5 (+1) | 2,629 (+1%) | 4mo | $338,000 | $129 | 59 |
| 25043 Lenora Dr | 0.39mi | 4/2.5 (+1) | 2,873 (+10%) | 5mo | $334,990 | $117 | 56 |
| 24514 Lake Path Cir | 0.47mi | 4/2.5 (+1) | 2,921 (+12%) | 3mo | $364,900 | $125 | 51 |
| 24311 Lanning Dr | 0.66mi | 4/3.5 (+1) | 2,820 (+8%) | 1mo | $405,000 | $144 | 46 |
| 24443 Pepperrell Place St | 0.49mi | 4/2.5 (+1) | 2,248 (-14%) | 5mo | $385,000 | $171 | 45 |
Match score weights: distance 35% · size 25% · config 20% · recency 20%. Top-matched comps best support the ARV.
Projected returns pro-forma
-3.0% appreciation · 0.0% rent growth · sell at horizon
- IRR
- -26.5%
- Equity multiple
- 0.13×
- Total profit
- $-75,418
- Equity at exit
- $46,222
- IRR
- -43.1%
- Equity multiple
- -0.37×
- Total profit
- $-119,021
- Equity at exit
- $26,803
Cash invested: $86,800 (down + closing). Projections, not guarantees.
Landlord ↔ Tenant lean methodology
- Overall (STATE)
- 87 Strongly Landlord-Friendly
- State Texas
- 87 Strongly Landlord-Friendly · R+5
- County
- — inherits STATE
- City
- — inherits STATE
ZIP-level market 77493
- Rents YoY
- -0.8%
- Active inventory
- 2729
- Price-to-rent
- 9.0×
Monthly cashflow live
- Estimated rent
- $2,875 high interval (Pro) →
- Mortgage (P&I)
- −$1,626
- Tax from tax record
- −$751 /mo · $9,017/yr
- Insurance
- −$129
- HOA
- −$33
- Vacancy / Maint / Mgmt
- −$604
- Net cashflow
- $-268
Break-even live
Sensitivity live
| Price | -10% $-92 | -5% $-180 | +0% $-268 | +5% $-355 | +10% $-443 |
|---|---|---|---|---|---|
| Rent | -10% $-495 | -5% $-381 | +0% $-268 | +5% $-154 | +10% $-40 |
| Rate | -1.0pp $-112 | -0.5pp $-189 | base $-268 | +0.5pp $-348 | +1.0pp $-430 |
UW: 25.0% down · 7.5% · 30yr · 1.5% tax · 5.0% vac · 8.0% maint · 8.0% mgmt
Financing live
Cash to close
- Down payment
- $77,500
- Closing costs
- $9,300
- Reserves months
- —
- Total cash needed
- —
Loan-product check · same deal, 3 products live
Conventional
25% down · 7.5% · 30yr
- Down + closing
- —
- Monthly P&I
- —
- Monthly cashflow
- —
- DSCR
- —
- Eligible?
- —
Personal DTI + credit; lowest rate.
DSCR
20% down · 8.5% · 30yr
- Down + closing
- —
- Monthly P&I
- —
- Monthly cashflow
- —
- DSCR
- —
- Eligible?
- —
No personal income docs; deal must DSCR.
Hard money
10% down · 12.0% · 12mo
- Down + closing
- —
- Monthly P&I
- —
- Monthly cashflow
- —
- DSCR
- —
- Eligible?
- —
Short-term bridge; refi at stabilization.
Rent comps 6 comps
| Address | Beds | Baths | Sqft | Rent | $/sqft | DOM | Units | Dist |
|---|---|---|---|---|---|---|---|---|
| 1739 Palmetto Park Dr Katy, TX | 4.0 | 3.5 | 2998 | $3,100 | $1.03 | 45d | 1 | 0.33mi |
| 1508 Colonial Gorge Dr Katy, TX | 4.0 | 2.5 | 1904 | $2,650 | $1.39 | 18d | 1 | 0.35mi |
| 2222 Princess Snow Cir Katy, TX | 4.0 | 2.5 | 2958 | $2,425 | $0.82 | 14d | 1 | 1.33mi |
| 302 Cobia Dr Katy, TX | 1.0–3.0 | 1.0–2.5 | 1217 | $2,469 | $2.03 | 0d | 22 | 1.35mi |
| 1724 Partnership Way Katy, TX | 3.0 | 1.0–3.5 | 1536 | $3,340 | $2.17 | 0d | 86 | 1.43mi |
| 23414 W Fernhurst Dr Katy, TX | 1.0–3.0 | 1.0–3.0 | 1352 | $3,099 | $2.29 | 0d | 30 | 1.45mi |
HOA detail
- Monthly dues
- $33 · $396/yr
- Likely covers
- water
Listing history 32 events
-
2026-06-21days on market $310,000 Active 88 DOM
-
2026-06-18days on market $310,000 Active 85 DOM
-
2026-06-17pricedays on market $310,000 Active 84 DOM
-
2026-06-16days on market $325,000 Active 83 DOM
-
2026-06-16price $325,000 Active 82 DOM
-
2026-06-15days on market $335,000 Active 82 DOM
-
2026-06-13days on market $335,000 Active 80 DOM
-
2026-06-09days on market $335,000 Active 76 DOM
-
2026-06-08days on market $335,000 Active 75 DOM
-
2026-06-07days on market $335,000 Active 74 DOM
-
2026-06-04days on market $335,000 Active 71 DOM
-
2026-06-03days on market $335,000 Active 70 DOM
-
2026-06-02days on market $335,000 Active 69 DOM
-
2026-06-01days on market $335,000 Active 68 DOM
-
2026-05-31days on market $335,000 Active 67 DOM
-
2026-04-18price $335,000 590-char remark
Show marketing remark (590 chars)
Say Hello Home Sweet Home in Katy,TX! Spectacular 4/5 BDRM home in the established Stonecrest Crest community. Spacious areas throughout with updated bathroom showers, flooring, cabinets countertops, and fresh paint ready for new owners to enjoy. NO BACK NEIGHBORS. Conveniently located minutes from I-10, with easy access to GPWY99. Short drive to Energy Corridor, premier shopping, dining, and entertainment. Katy Mills Mall, Typhoon Texas Waterpark, and Katy Asian Town are less than 10 miles away! Zoned to award winning Katy Independent School District. Contact us today for a showing.
-
2026-03-25$339,000 Active 590-char remark
Show marketing remark (590 chars)
Say Hello Home Sweet Home in Katy,TX! Spectacular 4/5 BDRM home in the established Stonecrest Crest community. Spacious areas throughout with updated bathroom showers, flooring, cabinets countertops, and fresh paint ready for new owners to enjoy. NO BACK NEIGHBORS. Conveniently located minutes from I-10, with easy access to GPWY99. Short drive to Energy Corridor, premier shopping, dining, and entertainment. Katy Mills Mall, Typhoon Texas Waterpark, and Katy Asian Town are less than 10 miles away! Zoned to award winning Katy Independent School District. Contact us today for a showing.
-
2026-03-18historical
-
2026-03-15price $349,990
-
2026-02-07price $350,000
-
2025-11-25price $354,000
-
2025-10-12price $354,900
-
2025-09-13price $360,000
-
2025-09-06price $369,900
-
2025-08-29price $369,990
-
2025-08-21$370,000 Active
-
2019-06-10soldstatus
-
2019-06-06soldstatus Sold
-
2019-05-04status Pending
-
2019-04-22status Option Pending
-
2019-04-11price $219,900
-
2019-03-25$224,500 Active
ⓘ Source: listings_history table (triggers on properties + properties_extension) + one-shot
backfill from property_details.listing_events for pre-trigger history.
Tax reassessment forecast TX · Resets to sale price
- Current annual tax
- $9,017 · $751/mo
- Projected year-2 tax
- $9,017 · $751/mo
- Expected delta
- $0/yr ($0/mo · 0.0%)
ⓘ Screening estimate from a state-policy table — verify with the county assessor before closing.
Climate risk First Street
- Flood 5/10 Major FEMA zone X (unshaded) · 66% chance over 30 yrs
- Wildfire 3/10 Moderate
- Heat 9/10 Extreme 7 d/yr ≥111°F today · 24 d/yr by 30 yrs out
- Wind 8/10 Severe 99% chance of damaging wind over 30 yrs
- Air quality 2/10 Low 1 unhealthy d/yr today · 2 by 30 yrs out
Nearby sold comps map
Loading sold comps map…
Walkable amenities ~0.75 mi
Loading nearby amenities…
Taxation est. · year 1
- Rental income
- $34,506
- − Mortgage interest
- −$17,365
- − Property taxes
- −$9,017
- − Insurance
- −$1,550
- − Repairs & maintenance
- −$2,760
- − Management
- −$2,760
- − HOA
- −$396
- − Depreciation
- −$9,018
- Taxable loss
- −$8,361
- Est. tax savings @ 24.0%
- +$2,007
- After-tax cash flow
- $-1,205/yr
For passive investors: Depreciation is non-cash, so a rental often shows a tax loss while cash-flowing — sheltering income. Rental losses are passive: they offset passive income freely, and up to $25,000/yr can offset ordinary (W-2) income if you actively participate and your MAGI is under $100k (phasing out to $0 by $150k); unused losses carry forward. On sale, claimed depreciation is recaptured at up to 25%, and gains may owe capital-gains tax (a 1031 exchange can defer both). Figures are a year-1 estimate at your 24.0% rate — not tax advice; consult a CPA.
Schools (NCES district)
- District
- Katy ISD
- NCES district ID
- 4825170
- Math proficiency
- 61% ▼ -7.00%
- Reading proficiency
- 63% ▼ -3.00%
- Median HH income
- $90,312
- Composite
- 56.59/100
- National rank
- #1146
- State rank
- #29 of 826 in TX
Livability — Katy
- Score
- 76/100
- State rank
- #111
- US rank
- #3613
Category grades
Schools grade is shown separately in the Schools card above.
Census & demographics
- County
- Harris County · 4,702,590 people
- City population
- 3,226,434
- Metro
- Houston-The Woodlands-Sugar Land, TX
- Population (ZIP)
- 71,484
- Household income
- $118,464
- Rent vs Own
- Severe rent burden
- 913.0
Population outlook (Harris County) Hauer SSP2
- Today (2025)
- 5,571,493 people
- By 2030
- 6,089,821 · +9.3%
- By 2040
- 7,142,806 · +28.2%
- By 2050
- 8,185,864 · +46.9%
- By 2075
- 10,574,329 · +89.8%
- By 2100
- 12,109,958 · +117.4%
Race, ethnicity, and origin ACS 2023
- Neighborhood character
- Highly diverse neighborhood (Simpson 0.73)
- Race & ethnicity
- White 36% Hispanic / Latino 33% Two or more races 16% Black 15% Asian 12%
- Hispanic origin (detail)
- Mexican 20%
- Common ancestry
- Lithuanian 2% Slovak 1% Italian 1%
- Foreign-born
- 21% · Canada, Vietnam, Jamaica
- Languages at home
- 64% English-only · Spanish 22% Vietnamese 5% French/Haitian/Cajun 4%
Political lean MEDSL · Harris
- 2024 margin
- Lean D (+5.5) · D 52.0% · R 46.4% · Other 1.6%
- 2008→2024 swing
- +3.9pp toward D · 2008: 1.6pp · 2024: 5.5pp
- All cycles
- 2024: D+5.5 2020: D+13.3 2016: D+12.4 2012: D+0.1 2008: D+1.6
Not yet ingested
- Civics
- —
Market trends
- HPI YoY
- ▼ -140.65%
- Current HPI
- 233.1683
- Rent YoY
- ▼ -0.80%
- Metro
- Houston-The Woodlands-Sugar Land, TX
- State GDP YoY
- ▲ 3.95%
- F500 in state
- 110
Industry mix (Fortune 500 HQ in TX)
| Industry | F500 HQs | Revenue |
|---|---|---|
| Energy | 16 | $1,198B |
|
||
| Technology | 5 | $198B |
|
||
| Engineering / Construction | 4 | $72B |
|
||
| Energy Services | 3 | $60B |
|
||
| Utilities | 3 | $41B |
|
||
| Healthcare | 2 | $330B |
|
||
Price history
+49.2% since first listed17 events — show timeline
- 2026-04-18 Price Changed $335,000 HARMLS
- 2026-03-25 Listed $339,000 HARMLS
- 2026-03-18 Listing Removed — HARMLS
- 2026-03-15 Price Changed $349,990 HARMLS
- 2026-02-07 Price Changed $350,000 HARMLS
- 2025-11-25 Price Changed $354,000 HARMLS
- 2025-10-12 Price Changed $354,900 HARMLS
- 2025-09-13 Price Changed $360,000 HARMLS
- 2025-09-06 Price Changed $369,900 HARMLS
- 2025-08-29 Price Changed $369,990 HARMLS
- 2025-08-21 Listed $370,000 HARMLS
- 2019-06-10 Sold (Public Records) — Public Records
- 2019-06-06 Sold (MLS) — HARMLS
- 2019-05-04 Pending — HARMLS
- 2019-04-22 Pending — HARMLS
- 2019-04-11 Price Changed $219,900 HARMLS
- 2019-03-25 Listed $224,500 HARMLS
Property tax history
+23.6%/yrLatest (2025): $9,017 · +4.7% YoY. Source: county tax records.
Cash-flow waterfall
monthlySold comps — $/sqft
last 12 mo · ≤1 miLoading sold comps…