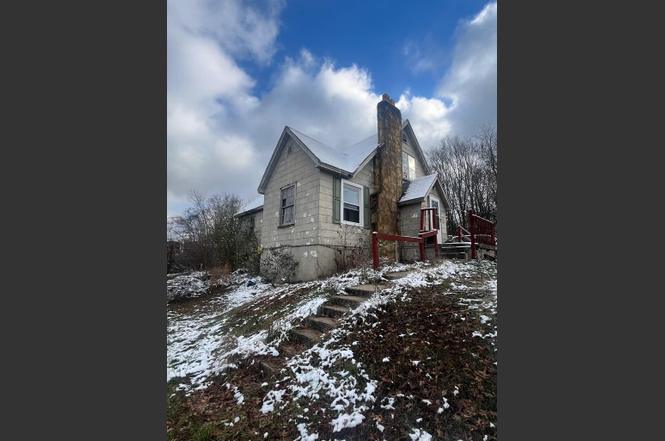
415 Mineral St · Dawson Springs, KY
Flood risk 1/10 · Minimal
- FEMA flood zone
- X (unshaded)
- Chance of flooding over 30 yrs
- 0.0%
- Est. flood insurance / yr
- $473 – $860
Fire risk 4/10 · Minor
- Est. fire insurance / yr
- $839 – $1,559
Heat risk 5/10 · Moderate
- Hot days now (above 108°F)
- 7 days/yr
- Hot days in 30 yrs
- 21 days/yr
Wind risk 3/10 · Minor
- Chance of severe wind over 30 yrs
- 7.0%
Air-quality risk 2/10 · Minimal
- Unhealthy air days now
- 0 days/yr
- Unhealthy air days in 30 yrs
- 1 days/yr
Risk factors via First Street. Map © Google.
Why this score? — see what drove the B- grade
The composite is a weighted blend of 9 inputs, each scored 0–100. Each bar is that input's sub-score; the figure is the points it added to the 100-point composite (weight × sub-score).
- Cash flow +30.0/30.0
- 1% rule +10.0/10.0
- DSCR +10.0/10.0
- ARV discount +7.5/15.0
- Livability +3.4/5.0
- Rent growth +2.5/5.0
- Condition / age +2.5/5.0
- Schools +2.0/10.0
- Appreciation +1.6/10.0
$39,900
🖨 Deal sheet 📄 Offer letter ✓ Due diligence
Listing remarks
This spacious 4br 1ba home sits on a corner lot in a convenient location near the school and is ready for a new owner to bring it back to life. With 2 bedrooms on main floor, 2 upstairs, and an unfinished basement there's plenty of room to re-imagine the space. Laundry was moved from basement to the kitchen and can be returned to basement if needed. The property is being sold AS-IS and will require extensive TLC, A great opportunity for buyers looking to add value and create something special. Includes a very large lot with its own private drive on the left of the home. Cash or conventional financing only.
Key facts
- Unfinished basement
- Corner lot
- Private drive
Tags
Property features AI
Exterior
- Parking: Gravel parking
- Utilities: Public water; Public sewer
- Home design: Single family residence; Residential property; 2 stories
- Construction: Masonite exterior; Metal roof
- Exterior features: Patio
Interior
- Bedrooms: 2 main level bedrooms
- Bathrooms: 1 full bathroom (main level)
- Heating & cooling: Electric heating; Central air conditioning
- Interior features: Electric water heater; Unfinished basement
- Laundry & utility: Laundry on main level
Neighborhood map
What this means for you Summary
Snapshot
- This is a 4-bed/1.0-bath single-family listed at $40k.
Deal economics
- At list price, monthly cash flow is $822 ($10k/yr) — positive.
- The deal already cash-flows at list — no discount required.
- Meets the 1% rule at list price ($1k rent vs $40k).
- Recommended offer: $35k (12.0% below list) — sets the bar for market timing.
Location & tenants
- Location reads 67/100 on livability (#207 in KY) — a middle-class / working-renter tenant base. Strengths: crime A+, cost of living A+, housing A+; Watch: schools D, amenities F, commute F.
- Dawson Springs Independent (rural): math 22% / reading 29% proficiency, ranked #148 of 165 in KY (top 90%) — low school quality limits family demand, transient renter base, plan for 1-2y turnover.
- Market conditions: 30 active listings in the ZIP; 122 units permitted in Hopkins County in 2024 (0 in 5+ unit buildings).
Forward outlook
- Local home prices are declining (-3.0%/yr); year-one equity from $276 of loan paydown is wiped out by about $1k of value loss. Plan a longer hold.
- Hopkins County population projected at -13% by 2050 — secular population decline; favor cash flow + early exit over multi-decade hold.
- At projected returns (-3.0% appreciation + 3.0% rent growth), your $11k cash investment doubles in ~2 years — after that, you're playing with house money.
Negotiation context
- It's been on market 164 days — a 12% lower offer ($35k) is reasonable based on typical stale-listing flexibility.
Risks & watch-outs
- Watch-outs: built in 1945 — expect roof / HVAC / electrical / plumbing capex.
- Climate carrying-cost: extreme-heat days projected 7→21/yr by 2055 (HVAC capex compounding) — expect insurance premiums to compound above CPI over the hold.
Questions for the listing agent
- It's been on market 164 days. Have you received any prior offers? Is the seller open to a 12% concession, seller financing, or rate buy-down credit?
- Built in 1945 — when were the roof, HVAC, electrical panel, plumbing, and water heater last replaced?
- Why hasn't it sold? Are there any deal-killer items the seller is aware of (foundation, flood, title, zoning, code violations)?
- Is there a deadline driving the sale (1031 exchange, divorce, estate, relocation)? That informs how much negotiation room exists.
- Schools are D-rated, which usually means shorter tenancies and higher turnover. Who's the typical renter profile here, and what's been the actual vacancy rate?
- What's the average days-on-market for RENTAL listings here right now (not sales)? A rising rental-DOM trend means longer vacancies and softer asking-rent achievability than the comps imply.
- What's the recent tenant-quality profile in this submarket — average credit score on applications, eviction rate, late-payment / NSF rate, and stable-employment percentage? A property-management company in the area should have these aggregated.
- How much new for-sale + rental construction is in the pipeline within 1–3 miles? Heavy new supply typically softens prices + rents 12–24 months out; constrained supply supports both.
Investment metrics
- 1% rule
- 3.48% ✓
- Cap rate
- 31.00%
- Cash-on-cash
- 88.25%
- DSCR
- 4.93
- GRM
- 2.4
CMA / ARV
- ARV (on-the-fly)
- $106,560
- Comps found
- 5
Show comp detail 5 sales within ~0.75 mi
| Address | Dist | Beds/Ba | Sqft | Sold | Price | $/sf | Match |
|---|---|---|---|---|---|---|---|
| 403 S Main St | 0.12mi | 3/1.0 (-1) | 1,520 (+6%) | 4mo | $90,000 | $59 | 77 |
| 197 Park Ave | 0.17mi | 4/1.0 | 1,588 (+10%) | 10mo | $90,144 | $57 | 67 |
| 610 N Russell St | 0.38mi | 4/1.0 | 1,248 (-13%) | 9mo | $140,000 | $112 | 53 |
| 211 E Railroad | 0.30mi | 3/2.0 (-1) | 1,360 (-6%) | 22mo | $125,000 | $92 | 50 |
| 505 Lynch St | 0.24mi | 3/2.5 (-1) | 1,545 (+7%) | 23mo | $115,000 | $74 | 46 |
Match score weights: distance 35% · size 25% · config 20% · recency 20%. Top-matched comps best support the ARV.
Projected returns pro-forma
-3.0% appreciation · 3.0% rent growth · sell at horizon
- IRR
- 88.8%
- Equity multiple
- 5.11×
- Total profit
- $45,883
- Equity at exit
- $5,949
- IRR
- 91.9%
- Equity multiple
- 10.62×
- Total profit
- $107,420
- Equity at exit
- $3,450
Cash invested: $11,172 (down + closing). Projections, not guarantees.
Landlord ↔ Tenant lean methodology
- Overall (STATE)
- 83 Strongly Landlord-Friendly
- State Kentucky
- 83 Strongly Landlord-Friendly · R+16
- County
- — inherits STATE
- City
- — inherits STATE
ZIP-level market 42408
- Home prices YoY
- -2.7%
- Active inventory
- 30
- Price-to-rent
- 2.4×
Monthly cashflow live
- Estimated rent
- $1,389 medium interval (Pro) →
- Mortgage (P&I)
- −$209
- Tax est. 1.5%
- −$50 /mo · $598/yr
- Insurance
- −$17
- HOA
- −$0
- Vacancy / Maint / Mgmt
- −$292
- Net cashflow
- $822
Break-even live
UW: 25.0% down · 7.5% · 30yr · 1.5% tax · 5.0% vac · 8.0% maint · 8.0% mgmt
Financing live
Cash to close
- Down payment
- $9,975
- Closing costs
- $1,197
- Reserves months
- —
- Total cash needed
- —
Loan-product check · same deal, 3 products live
Conventional
25% down · 7.5% · 30yr
- Down + closing
- —
- Monthly P&I
- —
- Monthly cashflow
- —
- DSCR
- —
- Eligible?
- —
Personal DTI + credit; lowest rate.
DSCR
20% down · 8.5% · 30yr
- Down + closing
- —
- Monthly P&I
- —
- Monthly cashflow
- —
- DSCR
- —
- Eligible?
- —
No personal income docs; deal must DSCR.
Hard money
10% down · 12.0% · 12mo
- Down + closing
- —
- Monthly P&I
- —
- Monthly cashflow
- —
- DSCR
- —
- Eligible?
- —
Short-term bridge; refi at stabilization.
Listing history 20 events
-
2026-06-18days on market $39,900 Active 164 DOM
-
2026-06-17days on market $39,900 Active 163 DOM
-
2026-06-16days on market $39,900 Active 162 DOM
-
2026-06-15days on market $39,900 Active 161 DOM
-
2026-06-13days on market $39,900 Active 159 DOM
-
2026-06-12days on market $39,900 Active 158 DOM
-
2026-06-09days on market $39,900 Active 155 DOM
-
2026-06-08days on market $39,900 Active 154 DOM
-
2026-06-07days on market $39,900 Active 153 DOM
-
2026-06-07days on market $39,900 Active 152 DOM
-
2026-06-04days on market $39,900 Active 149 DOM
-
2026-06-02days on market $39,900 Active 148 DOM
-
2026-06-01days on market $39,900 Active 147 DOM
-
2026-05-31days on market $39,900 Active 146 DOM
-
2026-05-31days on market $39,900 Active 145 DOM
-
2026-03-21price $39,900
-
2026-02-17price $44,900
-
2026-02-02price $55,000
-
2026-01-06$60,000 Active
-
1996-10-01soldstatus $39,900
ⓘ Source: listings_history table (triggers on properties + properties_extension) + one-shot
backfill from property_details.listing_events for pre-trigger history.
Climate risk First Street
- Flood 1/10 Low FEMA zone X (unshaded) · 0% chance over 30 yrs
- Wildfire 4/10 Moderate
- Heat 5/10 Major 7 d/yr ≥108°F today · 21 d/yr by 30 yrs out
- Wind 3/10 Moderate 7% chance of damaging wind over 30 yrs
- Air quality 2/10 Low 0 unhealthy d/yr today · 1 by 30 yrs out
Nearby sold comps map
Loading sold comps map…
Walkable amenities ~0.75 mi
Loading nearby amenities…
Taxation est. · year 1
- Rental income
- $16,668
- − Mortgage interest
- −$2,235
- − Property taxes
- −$598
- − Insurance
- −$200
- − Repairs & maintenance
- −$1,333
- − Management
- −$1,333
- − Depreciation
- −$1,161
- Taxable income
- $9,808
- Est. tax owed @ 24.0%
- −$2,354
- After-tax cash flow
- $7,505/yr
For passive investors: Depreciation is non-cash, so a rental often shows a tax loss while cash-flowing — sheltering income. Rental losses are passive: they offset passive income freely, and up to $25,000/yr can offset ordinary (W-2) income if you actively participate and your MAGI is under $100k (phasing out to $0 by $150k); unused losses carry forward. On sale, claimed depreciation is recaptured at up to 25%, and gains may owe capital-gains tax (a 1031 exchange can defer both). Figures are a year-1 estimate at your 24.0% rate — not tax advice; consult a CPA.
Schools (NCES district)
- District
- Dawson Springs Independent
- NCES district ID
- 2101500
- Math proficiency
- 22% ▼ -15.00%
- Reading proficiency
- 29% ▼ -16.00%
- Median HH income
- $26,043
- Composite
- 20.16/100
- National rank
- #8635
- State rank
- #148 of 165 in KY
Livability — Dawson Springs
- Score
- 67/100
- State rank
- #207
- US rank
- #10195
Category grades
Schools grade is shown separately in the Schools card above.
Census & demographics
- Census place
- Dawson Springs, KY
- City population
- 6,167
- Population (ZIP)
- 6,167
Population outlook (Hopkins County) Hauer SSP2
- Today (2025)
- 45,164 people
- By 2030
- 44,083 · -2.4%
- By 2040
- 41,650 · -7.8%
- By 2050
- 39,303 · -13.0%
- By 2075
- 34,567 · -23.5%
- By 2100
- 29,476 · -34.7%
Race, ethnicity, and origin ACS 2023
- Neighborhood character
- Predominantly White (98%)
- Race & ethnicity
- White 98% Hispanic / Latino 1%
- Common ancestry
- Serbian 5% Lithuanian 4% Italian 2%
- Foreign-born
- 0%
Political lean MEDSL · Hopkins
- 2024 margin
- Solid R (+50.9) · D 23.9% · R 74.8% · Other 1.2%
- 2008→2024 swing
- -26.0pp toward R · 2008: -24.9pp · 2024: -50.9pp
- All cycles
- 2024: R+50.9 2020: R+48.0 2016: R+54.0 2012: R+39.9 2008: R+24.9
Not yet ingested
- Civics
- —
Market trends
- HPI YoY
- ▼ -6.70%
- Current HPI
- 240.3026
- Rent YoY
- —
- Metro
- —
- State GDP YoY
- ▲ 1.81%
- F500 in state
- 4
Industry mix (Fortune 500 HQ in KY)
| Industry | F500 HQs | Revenue |
|---|---|---|
| Healthcare | 1 | $118B |
|
||
| Food / Beverage | 1 | $7B |
|
||
Price history
+0.0% since first listed5 events — show timeline
- 2026-03-21 Price Changed $39,900 MHCBOR
- 2026-02-17 Price Changed $44,900 MHCBOR
- 2026-02-02 Price Changed $55,000 MHCBOR
- 2026-01-06 Listed $60,000 MHCBOR
- 1996-10-01 Sold (Public Records) $39,900 Public Records
Cash-flow waterfall
monthlySold comps — $/sqft
last 12 mo · ≤1 miLoading sold comps…