13 Magnolia Rd · Palm Coast, FL
Flood risk 6/10 · Moderate
- FEMA flood zone
- X (unshaded)
- Chance of flooding over 30 yrs
- 0.54%
- Est. flood insurance / yr
- $507 – $1,088
Fire risk 1/10 · Minimal
- Est. fire insurance / yr
- $947 – $1,759
Heat risk 9/10 · Severe
- Hot days now (above 106°F)
- 7 days/yr
- Hot days in 30 yrs
- 19 days/yr
Wind risk 10/10 · Severe
- Chance of severe wind over 30 yrs
- 99.0%
Air-quality risk 2/10 · Minimal
- Unhealthy air days now
- 2 days/yr
- Unhealthy air days in 30 yrs
- 2 days/yr
Risk factors via First Street. Map © Google.
Why this score? — see what drove the D+ grade
The composite is a weighted blend of 9 inputs, each scored 0–100. Each bar is that input's sub-score; the figure is the points it added to the 100-point composite (weight × sub-score).
- Cash flow +17.5/30.0
- ARV discount +7.5/15.0
- DSCR +5.5/10.0
- Schools +4.6/10.0
- 1% rule +4.1/10.0
- Livability +3.5/5.0
- Rent growth +2.7/5.0
- Condition / age +2.5/5.0
- Appreciation +0.0/10.0
$285,000
🖨 Deal sheet 📄 Offer letter ✓ Due diligence
Listing remarks MLS
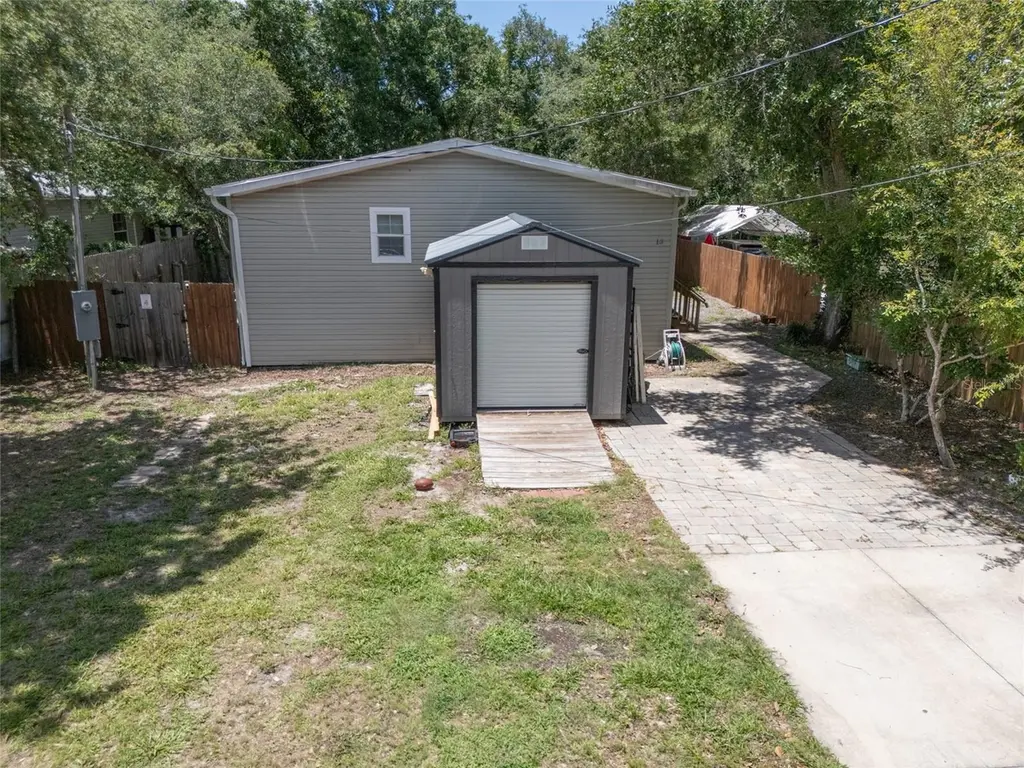
Great AirBNB income property, averages only 5 days a month vacant!!! Over 5,300k as of 7/20 since May. This is a must see in person. Located in the Beautiful Hammock Area of Palm Coast, Walking or Bike Riding Distance to the Beautiful Atlantic Ocean Beaches! Everything is virtually New. Open Floor Plan, Beautiful Kitchen with Stainless Steel Appliances and Eating Bar. Cathedral Ceilings, Crown Moldings and Luxury Vinyl throughout. Large Walk-in Closet in Master and a Partially Fenced in Yard.
Key facts
- Open floor plan
- Cathedral ceilings
- Beach-side living
Tags
Property features AI
Finance
- Other: Homestead exempt; Zoning: MH-1
- HOA & community: Not in a development; No association/HOA
Exterior
- Utilities: Public water; Septic tank; Electricity connected; Cable available
- Home design: Manufactured double wide home; One-story; Southeast-facing; Built on stilts/piling
- Construction: Vinyl siding; Shingle roof; Stilt/On piling foundation; Built as a manufactured home
- Exterior features: Rain gutters; Sliding doors; Paved road access
Interior
- Kitchen: Range; Dishwasher; Refrigerator; Eat-in kitchen
- Bedrooms: 3 bedrooms (1 story)
- Bathrooms: 2 full bathrooms
- Heating & cooling: Central heating; Central air conditioning
- Interior features: Cathedral ceilings; Ceiling fans; Eat-in kitchen; Walk-in closets
- Laundry & utility: Laundry room inside; Washer; Dryer; Electric water heater
Neighborhood map
What this means for you Summary
Snapshot
- This is a 3-bed/2.0-bath manufactured listed at $285k.
Deal economics
- At list price, monthly cash flow is $221 ($3k/yr) — positive.
- The deal already cash-flows at list — no discount required.
- To meet the 1% rule (rent ≥ 1% of price), the offer needs to be $260k (8.9% below list).
- Recommended offer: $260k (8.9% below list) — sets the bar for 1% rule.
- Cap rate 7.2% vs local median 3.8% in Palm Coast — top-decile yield for the area; either an underpriced asset or a hidden risk that comps aren't pricing in. Stress-test before assuming the spread holds.
Location & tenants
- Location reads 69/100 on livability (#478 in FL) — a middle-class / working-renter tenant base. Strengths: housing A+, health & safety A+, cost of living B+; Watch: amenities F, commute F.
- Flagler (rural): math 53% / reading 56% proficiency, ranked #20 of 73 in FL (top 27%) — acceptable for families but not a draw, mixed tenant base, ~2y average lease.
- Zoned schools: Old Kings Elementary School (math 74% / reading 72%, grade A, #271 of 2,144 statewide, top 13%, 979 students, 52% FRL); Matanzas High School (math 36% / reading 53%, grade F, #237 of 667 statewide, top 36%, 1,978 students, 48% FRL) — zoned schools at 50% FRL track the district average.
- Market conditions: Rents flat; 1600 active listings in the ZIP; 20 comparable units currently listed for rent nearby; rentals at typical pace (median 23d on market — plan ~3-4 weeks tenant-placement turnaround); solid renter incomes; 2,588 units permitted in Flagler County in 2024 (0 in 5+ unit buildings).
- This rent runs 37% of the median local income ($84k/yr) — at the standard rent-burdened threshold; future hikes will face affordability resistance.
Forward outlook
- Local home prices are declining (-3.0%/yr); year-one equity from $2k of loan paydown is wiped out by about $9k of value loss. Plan a longer hold.
- Flagler County population projected at +28% by 2050 — long-run rental-demand tailwind backs the buy-and-hold thesis.
Negotiation context
- Only 14 days on market — expect competitive offers; lowballing is unlikely to land.
- 6 sale attempts since 14y ago with the ask held roughly flat each time — persistent listings suggest the price (not the market) is what's stuck; bring a comps-based counter.
- Current owner paid $200k; 42% above their basis — modest negotiation headroom, anchor on the comps not their cost.
Risks & watch-outs
- Climate carrying-cost: major flood risk; severe wind risk, 99% chance of damaging wind over 30y; extreme-heat days projected 7→19/yr by 2055 (HVAC capex compounding) — expect insurance premiums to compound above CPI over the hold.
Questions for the listing agent
- Is there a deadline driving the sale (1031 exchange, divorce, estate, relocation)? That informs how much negotiation room exists.
- The area grade is low — what's the realistic commute time and amenity access for the typical tenant pool here? Any planned neighborhood developments (good or bad) we should know about?
- What's the average days-on-market for RENTAL listings here right now (not sales)? A rising rental-DOM trend means longer vacancies and softer asking-rent achievability than the comps imply.
- What's the recent tenant-quality profile in this submarket — average credit score on applications, eviction rate, late-payment / NSF rate, and stable-employment percentage? A property-management company in the area should have these aggregated.
- How much new for-sale + rental construction is in the pipeline within 1–3 miles? Heavy new supply typically softens prices + rents 12–24 months out; constrained supply supports both.
Investment metrics
- 1% rule
- 0.91% ✗
- Cap rate
- 7.22%
- Cash-on-cash
- 3.33%
- DSCR
- 1.15
- GRM
- 9.1
CMA / ARV
No comps found within radius.
Projected returns pro-forma
-3.0% appreciation · 0.85% rent growth · sell at horizon
- IRR
- -13.4%
- Equity multiple
- 0.53×
- Total profit
- $-37,633
- Equity at exit
- $42,494
- IRR
- -8.0%
- Equity multiple
- 0.54×
- Total profit
- $-36,427
- Equity at exit
- $24,642
Cash invested: $79,800 (down + closing). Projections, not guarantees.
Landlord ↔ Tenant lean methodology
- Overall (STATE)
- 87 Strongly Landlord-Friendly
- State Florida
- 87 Strongly Landlord-Friendly · R+3
- County
- — inherits STATE
- City
- — inherits STATE
ZIP-level market 32137
- Home prices YoY
- -34.5%
- Rents YoY
- 0.8%
- Active inventory
- 1600
- Price-to-rent
- 9.1×
Monthly cashflow live
- Estimated rent
- $2,597 high interval (Pro) →
- Mortgage (P&I)
- −$1,495
- Tax from tax record
- −$217 /mo · $2,606/yr
- Insurance
- −$119
- HOA
- −$0
- Vacancy / Maint / Mgmt
- −$545
- Net cashflow
- $221
Break-even live
UW: 25.0% down · 7.5% · 30yr · 1.5% tax · 5.0% vac · 8.0% maint · 8.0% mgmt
Financing live
Cash to close
- Down payment
- $71,250
- Closing costs
- $8,550
- Reserves months
- —
- Total cash needed
- —
Loan-product check · same deal, 3 products live
Conventional
25% down · 7.5% · 30yr
- Down + closing
- —
- Monthly P&I
- —
- Monthly cashflow
- —
- DSCR
- —
- Eligible?
- —
Personal DTI + credit; lowest rate.
DSCR
20% down · 8.5% · 30yr
- Down + closing
- —
- Monthly P&I
- —
- Monthly cashflow
- —
- DSCR
- —
- Eligible?
- —
No personal income docs; deal must DSCR.
Hard money
10% down · 12.0% · 12mo
- Down + closing
- —
- Monthly P&I
- —
- Monthly cashflow
- —
- DSCR
- —
- Eligible?
- —
Short-term bridge; refi at stabilization.
Rent comps 20 comps
| Address | Beds | Baths | Sqft | Rent | $/sqft | DOM | Units | Dist |
|---|---|---|---|---|---|---|---|---|
| 12 Dawson Dr Palm Coast, FL | 3.0 | 2.0 | 1392 | $2,500 | $1.80 | 23d | 1 | 0.28mi |
| 25 Riverview Bnd N Unit 1546088P Palm Coast, FL | 3.0 | 2.0 | 1819 | $2,581 | $1.42 | 14d | 1 | 0.58mi |
| 115 Riverview Bnd S #2145 Palm Coast, FL | 3.0 | 2.0 | 1575 | $3,000 | $1.90 | 2d | 1 | 0.63mi |
| 115 Riverview Bnd S #2145 Palm Coast, FL | 3.0 | 2.0 | 1575 | $3,000 | $1.90 | 14d | 1 | 0.63mi |
| 900 Cinnamon Beach Way Unit 1261621P Palm Coast, FL | 3.0 | 2.0 | 1689 | $8,231 | $4.87 | 23d | 1 | 0.65mi |
| 35 Captains Walk Palm Coast, FL | 3.0 | 2.5 | 1565 | $2,400 | $1.53 | 23d | 1 | 0.81mi |
| 102 Yacht Harbor Dr #264 Palm Coast, FL | 2.0 | 2.0 | 1570 | $3,450 | $2.20 | 2d | 1 | 0.87mi |
| 35 Ocean Crest Way #1124 Palm Coast, FL | 2.0 | 2.0 | 1264 | $3,500 | $2.77 | 23d | 1 | 0.95mi |
| 200 Ocean Crest Dr #1111 Palm Coast, FL | 3.0 | 3.0 | 1818 | $7,000 | $3.85 | 23d | 1 | 0.99mi |
| 14 Cedarview Ct Palm Coast, FL | 3.0 | 2.0 | 1462 | $2,200 | $1.50 | 23d | 1 | 1.07mi |
| 87 Club House Dr Palm Coast, FL | 3.0 | 2.0 | 1265 | $2,500 | $1.98 | 23d | 1 | 1.14mi |
| 24 Claridge Ct S Palm Coast, FL | 3.0 | 2.0 | 1817 | $3,600 | $1.98 | 23d | 1 | 1.14mi |
| 100 Palm Harbor Pkwy #29 Palm Coast, FL | 3.0 | 2.0 | 1455 | $2,000 | $1.37 | 23d | 1 | 1.24mi |
| 20 Sabal Bnd Unit 1 Palm Coast, FL | 3.0 | 2.5 | 1466 | $2,100 | $1.43 | 21d | 1 | 1.25mi |
| 214 Coral Reef Ct N Unit B Palm Coast, FL | 4.0 | 2.0 | 1300 | $1,850 | $1.42 | 2d | 1 | 1.27mi |
| 101 Palm Harbor Pkwy Unit A404 Palm Coast, FL | 2.0 | 1.5 | 1600 | $1,700 | $1.06 | 23d | 1 | 1.29mi |
| 11 Avenue de la Mer #1205 Palm Coast, FL | 2.0 | 2.0 | 1490 | $3,000 | $2.01 | 23d | 1 | 1.36mi |
| 58 Club House Dr Palm Coast, FL | 2.0 | 1.5 | 1216 | $1,795 | $1.48 | 23d | 1 | 1.42mi |
| 9 Collinson Ct Palm Coast, FL | 3.0 | 2.0 | 1276 | $2,250 | $1.76 | 2d | 1 | 1.46mi |
| 56 Club House Dr #107 Palm Coast, FL | 2.0 | 2.0 | 986 | $1,700 | $1.72 | 14d | 1 | 1.46mi |
Listing history 11 events
-
2026-06-18days on market $285,000 Active 14 DOM
-
2026-06-17days on market $285,000 Active 13 DOM
-
2026-06-16days on market $285,000 Active 12 DOM
-
2026-06-15days on market $285,000 Active 11 DOM
-
2026-06-14days on market $285,000 Active 9 DOM
-
2026-06-13days on market $285,000 Active 8 DOM
-
2026-06-10days on market $285,000 Active 6 DOM
-
2026-06-09days on market $285,000 Active 5 DOM
-
2026-06-08days on market $285,000 Active 4 DOM
-
2026-06-07remarks 693-char remark
-
2026-06-07$285,000 Active 3 DOM
ⓘ Source: listings_history table (triggers on properties + properties_extension) + one-shot
backfill from property_details.listing_events for pre-trigger history.
Tax reassessment forecast FL · Resets to sale price
- Current annual tax
- $2,606 · $217/mo
- Projected year-2 tax
- $2,606 · $217/mo
- Expected delta
- $0/yr ($0/mo · 0.0%)
ⓘ Screening estimate from a state-policy table — verify with the county assessor before closing.
Climate risk First Street
- Flood 6/10 Major FEMA zone X (unshaded) · 54% chance over 30 yrs
- Wildfire 1/10 Low
- Heat 9/10 Extreme 7 d/yr ≥106°F today · 19 d/yr by 30 yrs out
- Wind 10/10 Extreme 99% chance of damaging wind over 30 yrs
- Air quality 2/10 Low 2 unhealthy d/yr today · 2 by 30 yrs out
Nearby sold comps map
Loading sold comps map…
Walkable amenities ~0.75 mi
Loading nearby amenities…
Taxation est. · year 1
- Rental income
- $31,167
- − Mortgage interest
- −$15,964
- − Property taxes
- −$2,606
- − Insurance
- −$1,425
- − Repairs & maintenance
- −$2,493
- − Management
- −$2,493
- − Depreciation
- −$8,291
- Taxable loss
- −$2,106
- Est. tax savings @ 24.0%
- +$506
- After-tax cash flow
- $3,161/yr
For passive investors: Depreciation is non-cash, so a rental often shows a tax loss while cash-flowing — sheltering income. Rental losses are passive: they offset passive income freely, and up to $25,000/yr can offset ordinary (W-2) income if you actively participate and your MAGI is under $100k (phasing out to $0 by $150k); unused losses carry forward. On sale, claimed depreciation is recaptured at up to 25%, and gains may owe capital-gains tax (a 1031 exchange can defer both). Figures are a year-1 estimate at your 24.0% rate — not tax advice; consult a CPA.
Schools (NCES district)
- District
- Flagler
- NCES district ID
- 1200540
- Math proficiency
- 53% ▼ -9.00%
- Reading proficiency
- 56% ▼ -4.00%
- Median HH income
- $48,354
- Composite
- 46.35/100
- National rank
- #2464
- State rank
- #20 of 73 in FL
Livability — Palm Coast
- Score
- 69/100
- State rank
- #478
- US rank
- #8721
Category grades
Schools grade is shown separately in the Schools card above.
Census & demographics
- County
- Flagler County · 113,412 people
- City population
- 105,049
- Metro
- Deltona-Daytona Beach-Ormond Beach, FL
- Population (ZIP)
- 48,391
- Household income
- $83,923
- Rent vs Own
- Severe rent burden
- 816.0
Population outlook (Flagler County) Hauer SSP2
- Today (2025)
- 123,474 people
- By 2030
- 131,864 · +6.8%
- By 2040
- 146,176 · +18.4%
- By 2050
- 157,398 · +27.5%
- By 2075
- 177,990 · +44.2%
- By 2100
- 183,381 · +48.5%
Race, ethnicity, and origin ACS 2023
- Neighborhood character
- Predominantly White (77%)
- Race & ethnicity
- White 77% Hispanic / Latino 10% Two or more races 8% Black 6% Asian 3%
- Hispanic origin (detail)
- Puerto Rican 4% Cuban 1%
- Common ancestry
- Romanian 4% Russian 2% Lithuanian 2%
- Foreign-born
- 13% · Canada, Jamaica
- Languages at home
- 85% English-only · Spanish 7% Other Indo-European 3% Russian/Polish/Slavic 2%
Political lean MEDSL · Flagler
- 2024 margin
- Strong R (+28.2) · D 35.6% · R 63.8%
- 2008→2024 swing
- -29.8pp toward R · 2008: 1.6pp · 2024: -28.2pp
- All cycles
- 2024: R+28.2 2020: R+20.8 2016: R+20.6 2012: R+7.4 2008: D+1.6
Not yet ingested
- Civics
- —
Market trends
- HPI YoY
- ▼ -153.27%
- Current HPI
- 290.4607
- Rent YoY
- ▲ 0.85%
- Metro
- Deltona-Daytona Beach-Ormond Beach, FL
- State GDP YoY
- ▲ 3.28%
- F500 in state
- 36
Industry mix (Fortune 500 HQ in FL)
| Industry | F500 HQs | Revenue |
|---|---|---|
| Industrial Technology | 2 | $29B |
|
||
| Insurance | 2 | $17B |
|
||
| Retail | 1 | $60B |
|
||
| Technology Distribution | 1 | $58B |
|
||
| Homebuilding | 1 | $35B |
|
||
| Technology Manufacturing | 1 | $35B |
|
||
Price history
+630.8% since first listed15 events — show timeline
- 2026-06-04 Listed $285,000 Stellar MLS as Distributed by MLS Grid
- 2022-09-09 Listing Removed — Daytona MLS
- 2020-11-23 Sold (Public Records) $200,000 Public Records
- 2020-10-30 Sold (MLS) $200,000 Stellar MLS as Distributed by MLS Grid
- 2020-07-08 Listed $229,000 Stellar MLS as Distributed by MLS Grid
- 2020-06-24 Listing Removed — Stellar MLS as Distributed by MLS Grid
- 2020-06-23 Listed $239,500 Stellar MLS as Distributed by MLS Grid
- 2020-06-12 Listing Removed — Stellar MLS as Distributed by MLS Grid
- 2019-12-03 Listed $239,500 Stellar MLS as Distributed by MLS Grid
- 2018-06-21 Listing Removed — Stellar MLS as Distributed by MLS Grid
- 2018-01-04 Listed $55,000 Stellar MLS as Distributed by MLS Grid
- 2015-06-30 Sold (Public Records) $25,000 Public Records
- 2012-10-28 Listed $69,000 Daytona MLS
- 2005-03-08 Sold (Public Records) $80,000 Public Records
- 2002-05-16 Sold (Public Records) $39,000 Public Records
Property tax history
+23.1%/yrLatest (2025): $2,606 · +18.3% YoY. Source: county tax records.
Cash-flow waterfall
monthlySold comps — $/sqft
last 12 mo · ≤1 miLoading sold comps…