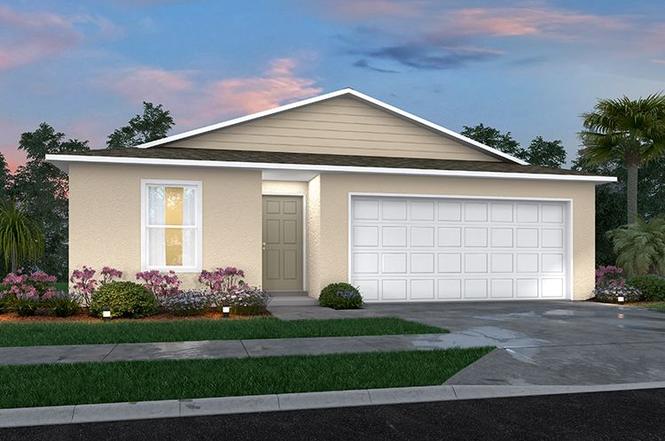
1246 Block Plan · Port LaBelle, FL
Flood risk No data
- FEMA flood zone
- —
- Chance of flooding over 30 yrs
- —
- Est. flood insurance / yr
- —
Fire risk No data
- Est. fire insurance / yr
- —
Heat risk No data
- Hot days now (above threshold)
- —
- Hot days in 30 yrs
- —
Wind risk No data
- Chance of severe wind over 30 yrs
- —
Air-quality risk No data
- Unhealthy air days now
- —
- Unhealthy air days in 30 yrs
- —
Risk factors via First Street. Map © Google.
Why this score? — see what drove the D grade
The composite is a weighted blend of 9 inputs, each scored 0–100. Each bar is that input's sub-score; the figure is the points it added to the 100-point composite (weight × sub-score).
- Appreciation +10.0/10.0
- Cash flow +9.3/30.0
- ARV discount +5.0/15.0
- Schools +3.1/10.0
- Livability +3.1/5.0
- 1% rule +2.8/10.0
- DSCR +2.6/10.0
- Rent growth +2.5/5.0
- Condition / age +2.5/5.0
$270,990
🖨 Deal sheet (PDF) 📄 Offer letter ✓ Due diligence
Key facts
- 2 garage spots
- Listed 674 days
Property features AI
Finance
- Financial info: List price $270,990
Exterior
- Parking: 2 total parking spaces; 2-car garage
- Home design: Single-family plan, new construction inventory
- Construction: 1246 square-foot living area
- Exterior features: Located at Cowboy Way & Cedarwood Parkway, Labelle, FL
Interior
- Bedrooms: 3 bedrooms
- Bathrooms: 2 full bathrooms
- Interior features: Plan home (1246 Block plan)
Neighborhood map
What this means for you Summary
Snapshot
- This is a 3-bed/2.0-bath single-family listed at $271k.
Deal economics
- At list price, monthly cash flow is $-200 ($-2k/yr) — negative.
- To cash-flow at today's rent, offer at most $242k (10.7% below list).
- To meet the 1% rule (rent ≥ 1% of price), the offer needs to be $212k (21.9% below list).
- Recommended offer: $212k (21.9% below list) — sets the bar for 1% rule.
Location & tenants
- Location reads 62/100 on livability (#750 in FL) — a middle-class / working-renter tenant base. Strengths: cost of living A+, housing A+; Watch: amenities F, commute F, employment F.
- Hendry (town): math 35% / reading 40% proficiency, ranked #65 of 73 in FL (top 89%) — families likely to look elsewhere, expect single-tenant / working-renter base with shorter leases; 75% free/reduced lunch — lower-income household profile, screen leases tightly.
- Zoned schools: Country Oaks Elementary School (math 48% / reading 45%, grade D-, #1,223 of 2,144 statewide, top 57%, 893 students, 75% FRL); Labelle Middle School (math 37% / reading 38%, grade F, #395 of 571 statewide, top 70%, 817 students, 72% FRL); Labelle High School (math 42% / reading 41%, grade F, #284 of 667 statewide, top 43%, 1,451 students, 62% FRL).
- Market conditions: 950 active listings in the ZIP; 13 comparable units currently listed for rent nearby; rentals at typical pace (median 18d on market — plan ~3-4 weeks tenant-placement turnaround); 557 units permitted in Hendry County in 2024 (45 in 5+ unit buildings).
- This rent runs 45% of the median local income ($57k/yr) — at the standard rent-burdened threshold; future hikes will face affordability resistance.
Forward outlook
- In year one you build about $29k of equity ($2k loan paydown + $27k appreciation (10.0% local appreciation)).
- Hendry County population projected to shrink 7% by 2050 — rents likely to lag national; underwrite the cash flow, not the appreciation.
- By year 2, paydown + projected appreciation supports a ~$47k cash-out refi (75% LTV) — recoverable capital for the next deal without selling this one.
Negotiation context
- It's been on market 674 days — a 12% lower offer ($238k) is reasonable based on typical stale-listing flexibility.
Questions for the listing agent
- What do current leases actually rent for vs. the listed asking? Can we see a recent rent roll and the last 12 months of T-12 income?
- It's been on market 674 days. Have you received any prior offers? Is the seller open to a 22% concession, seller financing, or rate buy-down credit?
- Why hasn't it sold? Are there any deal-killer items the seller is aware of (foundation, flood, title, zoning, code violations)?
- Is there a deadline driving the sale (1031 exchange, divorce, estate, relocation)? That informs how much negotiation room exists.
- Schools are F-rated, which usually means shorter tenancies and higher turnover. Who's the typical renter profile here, and what's been the actual vacancy rate?
- The area grade is low — what's the realistic commute time and amenity access for the typical tenant pool here? Any planned neighborhood developments (good or bad) we should know about?
- What's the average days-on-market for RENTAL listings here right now (not sales)? A rising rental-DOM trend means longer vacancies and softer asking-rent achievability than the comps imply.
- What's the recent tenant-quality profile in this submarket — average credit score on applications, eviction rate, late-payment / NSF rate, and stable-employment percentage? A property-management company in the area should have these aggregated.
- How much new for-sale + rental construction is in the pipeline within 1–3 miles? Heavy new supply typically softens prices + rents 12–24 months out; constrained supply supports both.
Investment metrics
- 1% rule
- 0.78% ✗
- Cap rate
- 5.41%
- Cash-on-cash
- -3.17%
- DSCR
- 0.86
- GRM
- 10.7
CMA / ARV
- ARV (on-the-fly)
- $256,676
- Comps found
- 12
Show comp detail 12 sales within ~0.75 mi
| Address | Dist | Beds/Ba | Sqft | Sold | Price | $/sf | Match |
|---|---|---|---|---|---|---|---|
| 9034 Lamkin Cir | 0.12mi | 3/2.0 | 1,239 (-1%) | 1mo | $252,000 | $203 | 93 |
| 9025 Lamkin Cir | 0.16mi | 3/2.0 | 1,198 (-4%) | 1mo | $250,000 | $209 | 85 |
| 9049 Lamkin Cir | 0.13mi | 3/2.0 | 1,292 (+4%) | 4mo | $284,900 | $221 | 84 |
| 9020 N Indio Cir | 0.38mi | 3/2.0 | 1,324 (+6%) | 2mo | $259,900 | $196 | 70 |
| 9048 Lamkin Cir | 0.21mi | 3/2.0 | 1,408 (+13%) | 1mo | $257,500 | $183 | 68 |
| 9006 Lamkin Cir | 0.27mi | 3/2.0 | 1,419 (+14%) | 1mo | $300,000 | $211 | 64 |
| 7004 Beaver Cir | 0.65mi | 3/2.0 | 1,204 (-3%) | 4mo | $265,000 | $220 | 61 |
| 8042 Buttercup Cir | 0.62mi | 3/2.0 | 1,324 (+6%) | 3mo | $271,900 | $205 | 58 |
| 8044 Buttercup Cir | 0.63mi | 3/2.0 | 1,324 (+6%) | 2mo | $259,900 | $196 | 58 |
| 7011 Waldo Cir | 0.48mi | 3/2.0 | 1,367 (+10%) | 5mo | $265,000 | $194 | 58 |
| 7006 Patriot Ct | 0.65mi | 3/2.0 | 1,324 (+6%) | 3mo | $273,400 | $206 | 57 |
| 8002 Mill Ct | 0.59mi | 2/2.0 (-1) | 1,356 (+9%) | 3mo | $285,000 | $210 | 50 |
Match score weights: distance 35% · size 25% · config 20% · recency 20%. Top-matched comps best support the ARV.
Projected returns pro-forma
10.0% appreciation · 3.0% rent growth · sell at horizon
- IRR
- 22.0%
- Equity multiple
- 2.78×
- Total profit
- $134,867
- Equity at exit
- $244,129
- IRR
- 19.8%
- Equity multiple
- 6.37×
- Total profit
- $407,254
- Equity at exit
- $526,474
Cash invested: $75,877 (down + closing). Projections, not guarantees.
Landlord ↔ Tenant lean methodology
- Overall (STATE)
- 87 Strongly Landlord-Friendly
- State Florida
- 87 Strongly Landlord-Friendly · R+3
- County
- — inherits STATE
- City
- — inherits STATE
ZIP-level market 33935
- Home prices YoY
- 16.3%
- Active inventory
- 950
- Price-to-rent
- 10.7×
Monthly cashflow live
- Estimated rent
- $2,117 high interval (Pro) →
- Mortgage (P&I)
- −$1,421
- Tax est. 1.5%
- −$339 /mo · $4,065/yr
- Insurance
- −$113
- HOA
- −$0
- Vacancy / Maint / Mgmt
- −$445
- Net cashflow
- $-200
Break-even live
Sensitivity live
| Price | -10% $-13 | -5% $-107 | +0% $-200 | +5% $-294 | +10% $-388 |
|---|---|---|---|---|---|
| Rent | -10% $-367 | -5% $-284 | +0% $-200 | +5% $-117 | +10% $-33 |
| Rate | -1.0pp $-64 | -0.5pp $-131 | base $-200 | +0.5pp $-270 | +1.0pp $-342 |
UW: 25.0% down · 7.5% · 30yr · 1.5% tax · 5.0% vac · 8.0% maint · 8.0% mgmt
Financing live
Cash to close
- Down payment
- $67,748
- Closing costs
- $8,130
- Reserves months
- —
- Total cash needed
- —
Loan-product check · same deal, 3 products live
Conventional
25% down · 7.5% · 30yr
- Down + closing
- —
- Monthly P&I
- —
- Monthly cashflow
- —
- DSCR
- —
- Eligible?
- —
Personal DTI + credit; lowest rate.
DSCR
20% down · 8.5% · 30yr
- Down + closing
- —
- Monthly P&I
- —
- Monthly cashflow
- —
- DSCR
- —
- Eligible?
- —
No personal income docs; deal must DSCR.
Hard money
10% down · 12.0% · 12mo
- Down + closing
- —
- Monthly P&I
- —
- Monthly cashflow
- —
- DSCR
- —
- Eligible?
- —
Short-term bridge; refi at stabilization.
Rent comps 13 comps
| Address | Beds | Baths | Sqft | Rent | $/sqft | DOM | Units | Dist |
|---|---|---|---|---|---|---|---|---|
| 7061 Tide Cir Labelle, FL | 4.0 | 2.0 | 1500 | $1,695 | $1.13 | 25d | 1 | 0.12mi |
| 9001 Penny Cir Labelle, FL | 3.0 | 2.0 | 1472 | $2,300 | $1.56 | 18d | 1 | 0.30mi |
| 9001 Penny Cir Labelle, FL | 3.0 | 2.0 | 1472 | $2,300 | $1.56 | 25d | 1 | 0.30mi |
| 8030 Olive Cir Labelle, FL | 4.0 | 2.0 | 1499 | $2,300 | $1.53 | 5d | 1 | 0.52mi |
| 9012 S Indio Ct Labelle, FL | 3.0 | 2.0 | 1400 | $2,100 | $1.50 | 21d | 1 | 0.54mi |
| 9013 Ike Ct Labelle, FL | 3.0 | 2.0 | 1367 | $2,100 | $1.54 | 5d | 1 | 0.61mi |
| 9007 Meadow Cir Labelle, FL | 4.0 | 2.0 | 1500 | $1,695 | $1.13 | 5d | 1 | 0.77mi |
| 9018 W Justice Cir Labelle, FL | 4.0 | 2.0 | 1499 | $1,950 | $1.30 | 13d | 1 | 0.79mi |
| 801 SW Raintree Blvd Labelle, FL | 3.0 | 2.0 | 1285 | $1,700 | $1.32 | 25d | 1 | 0.80mi |
| 8033 Melody Cir Labelle, FL | 3.0 | 2.0 | 1215 | $1,999 | $1.65 | 18d | 1 | 0.82mi |
| 8004 Spice Ct Labelle, FL | 3.0 | 2.0 | 1292 | $2,000 | $1.55 | 21d | 1 | 0.87mi |
| 8002 Vega Ct Labelle, FL | 3.0 | 2.0 | 1389 | $1,900 | $1.37 | 25d | 1 | 1.18mi |
| 6018 Acorn Cir Labelle, FL | 3.0 | 2.0 | 1408 | $2,200 | $1.56 | 18d | 1 | 1.19mi |
Listing history 14 events
-
2026-06-22days on market $270,990 Active 674 DOM
-
2026-06-18days on market $270,990 Active 671 DOM
-
2026-06-17days on market $270,990 Active 670 DOM
-
2026-06-16days on market $270,990 Active 669 DOM
-
2026-06-15days on market $270,990 Active 668 DOM
-
2026-06-13days on market $270,990 Active 665 DOM
-
2026-06-10days on market $270,990 Active 663 DOM
-
2026-06-09days on market $270,990 Active 662 DOM
-
2026-06-08days on market $270,990 Active 661 DOM
-
2026-06-07days on market $270,990 Active 660 DOM
-
2026-06-03days on market $270,990 Active 656 DOM
-
2026-06-02days on market $270,990 Active 655 DOM
-
2026-06-01days on market $270,990 Active 654 DOM
-
2026-05-31days on market $270,990 Active 653 DOM
ⓘ Source: listings_history table (triggers on properties + properties_extension) + one-shot
backfill from property_details.listing_events for pre-trigger history.
Nearby sold comps map
Loading sold comps map…
Walkable amenities ~0.75 mi
Loading nearby amenities…
Taxation est. · year 1
- Rental income
- $25,405
- − Mortgage interest
- −$15,180
- − Property taxes
- −$4,065
- − Insurance
- −$1,355
- − Repairs & maintenance
- −$2,032
- − Management
- −$2,032
- − Depreciation
- −$7,883
- Taxable loss
- −$7,142
- Est. tax savings @ 24.0%
- +$1,714
- After-tax cash flow
- $-689/yr
For passive investors: Depreciation is non-cash, so a rental often shows a tax loss while cash-flowing — sheltering income. Rental losses are passive: they offset passive income freely, and up to $25,000/yr can offset ordinary (W-2) income if you actively participate and your MAGI is under $100k (phasing out to $0 by $150k); unused losses carry forward. On sale, claimed depreciation is recaptured at up to 25%, and gains may owe capital-gains tax (a 1031 exchange can defer both). Figures are a year-1 estimate at your 24.0% rate — not tax advice; consult a CPA.
Schools (NCES district)
- District
- Hendry
- NCES district ID
- 1200780
- Math proficiency
- 35% ▼ -11.00%
- Reading proficiency
- 40% ▼ -4.00%
- Median HH income
- $37,043
- Composite
- 31.16/100
- National rank
- #6054
- State rank
- #65 of 73 in FL
Livability — Port LaBelle
- Score
- 62/100
- State rank
- #750
- US rank
- #16264
Category grades
Schools grade is shown separately in the Schools card above.
Census & demographics
- Census place
- Port LaBelle, FL
- County
- Hendry County · 23,186 people
- City population
- 23,186
- Metro
- Clewiston, FL
- Population (ZIP)
- 23,186
- Household income
- $57,009
- Rent vs Own
- Severe rent burden
- 498.0
Population outlook (Hendry County) Hauer SSP2
- Today (2025)
- 38,866 people
- By 2030
- 38,558 · -0.8%
- By 2040
- 37,743 · -2.9%
- By 2050
- 36,117 · -7.1%
- By 2075
- 30,070 · -22.6%
- By 2100
- 21,966 · -43.5%
Race, ethnicity, and origin ACS 2023
- Neighborhood character
- Majority Hispanic (56%)
- Race & ethnicity
- Hispanic / Latino 56% White 39% Two or more races 21% Black 2% Native American 2%
- Hispanic origin (detail)
- Mexican 40% Puerto Rican 3% Cuban 5%
- Common ancestry
- Lithuanian 2% Serbian 2% Slovak 1%
- Foreign-born
- 27% · Canada, Jamaica
- Languages at home
- 50% English-only · Spanish 50%
Political lean MEDSL · Hendry
- 2024 margin
- Solid R (+38.3) · D 30.4% · R 68.7%
- 2008→2024 swing
- -31.1pp toward R · 2008: -7.2pp · 2024: -38.3pp
- All cycles
- 2024: R+38.3 2020: R+23.0 2016: R+14.2 2012: R+5.9 2008: R+7.2
Not yet ingested
- Civics
- —
Market trends
- HPI YoY
- ▲ 75.20%
- Current HPI
- 537.4928
- Rent YoY
- —
- Metro
- Clewiston, FL
- State GDP YoY
- ▲ 3.28%
- F500 in state
- 36
Industry mix (Fortune 500 HQ in FL)
| Industry | F500 HQs | Revenue |
|---|---|---|
| Industrial Technology | 2 | $29B |
|
||
| Insurance | 2 | $17B |
|
||
| Retail | 1 | $60B |
|
||
| Technology Distribution | 1 | $58B |
|
||
| Homebuilding | 1 | $35B |
|
||
| Technology Manufacturing | 1 | $35B |
|
||
Cash-flow waterfall
monthlySold comps — $/sqft
last 12 mo · ≤1 miLoading sold comps…