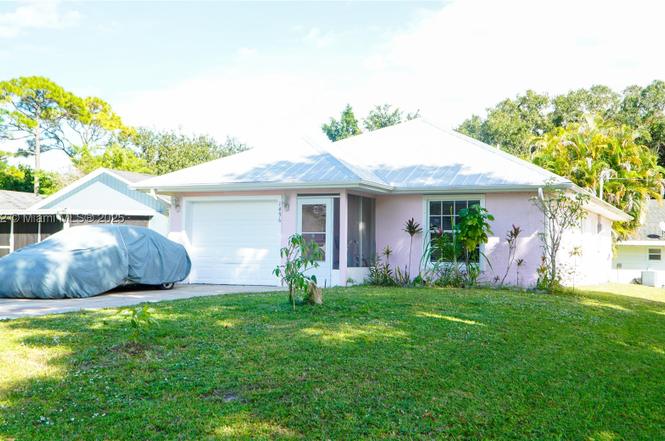
1496 SW 24th Ave SW · Florida Ridge, FL
Flood risk 1/10 · Minimal
- FEMA flood zone
- X (unshaded)
- Chance of flooding over 30 yrs
- 0.0%
- Est. flood insurance / yr
- $507 – $1,088
Fire risk 3/10 · Minor
- Est. fire insurance / yr
- $947 – $1,759
Heat risk 10/10 · Severe
- Hot days now (above 106°F)
- 7 days/yr
- Hot days in 30 yrs
- 24 days/yr
Wind risk 10/10 · Severe
- Chance of severe wind over 30 yrs
- 99.0%
Air-quality risk 1/10 · Minimal
- Unhealthy air days now
- 0 days/yr
- Unhealthy air days in 30 yrs
- 0 days/yr
Risk factors via First Street. Map © Google.
Why this score? — see what drove the D grade
The composite is a weighted blend of 9 inputs, each scored 0–100. Each bar is that input's sub-score; the figure is the points it added to the 100-point composite (weight × sub-score).
- Cash flow +17.9/30.0
- DSCR +5.6/10.0
- Schools +4.2/10.0
- ARV discount +3.7/15.0
- Livability +3.6/5.0
- 1% rule +3.5/10.0
- Rent growth +3.5/5.0
- Condition / age +2.5/5.0
- Appreciation +0.0/10.0
$275,000
🖨 Deal sheet 📄 Offer letter ✓ Due diligence
Listing remarks MLS
LARGE 2/2 WITH DEN, MOVE RIGHT IN. THIS IS A FANNIE MAE HOMEPATH PROPERTY. CLOSE BY 12/31/10 AND RECEIVE UP TO 3.5% CLOSING COST ASSISTANCE AND $1500 SELLING BROKER BONUS. ELIGIBILITY RESTRICTIONS APPLY
Key facts
- Renovated bathroom
- Spacious lot
- 2021 metal roof
Tags
Property features AI
Exterior
- Parking: Attached garage (1 car); Driveway
- Utilities: Public water; Public sewer
- Home design: Single-story home; Faces west; RS-6 zoning
- Construction: Stucco construction; Metal roof; Effective year built
- Exterior features: Open porch
Interior
- Kitchen: Dishwasher; Microwave; Refrigerator
- Flooring: Tile
- Bathrooms: 2 full bathrooms
- Heating & cooling: Central heating; Central air conditioning
- Interior features: Bedroom on main level; First-floor entry
Neighborhood map
What this means for you Summary
Snapshot
- This is a 3-bed/2.0-bath single-family listed at $275k.
Deal economics
- At list price, monthly cash flow is $231 ($3k/yr) — positive.
- The deal already cash-flows at list — no discount required.
- To meet the 1% rule (rent ≥ 1% of price), the offer needs to be $235k (14.5% below list).
- Recommended offer: $235k (14.5% below list) — sets the bar for 1% rule.
- Cap rate 7.3% vs local median 4.5% in Florida Ridge — top-decile yield for the area; either an underpriced asset or a hidden risk that comps aren't pricing in. Stress-test before assuming the spread holds.
Location & tenants
- Location reads 72/100 on livability (#353 in FL) — a middle-class / working-renter tenant base. Strengths: commute A+, cost of living A+, housing A+; Watch: schools D, employment D, amenities F.
- Indian River (other): math 48% / reading 52% proficiency, ranked #35 of 73 in FL (top 48%) — acceptable for families but not a draw, mixed tenant base, ~2y average lease.
- Market conditions: Rents rising fast (+4.2%/yr); 348 active listings in the ZIP; 6 comparable units currently listed for rent nearby; rentals at typical pace (median 21d on market — plan ~3-4 weeks tenant-placement turnaround); 564 units permitted in Indian River County in 2024 (281 in 5+ unit buildings).
- This rent runs 42% of the median local income ($67k/yr) — at the standard rent-burdened threshold; future hikes will face affordability resistance.
Forward outlook
- Local home prices are declining (-3.0%/yr); year-one equity from $2k of loan paydown is wiped out by about $8k of value loss. Plan a longer hold.
- Indian River County population projected at +18% by 2050 — long-run rental-demand tailwind backs the buy-and-hold thesis.
Negotiation context
- It's been on market 228 days — a 12% lower offer ($242k) is reasonable based on typical stale-listing flexibility.
- 2 sale attempts with the ask held roughly flat each time — persistent listings suggest the price (not the market) is what's stuck; bring a comps-based counter.
- Current owner paid $49k; list at $275k implies a 462% gain — meaningful room to come down on a strong offer.
Risks & watch-outs
- Climate carrying-cost: severe wind risk, 99% chance of damaging wind over 30y; extreme-heat days projected 7→24/yr by 2055 (HVAC capex compounding) — expect insurance premiums to compound above CPI over the hold.
Questions for the listing agent
- It's been on market 228 days. Have you received any prior offers? Is the seller open to a 15% concession, seller financing, or rate buy-down credit?
- Why hasn't it sold? Are there any deal-killer items the seller is aware of (foundation, flood, title, zoning, code violations)?
- Is there a deadline driving the sale (1031 exchange, divorce, estate, relocation)? That informs how much negotiation room exists.
- Schools are D-rated, which usually means shorter tenancies and higher turnover. Who's the typical renter profile here, and what's been the actual vacancy rate?
- The area grade is low — what's the realistic commute time and amenity access for the typical tenant pool here? Any planned neighborhood developments (good or bad) we should know about?
- What's the average days-on-market for RENTAL listings here right now (not sales)? A rising rental-DOM trend means longer vacancies and softer asking-rent achievability than the comps imply.
- What's the recent tenant-quality profile in this submarket — average credit score on applications, eviction rate, late-payment / NSF rate, and stable-employment percentage? A property-management company in the area should have these aggregated.
- How much new for-sale + rental construction is in the pipeline within 1–3 miles? Heavy new supply typically softens prices + rents 12–24 months out; constrained supply supports both.
Investment metrics
- 1% rule
- 0.85% ✗
- Cap rate
- 7.30%
- Cash-on-cash
- 3.60%
- DSCR
- 1.16
- GRM
- 9.7
CMA / ARV
- ARV (on-the-fly)
- $253,786
- Comps found
- 12
Show comp detail 12 sales within ~0.75 mi
| Address | Dist | Beds/Ba | Sqft | Sold | Price | $/sf | Match |
|---|---|---|---|---|---|---|---|
| 1635 22nd Ave SW | 0.21mi | 3/2.0 | 1,141 (+2%) | 4mo | $315,000 | $276 | 84 |
| 1395 25th Ave Ave SW | 0.14mi | 2/2.0 (-1) | 1,051 (-6%) | 2mo | $239,000 | $227 | 77 |
| 1606 20th Ave SW | 0.30mi | 3/2.0 | 1,176 (+5%) | 1mo | $214,900 | $183 | 76 |
| 1365 19th Ave SW | 0.31mi | 3/2.0 | 1,170 (+5%) | 4mo | $299,000 | $256 | 75 |
| 2075 14th St SW | 0.17mi | 2/2.0 (-1) | 1,200 (+7%) | 3mo | $223,000 | $186 | 72 |
| 1255 18th Ave SW | 0.42mi | 3/1.0 | 1,152 (+3%) | 1mo | $229,000 | $199 | 70 |
| 1375 26th Ave SW | 0.23mi | 2/1.0 (-1) | 1,036 (-7%) | 0mo | $153,000 | $148 | 68 |
| 1221 18th Ave SW | 0.44mi | 3/2.0 | 1,176 (+5%) | 4mo | $195,000 | $166 | 67 |
| 1175 13th Ave SW | 0.73mi | 3/2.0 | 1,118 (0%) | 2mo | $270,000 | $242 | 64 |
| 1304 32nd Ave SW | 0.61mi | 3/2.0 | 1,236 (+11%) | 0mo | $299,000 | $242 | 54 |
| 1340 18th Ave SW | 0.39mi | 2/2.0 (-1) | 951 (-15%) | 2mo | $249,900 | $263 | 50 |
| 1676 17th Pl SW | 0.55mi | 2/2.0 (-1) | 960 (-14%) | 1mo | $195,000 | $203 | 45 |
Match score weights: distance 35% · size 25% · config 20% · recency 20%. Top-matched comps best support the ARV.
Projected returns pro-forma
-3.0% appreciation · 4.18% rent growth · sell at horizon
- IRR
- -9.5%
- Equity multiple
- 0.65×
- Total profit
- $-27,152
- Equity at exit
- $41,003
- IRR
- 1.2%
- Equity multiple
- 1.09×
- Total profit
- $6,638
- Equity at exit
- $23,777
Cash invested: $77,000 (down + closing). Projections, not guarantees.
Landlord ↔ Tenant lean methodology
- Overall (STATE)
- 87 Strongly Landlord-Friendly
- State Florida
- 87 Strongly Landlord-Friendly · R+3
- County
- — inherits STATE
- City
- — inherits STATE
ZIP-level market 32962
- Rents YoY
- 4.2%
- Active inventory
- 348
- Price-to-rent
- 9.7×
Monthly cashflow live
- Estimated rent
- $2,351 high interval (Pro) →
- Mortgage (P&I)
- −$1,442
- Tax from tax record
- −$69 /mo · $832/yr
- Insurance
- −$115
- HOA
- −$0
- Vacancy / Maint / Mgmt
- −$494
- Net cashflow
- $231
Break-even live
UW: 25.0% down · 7.5% · 30yr · 1.5% tax · 5.0% vac · 8.0% maint · 8.0% mgmt
Financing live
Cash to close
- Down payment
- $68,750
- Closing costs
- $8,250
- Reserves months
- —
- Total cash needed
- —
Loan-product check · same deal, 3 products live
Conventional
25% down · 7.5% · 30yr
- Down + closing
- —
- Monthly P&I
- —
- Monthly cashflow
- —
- DSCR
- —
- Eligible?
- —
Personal DTI + credit; lowest rate.
DSCR
20% down · 8.5% · 30yr
- Down + closing
- —
- Monthly P&I
- —
- Monthly cashflow
- —
- DSCR
- —
- Eligible?
- —
No personal income docs; deal must DSCR.
Hard money
10% down · 12.0% · 12mo
- Down + closing
- —
- Monthly P&I
- —
- Monthly cashflow
- —
- DSCR
- —
- Eligible?
- —
Short-term bridge; refi at stabilization.
Rent comps 6 comps
| Address | Beds | Baths | Sqft | Rent | $/sqft | DOM | Units | Dist |
|---|---|---|---|---|---|---|---|---|
| 2565 Langrove Ln SW Vero Beach, FL | 3.0 | 2.0 | 1464 | $2,000 | $1.37 | 21d | 1 | 0.81mi |
| 826 Middleton Dr SW Vero Beach, FL | 3.0 | 2.0 | 1464 | $2,150 | $1.47 | 21d | 1 | 0.84mi |
| 2619 Langrove Ln SW Unit 2619 Vero Beach, FL | 3.0 | 2.0 | 1464 | $2,450 | $1.67 | 21d | 1 | 0.85mi |
| 2543 Stockbridge Sq SW Vero Beach, FL | 3.0 | 2.0 | 1464 | $2,200 | $1.50 | 13d | 1 | 0.96mi |
| 1123 37th Ave SW Unit 1541760P Vero Beach, FL | 3.0 | 2.0 | 1248 | $3,075 | $2.46 | 13d | 1 | 1.03mi |
| 985 23rd Pl SW Vero Beach, FL | 3.0 | 2.0 | 1176 | $2,200 | $1.87 | 21d | 1 | 1.47mi |
Listing history 22 events
-
2026-06-19days on market $275,000 Active 228 DOM
-
2026-06-18days on market $275,000 Active 227 DOM
-
2026-06-17days on market $275,000 Active 226 DOM
-
2026-06-16days on market $275,000 Active 225 DOM
-
2026-06-15days on market $275,000 Active 224 DOM
-
2026-06-14days on market $275,000 Active 222 DOM
-
2026-06-13days on market $275,000 Active 221 DOM
-
2026-06-10days on market $275,000 Active 219 DOM
-
2026-06-09days on market $275,000 Active 218 DOM
-
2026-06-08days on market $275,000 Active 217 DOM
-
2026-06-07days on market $275,000 Active 216 DOM
-
2026-06-05days on market $275,000 Active 213 DOM
-
2026-06-02days on market $275,000 Active 211 DOM
-
2026-06-01days on market $275,000 Active 210 DOM
-
2026-05-31days on market $275,000 Active 209 DOM
-
2026-05-30days on market $275,000 Active 208 DOM
-
2026-01-19status Active
-
2025-12-18historical Active Under Contract
-
2025-10-29$275,000 Active
-
2010-10-29soldstatus $48,900 202-char remark
Show marketing remark (202 chars)
LARGE 2/2 WITH DEN, MOVE RIGHT IN. THIS IS A FANNIE MAE HOMEPATH PROPERTY. CLOSE BY 12/31/10 AND RECEIVE UP TO 3.5% CLOSING COST ASSISTANCE AND $1500 SELLING BROKER BONUS. ELIGIBILITY RESTRICTIONS APPLY
-
2005-03-18soldstatus $25,000
-
2005-02-16soldstatus $17,500
ⓘ Source: listings_history table (triggers on properties + properties_extension) + one-shot
backfill from property_details.listing_events for pre-trigger history.
Tax reassessment forecast FL · Resets to sale price
- Current annual tax
- $832 · $69/mo
- Projected year-2 tax
- $2,282 · $190/mo
- Expected delta
- +$1,451/yr (+$121/mo · 174.4%)
ⓘ Screening estimate from a state-policy table — verify with the county assessor before closing.
Climate risk First Street
- Flood 1/10 Low FEMA zone X (unshaded) · 0% chance over 30 yrs
- Wildfire 3/10 Moderate
- Heat 10/10 Extreme 7 d/yr ≥106°F today · 24 d/yr by 30 yrs out
- Wind 10/10 Extreme 99% chance of damaging wind over 30 yrs
- Air quality 1/10 Low 0 unhealthy d/yr today · 0 by 30 yrs out
Nearby sold comps map
Loading sold comps map…
Walkable amenities ~0.75 mi
Loading nearby amenities…
Taxation est. · year 1
- Rental income
- $28,210
- − Mortgage interest
- −$15,404
- − Property taxes
- −$832
- − Insurance
- −$1,375
- − Repairs & maintenance
- −$2,257
- − Management
- −$2,257
- − Depreciation
- −$8,000
- Taxable loss
- −$1,915
- Est. tax savings @ 24.0%
- +$460
- After-tax cash flow
- $3,233/yr
For passive investors: Depreciation is non-cash, so a rental often shows a tax loss while cash-flowing — sheltering income. Rental losses are passive: they offset passive income freely, and up to $25,000/yr can offset ordinary (W-2) income if you actively participate and your MAGI is under $100k (phasing out to $0 by $150k); unused losses carry forward. On sale, claimed depreciation is recaptured at up to 25%, and gains may owe capital-gains tax (a 1031 exchange can defer both). Figures are a year-1 estimate at your 24.0% rate — not tax advice; consult a CPA.
Schools (NCES district)
- District
- Indian River
- NCES district ID
- 1200930
- Math proficiency
- 48% ▼ -9.00%
- Reading proficiency
- 52% ▼ -3.00%
- Median HH income
- $46,597
- Composite
- 42.45/100
- National rank
- #3218
- State rank
- #35 of 73 in FL
Livability — Florida Ridge
- Score
- 72/100
- State rank
- #353
- US rank
- #6129
Category grades
Schools grade is shown separately in the Schools card above.
Census & demographics
- Census place
- Florida Ridge, FL
- County
- Indian River County · 143,738 people
- City population
- 25,629
- Metro
- Sebastian-Vero Beach, FL
- Population (ZIP)
- 25,522
- Household income
- $66,664
- Rent vs Own
- Severe rent burden
- 425.0
Population outlook (Indian River County) Hauer SSP2
- Today (2025)
- 165,104 people
- By 2030
- 172,869 · +4.7%
- By 2040
- 185,640 · +12.4%
- By 2050
- 194,465 · +17.8%
- By 2075
- 211,115 · +27.9%
- By 2100
- 211,781 · +28.3%
Race, ethnicity, and origin ACS 2023
- Neighborhood character
- Predominantly White (70%)
- Race & ethnicity
- White 70% Black 13% Hispanic / Latino 12% Two or more races 5% Native American 1%
- Hispanic origin (detail)
- Mexican 1% Puerto Rican 2% Cuban 1%
- Common ancestry
- Romanian 4% Lithuanian 4% Italian 3%
- Foreign-born
- 12% · Canada, Jamaica, Dominican Republic
- Languages at home
- 85% English-only · Spanish 9% Other Indo-European 2% French/Haitian/Cajun 1%
Political lean MEDSL · Indian River
- 2024 margin
- Strong R (+27.4) · D 36.0% · R 63.4%
- 2008→2024 swing
- -12.5pp toward R · 2008: -14.8pp · 2024: -27.4pp
- All cycles
- 2024: R+27.4 2020: R+21.6 2016: R+24.5 2012: R+22.3 2008: R+14.8
Not yet ingested
- Civics
- —
Market trends
- HPI YoY
- ▼ -182.13%
- Current HPI
- 333.3274
- Rent YoY
- ▲ 4.18%
- Metro
- Sebastian-Vero Beach, FL
- State GDP YoY
- ▲ 3.28%
- F500 in state
- 36
Industry mix (Fortune 500 HQ in FL)
| Industry | F500 HQs | Revenue |
|---|---|---|
| Industrial Technology | 2 | $29B |
|
||
| Insurance | 2 | $17B |
|
||
| Retail | 1 | $60B |
|
||
| Technology Distribution | 1 | $58B |
|
||
| Homebuilding | 1 | $35B |
|
||
| Technology Manufacturing | 1 | $35B |
|
||
Price history
+1471.4% since first listed6 events — show timeline
- 2026-01-19 Relisted — MARMLS
- 2025-12-18 Contingent — MARMLS
- 2025-10-29 Listed $275,000 MARMLS
- 2010-10-29 Sold (MLS) $48,900 RAIRCMLS
- 2005-03-18 Sold (Public Records) $25,000 Public Records
- 2005-02-16 Sold (Public Records) $17,500 Public Records
Property tax history
+5.6%/yrLatest (2025): $832 · +38.4% YoY. Source: county tax records.
Cash-flow waterfall
monthlySold comps — $/sqft
last 12 mo · ≤1 miLoading sold comps…