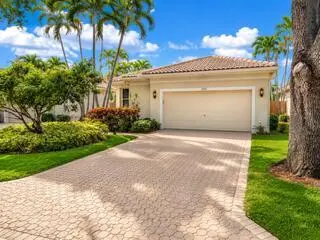
2409 NW 66th Dr · Boca Raton, FL
Flood risk 1/10 · Minimal
- FEMA flood zone
- X (unshaded)
- Chance of flooding over 30 yrs
- 0.0%
- Est. flood insurance / yr
- $507 – $1,088
Fire risk 1/10 · Minimal
- Est. fire insurance / yr
- $947 – $1,759
Heat risk 9/10 · Severe
- Hot days now (above 106°F)
- 7 days/yr
- Hot days in 30 yrs
- 26 days/yr
Wind risk 10/10 · Severe
- Chance of severe wind over 30 yrs
- 99.0%
Air-quality risk 3/10 · Minor
- Unhealthy air days now
- 2 days/yr
- Unhealthy air days in 30 yrs
- 3 days/yr
Risk factors via First Street. Map © Google.
Why this score? — see what drove the A grade
The composite is a weighted blend of 9 inputs, each scored 0–100. Each bar is that input's sub-score; the figure is the points it added to the 100-point composite (weight × sub-score).
- Cash flow +29.9/30.0
- ARV discount +15.0/15.0
- DSCR +10.0/10.0
- Appreciation +10.0/10.0
- 1% rule +9.5/10.0
- Schools +4.3/10.0
- Livability +3.9/5.0
- Rent growth +3.1/5.0
- Condition / age +2.5/5.0
$555,000
🖨 Deal sheet 📄 Offer letter ✓ Due diligence
Listing remarks
Banyans at Broken Sound is one of Boca's most prestigious private member-owned communities. It features a state-of-the-art fitness center, Olympic swimming pool and resort style pool, tennis courts, pickleball, luxurious spa. Social activities such as club holiday celebrations, fitness classes, and community two championship golf courses. lifestyle at Banyans Broken Sound is tailored for those seeking an active, upscale, and socially engaging environment, making it ideal for individuals and families who value both leisure and luxury. The home offers new master shower, newer appliances, 2 year Trane A/C system, 2 year instant hot water heater, 2 year ultra quiet wall mount garage motor, cen
Key facts
- New master shower
- Resort style pool
- Pickleball
Tags
Property features AI
Finance
- Other: Pets allowed (restrictions possible)
- HOA & community: Community: Broken Sound Club; Monthly HOA fee of $604; HOA covers cable TV, internet, security, and recreation facilities; Community amenities include pool(s), heated pool, sauna, spa/hot tub, tennis courts, pickleball courts, cafe/restaurant, and community room
Exterior
- Parking: Total parking for 6 vehicles; Attached 2-car garage; 2 covered parking spaces; Paver block driveway
- Utilities: Public water; Public sewer; Cable available
- Home design: Single-family residence; One story; Resale property; Faces south
- Construction: CBS construction; Tile roof; Appraiser-recorded building area (3,011 total; living area 2,247)
- Exterior features: Not waterfront; Entry at level 1
Interior
- Kitchen: Disposal; Dishwasher; Electric range; Refrigerator
- Bedrooms: One main-level bedroom
- Flooring: Tile flooring
- Bathrooms: Two full bathrooms and one half bathroom; One bathroom on the main level
- Heating & cooling: Central heating; Central air conditioning
- Interior features: High ceilings; Walk-in closet(s)
Neighborhood map
What this means for you Summary
Snapshot
- This is a 3-bed/2.5-bath single-family listed at $555k.
Deal economics
- At list price, monthly cash flow is $2k ($25k/yr) — positive.
- The deal already cash-flows at list — no discount required.
- Meets the 1% rule at list price ($8k rent vs $555k).
- Recommended offer: $538k (3.0% below list) — sets the bar for market timing.
Location & tenants
- Location reads 77/100 on livability (#192 in FL, #3,070 nationally) — a middle-class / working-renter tenant base. Strengths: employment A+, health & safety A+, crime B+; Watch: amenities D, cost of living F.
- Palm Beach (suburban): math 46% / reading 53% proficiency, ranked #34 of 73 in FL (top 47%) — families likely to look elsewhere, expect single-tenant / working-renter base with shorter leases.
- Zoned schools: Calusa Elementary School (math 83% / reading 85%, grade A+, #55 of 2,144 statewide, top 3%, 867 students, 17% FRL); Omni Middle School (math 66% / reading 66%, grade A-, #93 of 571 statewide, top 16%, 1,128 students, 29% FRL); Spanish River Community High School (math 64% / reading 74%, grade B, #63 of 667 statewide, top 10%, 2,578 students, 25% FRL) — zoned schools average 24% FRL vs 52% district-wide (28 pts lower); this property's tenant base skews higher-income than the district average.
- Zoned-school proficiency averages 73% at this address vs 50% district-wide (+24 pts) — the actual schools serving this property are materially stronger than the Palm Beach average implies; a family-tenant draw the district grade alone would hide.
- Market conditions: Rents rising (+2.3%/yr); 324 active listings in the ZIP; 24 comparable units currently listed for rent nearby; rentals at typical pace (median 24d on market — plan ~3-4 weeks tenant-placement turnaround); high-income renter base; 3,974 units permitted in Palm Beach County in 2024 (1,012 in 5+ unit buildings).
Forward outlook
- In year one you build about $59k of equity ($4k loan paydown + $56k appreciation (10.0% local appreciation)).
- Palm Beach County population projected at +30% by 2050 — long-run rental-demand tailwind backs the buy-and-hold thesis.
- At projected returns (10.0% appreciation + 2.3% rent growth), your $155k cash investment doubles in ~2 years — after that, you're playing with house money.
- By year 2, paydown + projected appreciation supports a ~$95k cash-out refi (75% LTV) — recoverable capital for the next deal without selling this one.
Negotiation context
- It's been on market 31 days — a 3% lower offer ($538k) is reasonable based on typical stale-listing flexibility.
- 6 sale attempts since 8y ago with the ask held roughly flat each time — persistent listings suggest the price (not the market) is what's stuck; bring a comps-based counter.
- Current owner paid $400k; 39% above their basis — modest negotiation headroom, anchor on the comps not their cost.
Risks & watch-outs
- Climate carrying-cost: severe wind risk, 99% chance of damaging wind over 30y; extreme-heat days projected 7→26/yr by 2055 (HVAC capex compounding) — expect insurance premiums to compound above CPI over the hold.
Questions for the listing agent
- It's been on market 31 days. Have you received any prior offers? Is the seller open to a 3% concession, seller financing, or rate buy-down credit?
- What does the HOA fee cover, when was the last increase, and are there any pending special assessments or reserve-fund shortfalls?
- Is there a deadline driving the sale (1031 exchange, divorce, estate, relocation)? That informs how much negotiation room exists.
- Schools are A-rated — typically a magnet for longer-tenancy family renters. What's the average tenant stay here, and is there a school-zone premium baked into asking?
- What's the average days-on-market for RENTAL listings here right now (not sales)? A rising rental-DOM trend means longer vacancies and softer asking-rent achievability than the comps imply.
- What's the recent tenant-quality profile in this submarket — average credit score on applications, eviction rate, late-payment / NSF rate, and stable-employment percentage? A property-management company in the area should have these aggregated.
- How much new for-sale + rental construction is in the pipeline within 1–3 miles? Heavy new supply typically softens prices + rents 12–24 months out; constrained supply supports both.
Investment metrics
- 1% rule
- 1.45% ✓
- Cap rate
- 10.75%
- Cash-on-cash
- 15.93%
- DSCR
- 1.71
- GRM
- 5.7
CMA / ARV
- ARV (on-the-fly)
- $853,860
- Comps found
- 3
Show comp detail 3 sales within ~0.75 mi
| Address | Dist | Beds/Ba | Sqft | Sold | Price | $/sf | Match |
|---|---|---|---|---|---|---|---|
| 2492 NW 66th Dr | 0.27mi | 3/2.5 | 2,343 (+4%) | 2mo | $830,000 | $354 | 79 |
| 5890 NW 21st Ave | 0.72mi | 3/2.5 | 2,319 (+3%) | 1mo | $899,000 | $388 | 60 |
| 2187 NW 59th St | 0.63mi | 3/2.5 | 2,104 (-6%) | 2mo | $800,000 | $380 | 58 |
Match score weights: distance 35% · size 25% · config 20% · recency 20%. Top-matched comps best support the ARV.
Projected returns pro-forma
10.0% appreciation · 2.31% rent growth · sell at horizon
- IRR
- 35.7%
- Equity multiple
- 3.76×
- Total profit
- $428,519
- Equity at exit
- $499,988
- IRR
- 30.5%
- Equity multiple
- 8.39×
- Total profit
- $1,148,442
- Equity at exit
- $1,078,243
Cash invested: $155,400 (down + closing). Projections, not guarantees.
Landlord ↔ Tenant lean methodology
- Overall (STATE)
- 87 Strongly Landlord-Friendly
- State Florida
- 87 Strongly Landlord-Friendly · R+3
- County
- — inherits STATE
- City
- — inherits STATE
ZIP-level market 33496
- Home prices YoY
- 3.5%
- Rents YoY
- 2.3%
- Active inventory
- 324
- Price-to-rent
- 5.7×
Monthly cashflow live
- Estimated rent
- $8,051 high interval (Pro) →
- Mortgage (P&I)
- −$2,910
- Tax from tax record
- −$551 /mo · $6,614/yr
- Insurance
- −$231
- HOA
- −$604
- Vacancy / Maint / Mgmt
- −$1,691
- Net cashflow
- $2,063
Break-even live
UW: 25.0% down · 7.5% · 30yr · 1.5% tax · 5.0% vac · 8.0% maint · 8.0% mgmt
Financing live
Cash to close
- Down payment
- $138,750
- Closing costs
- $16,650
- Reserves months
- —
- Total cash needed
- —
Loan-product check · same deal, 3 products live
Conventional
25% down · 7.5% · 30yr
- Down + closing
- —
- Monthly P&I
- —
- Monthly cashflow
- —
- DSCR
- —
- Eligible?
- —
Personal DTI + credit; lowest rate.
DSCR
20% down · 8.5% · 30yr
- Down + closing
- —
- Monthly P&I
- —
- Monthly cashflow
- —
- DSCR
- —
- Eligible?
- —
No personal income docs; deal must DSCR.
Hard money
10% down · 12.0% · 12mo
- Down + closing
- —
- Monthly P&I
- —
- Monthly cashflow
- —
- DSCR
- —
- Eligible?
- —
Short-term bridge; refi at stabilization.
Rent comps 24 comps
| Address | Beds | Baths | Sqft | Rent | $/sqft | DOM | Units | Dist |
|---|---|---|---|---|---|---|---|---|
| 2464 NW 66th Dr Boca Raton, FL | 3.0 | 3.5 | 2568 | $10,000 | $3.89 | 24d | 1 | 0.17mi |
| 2485 NW 66th Dr Boca Raton, FL | 3.0 | 2.5 | 2472 | $9,500 | $3.84 | 24d | 1 | 0.25mi |
| 2485 NW 66th Dr Boca Raton, FL | 3.0 | 2.5 | 2472 | $9,500 | $3.84 | 10d | 1 | 0.25mi |
| 5801 NW 24th Ave #1001 Boca Raton, FL | 3.0 | 2.5 | 1957 | $13,000 | $6.64 | 16d | 1 | 0.45mi |
| 6213 NW 21st Ct Boca Raton, FL | 3.0 | 4.0 | 2746 | $10,000 | $3.64 | 24d | 1 | 0.45mi |
| 2431 NW 59th St #404 Boca Raton, FL | 3.0 | 2.5 | 1957 | $10,000 | $5.11 | 24d | 1 | 0.57mi |
| 6503 N Military Trl Boca Raton, FL | 1.0–2.0 | 1.0–2.0 | 1155 | $3,211 | $2.78 | 1d | 52 | 0.70mi |
| 3151 Clint Moore Rd #103 Boca Raton, FL | 3.0 | 2.0 | 1497 | $3,145 | $2.10 | 24d | 1 | 0.85mi |
| 2237 NW 53rd St Boca Raton, FL | 3.0 | 3.5 | 2305 | $25,000 | $10.85 | 24d | 1 | 0.91mi |
| 5555 N Military Trl Boca Raton, FL | 2.0–3.0 | 2.0–3.0 | 1282 | $5,069 | $3.95 | 1d | 21 | 0.91mi |
| 3143 Clint Moore Rd #105 Boca Raton, FL | 3.0 | 2.0 | 1497 | $3,250 | $2.17 | 24d | 1 | 0.94mi |
| 2218 NW 52nd St Boca Raton, FL | 2.0 | 2.5 | 1482 | $13,000 | $8.77 | 24d | 1 | 0.98mi |
| 2093 NW 52nd St Unit 2093 Boca Raton, FL | 3.0 | 2.5 | 1835 | $13,000 | $7.08 | 24d | 1 | 1.00mi |
| 2011 NW 53rd St Boca Raton, FL | 3.0 | 2.5 | 2461 | $11,000 | $4.47 | 12d | 1 | 1.05mi |
| 2034 NW 52nd St Boca Raton, FL | 2.0 | 2.5 | 1527 | $12,000 | $7.86 | 24d | 1 | 1.06mi |
| 5500 N Military Trl Boca Raton, FL | 1.0–3.0 | 1.0–2.0 | 1053 | $5,719 | $5.43 | 3d | 27 | 1.09mi |
| 2771 NW 49th St Boca Raton, FL | 4.0 | 3.0 | 2596 | $6,195 | $2.39 | 17d | 1 | 1.12mi |
| 4695 Brandywine Dr Boca Raton, FL | 3.0 | 3.0 | 1974 | $4,750 | $2.41 | 24d | 1 | 1.12mi |
| 17099 Ryton Ln Boca Raton, FL | 3.0 | 2.5 | 2492 | $18,000 | $7.22 | 24d | 1 | 1.20mi |
| 2683 NW 45th St Boca Raton, FL | 4.0 | 2.5 | 2371 | $6,750 | $2.85 | 5d | 1 | 1.27mi |
| 5605 Forest Oaks Ter Delray Beach, FL | 3.0 | 3.0 | 2092 | $10,000 | $4.78 | 14d | 1 | 1.34mi |
| 17768 Maplewood Dr Boca Raton, FL | 4.0 | 2.0 | 2123 | $5,200 | $2.45 | 22d | 1 | 1.36mi |
| 16843 Boca Delray Dr Delray Beach, FL | 2.0 | 2.0 | 1533 | $4,900 | $3.20 | 22d | 1 | 1.39mi |
| 16850 Colchester Ct Delray Beach, FL | 3.0 | 3.5 | 2715 | $8,000 | $2.95 | 18d | 1 | 1.43mi |
HOA detail
- Monthly dues
- $604 · $7,248/yr
- Likely covers
- waterpoolgym
Listing history 29 events
-
2026-06-18days on market $555,000 Active 31 DOM
-
2026-06-17days on market $555,000 Active 30 DOM
-
2026-06-16days on market $555,000 Active 29 DOM
-
2026-06-15days on market $555,000 Active 28 DOM
-
2026-06-13days on market $555,000 Active 26 DOM
-
2026-06-09days on market $555,000 Active 22 DOM
-
2026-06-08days on market $555,000 Active 21 DOM
-
2026-06-07days on market $555,000 Active 20 DOM
-
2026-06-04days on market $555,000 Active 17 DOM
-
2026-06-03days on market $555,000 Active 16 DOM
-
2026-06-02days on market $555,000 Active 15 DOM
-
2026-06-01days on market $555,000 Active 14 DOM
-
2026-05-31days on market $555,000 Active 13 DOM
-
2026-05-18$555,000 Active
-
2026-04-30historical
-
2026-04-05price $559,850
-
2026-03-05price $625,000
-
2026-03-05status Active
-
2026-01-31status Pending
-
2026-01-08$579,900 Active
-
2026-01-05historical
-
2025-09-18historical
-
2025-09-17$569,000 Active
-
2022-04-28soldstatus $400,000
-
2019-04-22historical
-
2019-03-20$275,000 Active
-
2018-11-09historical
-
2018-10-16$275,000 Active
-
1996-09-12soldstatus $273,000
ⓘ Source: listings_history table (triggers on properties + properties_extension) + one-shot
backfill from property_details.listing_events for pre-trigger history.
Tax reassessment forecast FL · Resets to sale price
- Current annual tax
- $6,614 · $551/mo
- Projected year-2 tax
- $6,614 · $551/mo
- Expected delta
- $0/yr ($0/mo · 0.0%)
ⓘ Screening estimate from a state-policy table — verify with the county assessor before closing.
Climate risk First Street
- Flood 1/10 Low FEMA zone X (unshaded) · 0% chance over 30 yrs
- Wildfire 1/10 Low
- Heat 9/10 Extreme 7 d/yr ≥106°F today · 26 d/yr by 30 yrs out
- Wind 10/10 Extreme 99% chance of damaging wind over 30 yrs
- Air quality 3/10 Moderate 2 unhealthy d/yr today · 3 by 30 yrs out
Nearby sold comps map
Loading sold comps map…
Walkable amenities ~0.75 mi
Loading nearby amenities…
Taxation est. · year 1
- Rental income
- $96,606
- − Mortgage interest
- −$31,089
- − Property taxes
- −$6,614
- − Insurance
- −$2,775
- − Repairs & maintenance
- −$7,729
- − Management
- −$7,729
- − HOA
- −$7,248
- − Depreciation
- −$16,145
- Taxable income
- $17,279
- Est. tax owed @ 24.0%
- −$4,147
- After-tax cash flow
- $20,610/yr
For passive investors: Depreciation is non-cash, so a rental often shows a tax loss while cash-flowing — sheltering income. Rental losses are passive: they offset passive income freely, and up to $25,000/yr can offset ordinary (W-2) income if you actively participate and your MAGI is under $100k (phasing out to $0 by $150k); unused losses carry forward. On sale, claimed depreciation is recaptured at up to 25%, and gains may owe capital-gains tax (a 1031 exchange can defer both). Figures are a year-1 estimate at your 24.0% rate — not tax advice; consult a CPA.
Schools (NCES district)
- District
- Palm Beach
- NCES district ID
- 1201500
- Math proficiency
- 46% ▼ -16.00%
- Reading proficiency
- 53% ▼ -4.00%
- Median HH income
- $53,943
- Composite
- 42.72/100
- National rank
- #3160
- State rank
- #34 of 73 in FL
Livability — Boca Raton
- Score
- 77/100
- State rank
- #192
- US rank
- #3070
Category grades
Schools grade is shown separately in the Schools card above.
Census & demographics
- Census place
- Boca Raton, FL
- County
- Palm Beach County · 1,438,312 people
- City population
- 250,102
- Metro
- Miami-Fort Lauderdale-Pompano Beach, FL
- Population (ZIP)
- 26,579
- Household income
- $114,885
- Rent vs Own
- Severe rent burden
- 464.0
Population outlook (Palm Beach County) Hauer SSP2
- Today (2025)
- 1,637,487 people
- By 2030
- 1,743,255 · +6.5%
- By 2040
- 1,948,712 · +19.0%
- By 2050
- 2,132,979 · +30.3%
- By 2075
- 2,530,027 · +54.5%
- By 2100
- 2,706,979 · +65.3%
Race, ethnicity, and origin ACS 2023
- Neighborhood character
- Predominantly White (79%)
- Race & ethnicity
- White 79% Hispanic / Latino 11% Two or more races 8% Asian 5% Black 2%
- Hispanic origin (detail)
- Puerto Rican 3%
- Common ancestry
- Scotch-Irish 13% Romanian 9% Italian 3%
- Foreign-born
- 24% · Canada, Jamaica, Dominican Republic
- Languages at home
- 75% English-only · Spanish 9% Other Indo-European 5% Russian/Polish/Slavic 4%
Political lean MEDSL · Palm Beach
- 2024 margin
- Toss-up / Even · D 50.0% · R 49.2%
- 2008→2024 swing
- -22.1pp toward R · 2008: 22.9pp · 2024: 0.8pp
- All cycles
- 2024: D+0.8 2020: D+12.8 2016: D+15.3 2012: D+17.0 2008: D+22.9
Not yet ingested
- Civics
- —
Market trends
- HPI YoY
- ▲ 10.48%
- Current HPI
- 313.9058
- Rent YoY
- ▲ 2.31%
- Metro
- Miami-Fort Lauderdale-Pompano Beach, FL
- State GDP YoY
- ▲ 3.28%
- F500 in state
- 36
Industry mix (Fortune 500 HQ in FL)
| Industry | F500 HQs | Revenue |
|---|---|---|
| Industrial Technology | 2 | $29B |
|
||
| Insurance | 2 | $17B |
|
||
| Retail | 1 | $60B |
|
||
| Technology Distribution | 1 | $58B |
|
||
| Homebuilding | 1 | $35B |
|
||
| Technology Manufacturing | 1 | $35B |
|
||
Price history
+103.3% since first listed16 events — show timeline
- 2026-05-18 Listed $555,000 Beaches MLS
- 2026-04-30 Listing Removed — Beaches MLS
- 2026-04-05 Price Changed $559,850 Beaches MLS
- 2026-03-05 Price Changed $625,000 Beaches MLS
- 2026-03-05 Relisted — Beaches MLS
- 2026-01-31 Pending — Beaches MLS
- 2026-01-08 Listed $579,900 Beaches MLS
- 2026-01-05 Coming Soon — Beaches MLS
- 2025-09-18 Listing Removed — Beaches MLS
- 2025-09-17 Listed $569,000 Beaches MLS
- 2022-04-28 Sold (Public Records) $400,000 Public Records
- 2019-04-22 Listing Removed — Beaches MLS
- 2019-03-20 Listed $275,000 Beaches MLS
- 2018-11-09 Listing Removed — Beaches MLS
- 2018-10-16 Listed $275,000 Beaches MLS
- 1996-09-12 Sold (Public Records) $273,000 Public Records
Property tax history
+3.2%/yrLatest (2025): $6,614 · +3.0% YoY. Source: county tax records.
Cash-flow waterfall
monthlySold comps — $/sqft
last 12 mo · ≤1 miLoading sold comps…