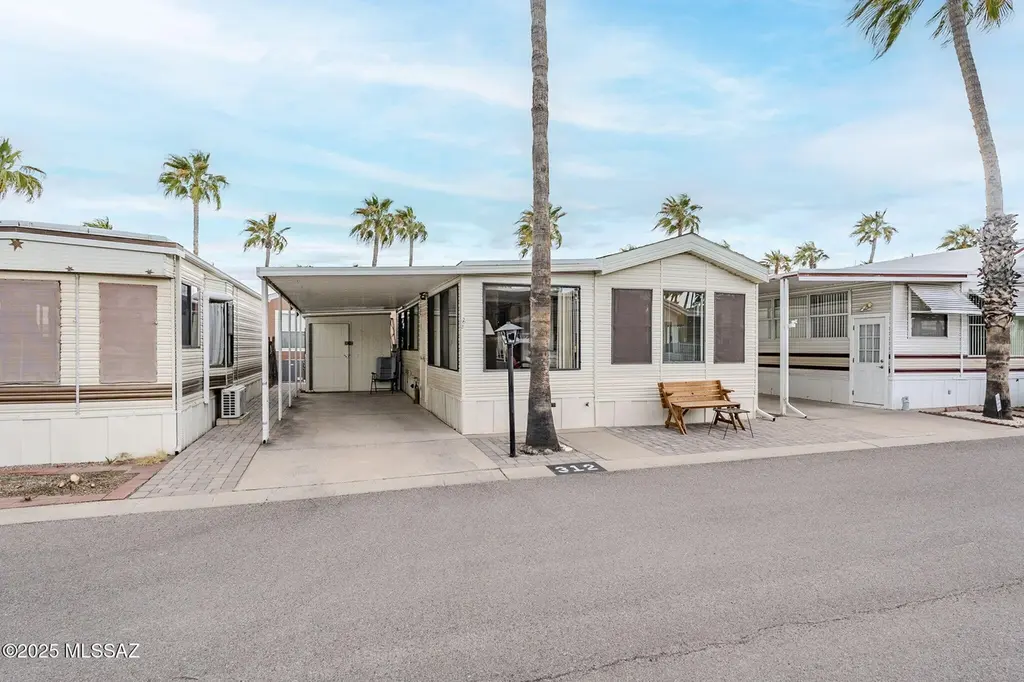
4555 S Mission Rd Unit H312 · Tucson, AZ
Flood risk 1/10 · Minimal
- FEMA flood zone
- X (unshaded)
- Chance of flooding over 30 yrs
- 0.0%
- Est. flood insurance / yr
- $507 – $1,088
Fire risk 10/10 · Severe
- Est. fire insurance / yr
- $610 – $1,132
Heat risk 8/10 · Major
- Hot days now (above 106°F)
- 6 days/yr
- Hot days in 30 yrs
- 17 days/yr
Wind risk 1/10 · Minimal
- Chance of severe wind over 30 yrs
- —
Air-quality risk 1/10 · Minimal
- Unhealthy air days now
- 0 days/yr
- Unhealthy air days in 30 yrs
- 0 days/yr
Risk factors via First Street. Map © Google.
Why this score? — see what drove the C+ grade
The composite is a weighted blend of 9 inputs, each scored 0–100. Each bar is that input's sub-score; the figure is the points it added to the 100-point composite (weight × sub-score).
- Cash flow +30.0/30.0
- 1% rule +10.0/10.0
- DSCR +10.0/10.0
- Condition / age +3.8/5.0
- Livability +3.7/5.0
- ARV discount +2.4/15.0
- Rent growth +2.4/5.0
- Schools +1.6/10.0
- Appreciation +0.0/10.0
$39,900
🖨 Deal sheet 📄 Offer letter ✓ Due diligence
Listing remarks
Ideal opportunity to own a spotless Park Model in the gated, active adult community of Rincon Valley West! Step into this beautifully furnished 2 bedroom, 1.5 bath home that radiates warmth and charm, with an abundance of natural light flooding through every window. The spacious bonus room features a convenient Murphy Bed, offering flexible use as either a second bedroom or home office--perfect for your unique needs. The home is surrounded by a lovely pavered patio, with two cozy spots to relax and enjoy your morning coffee or unwind in the desert evening breeze. Includes a large shed for all your storage needs or hobbies. This extra space offers endless possibilities, whether you're lookin
Key facts
- Gated community
- Heated pools
- Pavered patio
Tags
Property features AI
Finance
- Other: Zoned Tucson - MH1; Irregular lot dimensions; Road maintained by city
- HOA & community: Community pool; Community golf; Tennis courts; Pickleball courts; Shuffleboard; Fitness center; Recreation center; Clubhouse; Park; Pool and spa/hot tub; Laundry facilities; Security; Street maintenance; Common area maintenance; Gated community; Annual association fees; Association fees include water, sewer, street maintenance, common area maintenance
Exterior
- Parking: Covered parking (1 space); 1 carport space
- Security: Wrought iron security door; Security gate; Gated community
- Utilities: Public water; Sewer connected; Phone connected
- Home design: Mobile home; One story; Faces west
- Construction: Metal siding; Metal roof
- Exterior features: Paver patio; Shed; Workshop; Additional carport; East/West exposure; Paved road
Interior
- Kitchen: Refrigerator; Electric cooktop; Electric oven; Microwave; Exhaust fan
- Flooring: Laminate flooring
- Bathrooms: 1 full bath; 1 half bath (2 total bathrooms)
- Heating & cooling: Heat pump heating; Central air conditioning; Ceiling fans; Heat pump cooling
- Interior features: Furnished; Bay windows
Neighborhood map
What this means for you Summary
Snapshot
- This is a 2-bed/1.5-bath manufactured listed at $40k. Condition is rated good.
Deal economics
- At list price, monthly cash flow is $524 ($6k/yr) — positive.
- The deal already cash-flows at list — no discount required.
- Meets the 1% rule at list price ($1k rent vs $40k).
- Recommended offer: $39k (3.0% below list) — sets the bar for market timing.
- Cap rate 22.0% vs local median 3.7% in Tucson — top-decile yield for the area; either an underpriced asset or a hidden risk that comps aren't pricing in. Stress-test before assuming the spread holds.
Location & tenants
- Location reads 74/100 on livability (#17 in AZ, #4,502 nationally) — a middle-class / working-renter tenant base. Strengths: commute A+, cost of living A+, housing A+; Watch: health & safety C-, crime F, employment D-.
- Tucson Unified District (4403) (urban): math 14% / reading 23% proficiency, ranked #190 of 249 in AZ (top 76%) — low school quality limits family demand, transient renter base, plan for 1-2y turnover.
- Zoned schools: Pueblo High School (math 12% / reading 17%, grade F, #267 of 381 statewide, top 72%, 1,831 students, 65% FRL).
- Market conditions: Rents soft (-0.2%/yr); 148 active listings in the ZIP; 8 comparable units currently listed for rent nearby; rentals leasing fast (median 3d on market — plan ~1-2 weeks tenant-placement turnaround); 5,268 units permitted in Pima County in 2024 (996 in 5+ unit buildings).
- This rent is only 18% of the median local income ($69k/yr) — well below the 30% rent-burden line; pricing power to push rent on renewal without tenant pushback.
Forward outlook
- Local home prices are declining (-3.0%/yr); year-one equity from $276 of loan paydown is wiped out by about $1k of value loss. Plan a longer hold.
- Pima County population projected at +8% by 2050 — modest demand growth; plan on rents tracking national, not racing it.
- At projected returns (-3.0% appreciation + 0.0% rent growth), your $11k cash investment doubles in ~3 years — after that, you're playing with house money.
Negotiation context
- It's been on market 43 days — a 3% lower offer ($39k) is reasonable based on typical stale-listing flexibility.
- 3 sale attempts with the ask held roughly flat each time — persistent listings suggest the price (not the market) is what's stuck; bring a comps-based counter.
Risks & watch-outs
- Climate carrying-cost: severe wildfire risk; extreme-heat days projected 6→17/yr by 2055 (HVAC capex compounding) — expect insurance premiums to compound above CPI over the hold.
Questions for the listing agent
- It's been on market 43 days. Have you received any prior offers? Is the seller open to a 3% concession, seller financing, or rate buy-down credit?
- Is there a deadline driving the sale (1031 exchange, divorce, estate, relocation)? That informs how much negotiation room exists.
- Schools are D-rated, which usually means shorter tenancies and higher turnover. Who's the typical renter profile here, and what's been the actual vacancy rate?
- Crime grade is F in this area — have there been break-ins, vandalism, or insurance claims at this property in the last 3 years? What carrier currently insures it and at what premium?
- What's the average days-on-market for RENTAL listings here right now (not sales)? A rising rental-DOM trend means longer vacancies and softer asking-rent achievability than the comps imply.
- What's the recent tenant-quality profile in this submarket — average credit score on applications, eviction rate, late-payment / NSF rate, and stable-employment percentage? A property-management company in the area should have these aggregated.
- How much new for-sale + rental construction is in the pipeline within 1–3 miles? Heavy new supply typically softens prices + rents 12–24 months out; constrained supply supports both.
Investment metrics
- 1% rule
- 2.54% ✓
- Cap rate
- 22.04%
- Cash-on-cash
- 56.23%
- DSCR
- 3.50
- GRM
- 3.3
CMA / ARV
- ARV (on-the-fly)
- $35,840
- Comps found
- 1
Show comp detail 1 sale within ~0.75 mi
| Address | Dist | Beds/Ba | Sqft | Sold | Price | $/sf | Match |
|---|---|---|---|---|---|---|---|
| 4555 S Mission Rd SW Unit J343 | 0.16mi | 1/1.0 (-1) | 568 (-11%) | 14mo | $32,000 | $56 | 55 |
Match score weights: distance 35% · size 25% · config 20% · recency 20%. Top-matched comps best support the ARV.
Projected returns pro-forma
-3.0% appreciation · 0.0% rent growth · sell at horizon
- IRR
- 51.2%
- Equity multiple
- 3.14×
- Total profit
- $23,928
- Equity at exit
- $5,949
- IRR
- 55.3%
- Equity multiple
- 5.69×
- Total profit
- $52,375
- Equity at exit
- $3,450
Cash invested: $11,172 (down + closing). Projections, not guarantees.
Landlord ↔ Tenant lean methodology
- Overall (STATE)
- 87 Strongly Landlord-Friendly
- State Arizona
- 87 Strongly Landlord-Friendly · R+3
- County
- — inherits STATE
- City
- — inherits STATE
ZIP-level market 85746
- Home prices YoY
- -15.2%
- Rents YoY
- -0.2%
- Active inventory
- 148
- Price-to-rent
- 3.3×
Monthly cashflow live
- Estimated rent
- $1,012 high interval (Pro) →
- Mortgage (P&I)
- −$209
- Tax est. 1.5%
- −$50 /mo · $598/yr
- Insurance
- −$17
- HOA
- −$0
- Vacancy / Maint / Mgmt
- −$212
- Net cashflow
- $524
Break-even live
UW: 25.0% down · 7.5% · 30yr · 1.5% tax · 5.0% vac · 8.0% maint · 8.0% mgmt
Financing live
Cash to close
- Down payment
- $9,975
- Closing costs
- $1,197
- Reserves months
- —
- Total cash needed
- —
Loan-product check · same deal, 3 products live
Conventional
25% down · 7.5% · 30yr
- Down + closing
- —
- Monthly P&I
- —
- Monthly cashflow
- —
- DSCR
- —
- Eligible?
- —
Personal DTI + credit; lowest rate.
DSCR
20% down · 8.5% · 30yr
- Down + closing
- —
- Monthly P&I
- —
- Monthly cashflow
- —
- DSCR
- —
- Eligible?
- —
No personal income docs; deal must DSCR.
Hard money
10% down · 12.0% · 12mo
- Down + closing
- —
- Monthly P&I
- —
- Monthly cashflow
- —
- DSCR
- —
- Eligible?
- —
Short-term bridge; refi at stabilization.
Rent comps 8 comps
| Address | Beds | Baths | Sqft | Rent | $/sqft | DOM | Units | Dist |
|---|---|---|---|---|---|---|---|---|
| 1502 W Ajo Way Tucson, AZ | 1.0–2.0 | 1.0 | 713 | $844 | $1.18 | 3d | 4 | 0.83mi |
| 1310 W Ajo Way Tucson, AZ | 1.0 | 1.0 | 410 | $738 | $1.80 | 2d | 5 | 0.93mi |
| 2040 W Nebraska St Tucson, AZ | 1.0 | 1.0 | 700 | $995 | $1.42 | 43d | 1 | 0.95mi |
| 1240 W Ajo Way Tucson, AZ | 2.0 | 1.0 | 530 | $850 | $1.60 | 3d | 7 | 0.97mi |
| 5505 S Mission Rd Tucson, AZ | 1.0–4.0 | 1.0–2.0 | 949 | $1,167 | $1.23 | 1d | 29 | 1.20mi |
| 5600 S Midvale Park Rd Tucson, AZ | 1.0–3.0 | 1.0–2.0 | 787 | $1,012 | $1.29 | 1d | 12 | 1.22mi |
| 851 W Ajo Way Tucson, AZ | 1.0 | 1.0 | 500 | $695 | $1.39 | 21d | 1 | 1.29mi |
| 4904 S 13th Ave Tucson, AZ | 2.0 | 1.0 | 750 | $895 | $1.19 | 3d | 1 | 1.32mi |
Listing history 21 events
-
2026-06-18days on market $39,900 Active 43 DOM
-
2026-06-17days on market $39,900 Active 42 DOM
-
2026-06-16days on market $39,900 Active 41 DOM
-
2026-06-15days on market $39,900 Active 40 DOM
-
2026-06-13days on market $39,900 Active 38 DOM
-
2026-06-10days on market $39,900 Active 35 DOM
-
2026-06-09days on market $39,900 Active 34 DOM
-
2026-06-08days on market $39,900 Active 33 DOM
-
2026-06-07days on market $39,900 Active 32 DOM
-
2026-06-05days on market $39,900 Active 29 DOM
-
2026-06-03days on market $39,900 Active 28 DOM
-
2026-06-02days on market $39,900 Active 27 DOM
-
2026-06-01days on market $39,900 Active 26 DOM
-
2026-05-31days on market $39,900 Active 25 DOM
-
2026-05-06$39,900 Active 1416-char remark
-
2026-05-02historical
-
2026-01-25price $39,900
-
2025-08-02price $49,900
-
2025-04-16historical
-
2025-04-15$55,000 Active
-
2025-03-07$55,000 Active
ⓘ Source: listings_history table (triggers on properties + properties_extension) + one-shot
backfill from property_details.listing_events for pre-trigger history.
Climate risk First Street
- Flood 1/10 Low FEMA zone X (unshaded) · 0% chance over 30 yrs
- Wildfire 10/10 Extreme
- Heat 8/10 Severe 6 d/yr ≥106°F today · 17 d/yr by 30 yrs out
- Wind 1/10 Low
- Air quality 1/10 Low 0 unhealthy d/yr today · 0 by 30 yrs out
Nearby sold comps map
Loading sold comps map…
Walkable amenities ~0.75 mi
Loading nearby amenities…
Taxation est. · year 1
- Rental income
- $12,141
- − Mortgage interest
- −$2,235
- − Property taxes
- −$598
- − Insurance
- −$200
- − Repairs & maintenance
- −$971
- − Management
- −$971
- − Depreciation
- −$1,161
- Taxable income
- $6,004
- Est. tax owed @ 24.0%
- −$1,441
- After-tax cash flow
- $4,841/yr
For passive investors: Depreciation is non-cash, so a rental often shows a tax loss while cash-flowing — sheltering income. Rental losses are passive: they offset passive income freely, and up to $25,000/yr can offset ordinary (W-2) income if you actively participate and your MAGI is under $100k (phasing out to $0 by $150k); unused losses carry forward. On sale, claimed depreciation is recaptured at up to 25%, and gains may owe capital-gains tax (a 1031 exchange can defer both). Figures are a year-1 estimate at your 24.0% rate — not tax advice; consult a CPA.
Condition & rehab AI · 12 photos
This well-maintained mobile home in Rincon Valley West is move-in ready with good condition and minimal repairs needed.
Value-add opportunities
- Both Paint exterior siding — Enhances curb appeal and value
- Both Clean windows — Improves natural light and overall appearance
- Resale Replace outdated kitchen appliances — Modernizes the kitchen and adds value
- Resale Install new flooring in bathrooms — Enhances the overall aesthetic and value
Renovation cost estimate screening
Value-add ROI direction
- Both Paint exterior siding — Enhances curb appeal and value ↑
- Both Clean windows — Improves natural light and overall appearance ↑
- Resale Replace outdated kitchen appliances — Modernizes the kitchen and adds value ↑
- Resale Install new flooring in bathrooms — Enhances the overall aesthetic and value ↑
ⓘ Cost ranges are severity-bucket heuristics (US national rule-of-thumb). Get contractor quotes + a written scope before underwriting a rehab budget.
Schools (NCES district)
- District
- Tucson Unified District (4403)
- NCES district ID
- 0408800
- Math proficiency
- 14% ▼ -17.00%
- Reading proficiency
- 23% ▼ -11.00%
- Median HH income
- $40,962
- Composite
- 15.78/100
- National rank
- #9270
- State rank
- #190 of 249 in AZ
Livability — Tucson
- Score
- 74/100
- State rank
- #17
- US rank
- #4502
Category grades
Schools grade is shown separately in the Schools card above.
Census & demographics
- Census place
- Tucson, AZ
- County
- Pima County · 1,012,107 people
- City population
- 839,336
- Metro
- Tucson, AZ
- Population (ZIP)
- 42,835
- Household income
- $68,903
- Rent vs Own
- Severe rent burden
- 1050.0
Population outlook (Pima County) Hauer SSP2
- Today (2025)
- 1,066,056 people
- By 2030
- 1,086,684 · +1.9%
- By 2040
- 1,117,160 · +4.8%
- By 2050
- 1,149,778 · +7.9%
- By 2075
- 1,271,480 · +19.3%
- By 2100
- 1,321,160 · +23.9%
Race, ethnicity, and origin ACS 2023
- Neighborhood character
- Predominantly Hispanic (72%)
- Race & ethnicity
- Hispanic / Latino 72% White 20% Two or more races 16% Native American 6% Black 2% Asian 1%
- Hispanic origin (detail)
- Mexican 68% Puerto Rican 1%
- Common ancestry
- Serbian 1% Lithuanian 1% Slovak 1%
- Foreign-born
- 16% · Canada
- Languages at home
- 52% English-only · Spanish 46%
Political lean MEDSL · Pima
- 2024 margin
- D (+15.2) · D 57.0% · R 41.8% · Other 1.2%
- 2008→2024 swing
- +9.1pp toward D · 2008: 6.1pp · 2024: 15.2pp
- All cycles
- 2024: D+15.2 2020: D+18.7 2016: D+13.5 2012: D+5.8 2008: D+6.1
Not yet ingested
- Civics
- —
Market trends
- HPI YoY
- ▼ -56.03%
- Current HPI
- 312.2096
- Rent YoY
- ▼ -0.25%
- Metro
- Tucson, AZ
- State GDP YoY
- ▲ 4.54%
- F500 in state
- 20
Industry mix (Fortune 500 HQ in AZ)
| Industry | F500 HQs | Revenue |
|---|---|---|
| Technology | 2 | $13B |
|
||
| Mining / Metals | 1 | $23B |
|
||
| Environmental Services | 1 | $16B |
|
||
| Metals / Steel | 1 | $14B |
|
||
| Technology Distribution | 1 | $9B |
|
||
| Homebuilding | 1 | $8B |
|
||
Price history
-27.5% since first listed7 events — show timeline
- 2026-05-06 Listed $39,900 MLSSAZ
- 2026-05-02 Listing Removed — MLSSAZ
- 2026-01-25 Price Changed $39,900 MLSSAZ
- 2025-08-02 Price Changed $49,900 MLSSAZ
- 2025-04-16 Listing Removed — MLSSAZ
- 2025-04-15 Listed $55,000 MLSSAZ
- 2025-03-07 Listed $55,000 MLSSAZ
Cash-flow waterfall
monthlySold comps — $/sqft
last 12 mo · ≤1 miLoading sold comps…