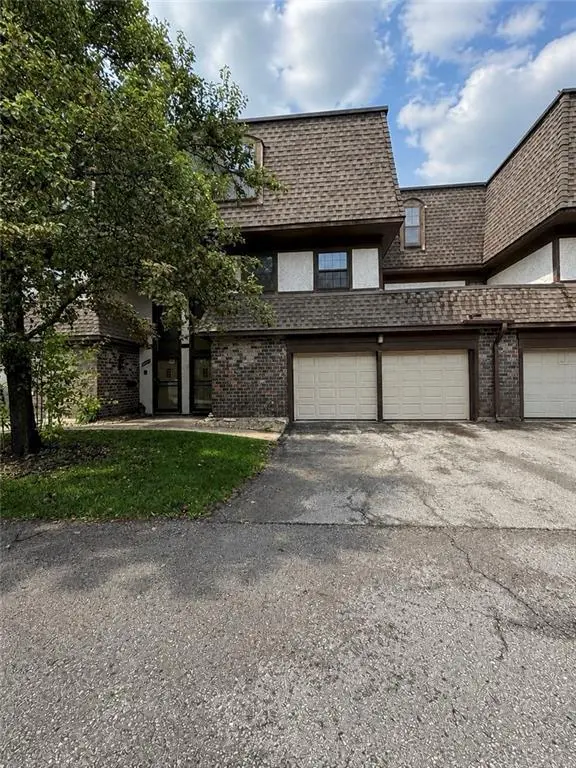
10130 Locust St · Kansas City, MO
Flood risk 1/10 · Minimal
- FEMA flood zone
- X (unshaded)
- Chance of flooding over 30 yrs
- 0.0%
- Est. flood insurance / yr
- $473 – $860
Fire risk 1/10 · Minimal
- Est. fire insurance / yr
- $1,054 – $1,958
Heat risk 4/10 · Minor
- Hot days now (above 107°F)
- 7 days/yr
- Hot days in 30 yrs
- 17 days/yr
Wind risk 2/10 · Minimal
- Chance of severe wind over 30 yrs
- —
Air-quality risk 3/10 · Minor
- Unhealthy air days now
- 3 days/yr
- Unhealthy air days in 30 yrs
- 3 days/yr
Risk factors via First Street. Map © Google.
Why this score? — see what drove the F grade
The composite is a weighted blend of 9 inputs, each scored 0–100. Each bar is that input's sub-score; the figure is the points it added to the 100-point composite (weight × sub-score).
- ARV discount +9.9/15.0
- Cash flow +5.5/30.0
- Livability +3.9/5.0
- Rent growth +3.5/5.0
- 1% rule +2.6/10.0
- Condition / age +2.5/5.0
- Schools +1.8/10.0
- DSCR +0.0/10.0
- Appreciation +0.0/10.0
$240,000
🖨 Deal sheet (PDF) 📄 Offer letter ✓ Due diligence
Listing remarks MLS
Extra Large Townhome with two Large Living Rooms/Family Room, Open Floorplan, four Bedrooms, Formal Dining Room two car garage, two fireplaces, finished lower level with plenty of storage space. Do you love natural light, well this home is for you? Master has two large walk-in BIG closets, bathroom with a jetted tub, separate walk-in shower. The lighting is phenomenal and the open floorplan one of a kind. One of the bedrooms have build-ins that could easily be used as an office. Need a mancave? This townhome has you covered, with the lower level finished basement. Garage space is heated.
Key facts
- $375 HOA
- 2 garage spots
- Community pool
Property features AI
Finance
- Other: Below-grade finished area present
- HOA & community: Cedarbrooke Townhomes HOA; Monthly HOA fee of $375; Community amenities: clubhouse, party room, pool; HOA covers building exterior, roof repair/replace, lawn service, management, snow removal, street maintenance, trash and water
Exterior
- Parking: Attached garage with 2 spaces; Garage door opener; garage faces front
- Security: Security system; Smoke detectors
- Utilities: Public water; Public sewer
- Home design: Attached townhouse; Tri-level design; Living area and finished lower level included
- Construction: Stucco and frame construction; Composition roof
- Exterior features: Patio; Porch; Wood fencing; Property located within city limits
Interior
- Kitchen: Dishwasher; Disposal; Microwave; Refrigerator; Electric range; Breakfast area / eat-in kitchen and formal dining options
- Bedrooms: 4 bedrooms (mostly upper level; one listed as third level)
- Flooring: Carpet; Luxury vinyl
- Bathrooms: 2 full bathrooms; 1 half bathroom
- Heating & cooling: Natural gas heating; Electric cooling (central)
- Interior features: Ceiling fans; Vaulted ceilings; Walk-in closets; Storm windows; Storm doors; Double vanity in bath(s); Tri-level floor plan; Finished full basement
- Laundry & utility: Washer; Dryer; Laundry located on lower level
Neighborhood map
What this means for you Summary
Snapshot
- This is a 3-bed/2.5-bath townhouse listed at $240k.
Deal economics
- At list price, monthly cash flow is $-512 ($-6k/yr) — negative.
- To cash-flow at today's rent, offer at most $149k (37.7% below list).
- To meet the 1% rule (rent ≥ 1% of price), the offer needs to be $182k (24.0% below list).
- Recommended offer: $149k (37.7% below list) — sets the bar for cash-flow.
Location & tenants
- Location reads 78/100 on livability (#28 in MO, #2,671 nationally) — a middle-class / working-renter tenant base. Strengths: amenities A+, commute A+, cost of living A+; Watch: crime F.
- Center 58 (urban): math 12% / reading 29% proficiency, ranked #301 of 324 in MO (top 93%) — low school quality limits family demand, transient renter base, plan for 1-2y turnover; 63% free/reduced lunch — lower-income household profile, screen leases tightly.
- Zoned schools: Indian Creek Elem. (math 12% / reading 17%, grade F, #993 of 1,115 statewide, top 90%, 274 students, 99% FRL); Center Middle (math 7% / reading 28%, grade F, #350 of 391 statewide, top 90%, 560 students, 66% FRL); Center Sr. High (math 5% / reading 37%, grade F, #468 of 521 statewide, top 90%, 742 students, 62% FRL).
- Market conditions: Rents rising (+4.0%/yr); 133 active listings in the ZIP; 6 comparable units currently listed for rent nearby; rentals at typical pace (median 17d on market — plan ~3-4 weeks tenant-placement turnaround); 4,002 units permitted in Jackson County in 2024 (2,271 in 5+ unit buildings).
- This rent runs 34% of the median local income ($64k/yr) — at the standard rent-burdened threshold; future hikes will face affordability resistance.
Forward outlook
- Local home prices are declining (-3.0%/yr); year-one equity from $2k of loan paydown is wiped out by about $7k of value loss. Plan a longer hold.
- Jackson County population projected at +4% by 2050 — modest demand growth; plan on rents tracking national, not racing it.
Negotiation context
- It's been on market 17 days — a 2% lower offer ($236k) is reasonable based on typical stale-listing flexibility.
- 2 sale attempts since 8y ago; this cycle's ask is 30% above the opening price — seller raised mid-cycle; expect resistance to lowballs.
Risks & watch-outs
- Watch-outs: HOA is 21% of rent.
Questions for the listing agent
- What do current leases actually rent for vs. the listed asking? Can we see a recent rent roll and the last 12 months of T-12 income?
- Built in 1972 — when were the roof, HVAC, electrical panel, plumbing, and water heater last replaced?
- What does the HOA fee cover, when was the last increase, and are there any pending special assessments or reserve-fund shortfalls?
- Is there a deadline driving the sale (1031 exchange, divorce, estate, relocation)? That informs how much negotiation room exists.
- Crime grade is F in this area — have there been break-ins, vandalism, or insurance claims at this property in the last 3 years? What carrier currently insures it and at what premium?
- The area grade is low — what's the realistic commute time and amenity access for the typical tenant pool here? Any planned neighborhood developments (good or bad) we should know about?
- What's the average days-on-market for RENTAL listings here right now (not sales)? A rising rental-DOM trend means longer vacancies and softer asking-rent achievability than the comps imply.
- What's the recent tenant-quality profile in this submarket — average credit score on applications, eviction rate, late-payment / NSF rate, and stable-employment percentage? A property-management company in the area should have these aggregated.
- How much new for-sale + rental construction is in the pipeline within 1–3 miles? Heavy new supply typically softens prices + rents 12–24 months out; constrained supply supports both.
Investment metrics
- 1% rule
- 0.76% ✗
- Cap rate
- 3.73%
- Cash-on-cash
- -9.15%
- DSCR
- 0.59
- GRM
- 11.0
CMA / ARV
- ARV (on-the-fly)
- $253,228
- Comps found
- 6
Show comp detail 6 sales within ~0.75 mi
| Address | Dist | Beds/Ba | Sqft | Sold | Price | $/sf | Match |
|---|---|---|---|---|---|---|---|
| 10209 Cedarbrooke Ln | 0.06mi | 3/2.5 | 2,220 (+3%) | 3mo | $249,000 | $112 | 89 |
| 10229 Cedarbrooke Ln | 0.10mi | 3/2.5 | 2,146 (0%) | 13mo | $254,000 | $118 | 85 |
| 10203 Cedarbrooke Ln | 0.04mi | 3/2.5 | 2,432 (+13%) | 4mo | $245,000 | $101 | 72 |
| 10132 Locust St | 0.01mi | 2/2.5 (-1) | 1,890 (-12%) | 3mo | $239,900 | $127 | 72 |
| 10248 Cedarbrooke Ln | 0.09mi | 3/2.5 | 1,859 (-13%) | 4mo | $249,500 | $134 | 70 |
| 10200 Locust St | 0.06mi | 2/2.5 (-1) | 1,960 (-9%) | 19mo | $185,000 | $94 | 62 |
Match score weights: distance 35% · size 25% · config 20% · recency 20%. Top-matched comps best support the ARV.
Projected returns pro-forma
-3.0% appreciation · 3.97% rent growth · sell at horizon
- IRR
- -31.1%
- Equity multiple
- -0.03×
- Total profit
- $-69,521
- Equity at exit
- $35,785
- IRR
- -28.6%
- Equity multiple
- -0.40×
- Total profit
- $-94,190
- Equity at exit
- $20,751
Cash invested: $67,200 (down + closing). Projections, not guarantees.
Landlord ↔ Tenant lean methodology
- Overall (STATE)
- 81 Strongly Landlord-Friendly
- State Missouri
- 81 Strongly Landlord-Friendly · R+10
- County
- — inherits STATE
- City
- — inherits STATE
ZIP-level market 64131
- Rents YoY
- 4.0%
- Active inventory
- 133
- Price-to-rent
- 11.0×
Monthly cashflow live
- Estimated rent
- $1,825 high interval (Pro) →
- Mortgage (P&I)
- −$1,259
- Tax from tax record
- −$220 /mo · $2,643/yr
- Insurance
- −$100
- HOA
- −$375
- Vacancy / Maint / Mgmt
- −$383
- Net cashflow
- $-512
Break-even live
Sensitivity live
| Price | -10% $-377 | -5% $-445 | +0% $-512 | +5% $-580 | +10% $-648 |
|---|---|---|---|---|---|
| Rent | -10% $-657 | -5% $-585 | +0% $-512 | +5% $-440 | +10% $-368 |
| Rate | -1.0pp $-392 | -0.5pp $-451 | base $-512 | +0.5pp $-575 | +1.0pp $-638 |
UW: 25.0% down · 7.5% · 30yr · 1.5% tax · 5.0% vac · 8.0% maint · 8.0% mgmt
Financing live
Cash to close
- Down payment
- $60,000
- Closing costs
- $7,200
- Reserves months
- —
- Total cash needed
- —
Loan-product check · same deal, 3 products live
Conventional
25% down · 7.5% · 30yr
- Down + closing
- —
- Monthly P&I
- —
- Monthly cashflow
- —
- DSCR
- —
- Eligible?
- —
Personal DTI + credit; lowest rate.
DSCR
20% down · 8.5% · 30yr
- Down + closing
- —
- Monthly P&I
- —
- Monthly cashflow
- —
- DSCR
- —
- Eligible?
- —
No personal income docs; deal must DSCR.
Hard money
10% down · 12.0% · 12mo
- Down + closing
- —
- Monthly P&I
- —
- Monthly cashflow
- —
- DSCR
- —
- Eligible?
- —
Short-term bridge; refi at stabilization.
Rent comps 6 comps
| Address | Beds | Baths | Sqft | Rent | $/sqft | DOM | Units | Dist |
|---|---|---|---|---|---|---|---|---|
| 201 W 99th Ter Kansas City, MO | 1.0–2.0 | 1.0–2.5 | 1262 | $1,962 | $1.55 | 3d | 52 | 0.48mi |
| 9615 Holmes Rd Kansas City, MO | 4.0 | 2.0 | 1442 | $2,300 | $1.60 | 16d | 1 | 0.73mi |
| 9706 Wornall Rd Kansas City, MO | 2.0 | 2.5 | 1400 | $1,395 | $1.00 | 19d | 1 | 0.81mi |
| 10601 Jefferson St Kansas City, MO | 1.0–2.0 | 1.0–2.0 | 1090 | $3,886 | $3.57 | 12d | 1 | 0.83mi |
| 1520 E 97th St Kansas City, MO | 1.0–3.0 | 1.0–2.0 | 1163 | $1,595 | $1.37 | 4d | 7 | 1.06mi |
| 9108 Oak St Kansas City, MO | 3.0 | 2.0 | 1966 | $2,295 | $1.17 | 23d | 1 | 1.39mi |
HOA detail
- Monthly dues
- $375 · $4,500/yr
Listing history 13 events
-
2026-06-21days on market $240,000 Active 17 DOM
-
2026-06-18days on market $240,000 Active 14 DOM
-
2026-06-17days on market $240,000 Active 13 DOM
-
2026-06-16days on market $240,000 Active 12 DOM
-
2026-06-15days on market $240,000 Active 11 DOM
-
2026-06-13days on market $240,000 Active 9 DOM
-
2026-06-09days on market $240,000 Active 5 DOM
-
2026-06-08days on market $240,000 Active 4 DOM
-
2026-06-07statusdays on market $240,000 Active 3 DOM
-
2026-06-03days on market $240,000 Coming Soon 5 DOM
-
2026-06-02days on market $240,000 Coming Soon 4 DOM
-
2026-06-01days on market $240,000 Coming Soon 3 DOM
-
2026-05-31days on market $240,000 Coming Soon 2 DOM
ⓘ Source: listings_history table (triggers on properties + properties_extension) + one-shot
backfill from property_details.listing_events for pre-trigger history.
Tax reassessment forecast MO · Resets to sale price
- Current annual tax
- $2,643 · $220/mo
- Projected year-2 tax
- $2,643 · $220/mo
- Expected delta
- $0/yr ($0/mo · 0.0%)
ⓘ Screening estimate from a state-policy table — verify with the county assessor before closing.
Climate risk First Street
- Flood 1/10 Low FEMA zone X (unshaded) · 0% chance over 30 yrs
- Wildfire 1/10 Low
- Heat 4/10 Moderate 7 d/yr ≥107°F today · 17 d/yr by 30 yrs out
- Wind 2/10 Low
- Air quality 3/10 Moderate 3 unhealthy d/yr today · 3 by 30 yrs out
Nearby sold comps map
Loading sold comps map…
Walkable amenities ~0.75 mi
Loading nearby amenities…
Taxation est. · year 1
- Rental income
- $21,894
- − Mortgage interest
- −$13,444
- − Property taxes
- −$2,643
- − Insurance
- −$1,200
- − Repairs & maintenance
- −$1,752
- − Management
- −$1,752
- − HOA
- −$4,500
- − Depreciation
- −$6,982
- Taxable loss
- −$10,377
- Est. tax savings @ 24.0%
- +$2,490
- After-tax cash flow
- $-3,659/yr
For passive investors: Depreciation is non-cash, so a rental often shows a tax loss while cash-flowing — sheltering income. Rental losses are passive: they offset passive income freely, and up to $25,000/yr can offset ordinary (W-2) income if you actively participate and your MAGI is under $100k (phasing out to $0 by $150k); unused losses carry forward. On sale, claimed depreciation is recaptured at up to 25%, and gains may owe capital-gains tax (a 1031 exchange can defer both). Figures are a year-1 estimate at your 24.0% rate — not tax advice; consult a CPA.
Schools (NCES district)
- District
- Center 58
- NCES district ID
- 2908250
- Math proficiency
- 12% ▼ -15.00%
- Reading proficiency
- 29% ▼ -6.00%
- Median HH income
- $43,544
- Composite
- 17.64/100
- National rank
- #9031
- State rank
- #301 of 324 in MO
Livability — Kansas City
- Score
- 78/100
- State rank
- #28
- US rank
- #2671
Category grades
Schools grade is shown separately in the Schools card above.
Census & demographics
- Census place
- Kansas City, MO
- County
- Jackson County · 687,798 people
- City population
- 439,467
- Metro
- Kansas City, MO-KS
- Population (ZIP)
- 21,942
- Household income
- $64,201
- Rent vs Own
- Severe rent burden
- 1249.0
Population outlook (Jackson County) Hauer SSP2
- Today (2025)
- 719,589 people
- By 2030
- 731,456 · +1.6%
- By 2040
- 746,689 · +3.8%
- By 2050
- 749,289 · +4.1%
- By 2075
- 736,227 · +2.3%
- By 2100
- 668,210 · -7.1%
Race, ethnicity, and origin ACS 2023
- Neighborhood character
- Diverse neighborhood (Simpson 0.61)
- Race & ethnicity
- White 48% Black 39% Hispanic / Latino 7% Two or more races 7% Asian 1%
- Hispanic origin (detail)
- Mexican 3%
- Common ancestry
- Italian 5% Slovak 1% Lithuanian 1%
- Foreign-born
- 5% · Canada, Vietnam
- Languages at home
- 93% English-only · Spanish 3% French/Haitian/Cajun 1%
Political lean MEDSL · Jackson
- 2024 margin
- D (+19.3) · D 58.9% · R 39.5% · Other 1.6%
- 2008→2024 swing
- -6.1pp toward R · 2008: 25.4pp · 2024: 19.3pp
- All cycles
- 2024: D+19.3 2020: D+22.0 2016: D+16.6 2012: D+19.0 2008: D+25.4
Not yet ingested
- Civics
- —
Market trends
- HPI YoY
- ▼ -253.25%
- Current HPI
- 340.8202
- Rent YoY
- ▲ 3.97%
- Metro
- Kansas City, MO-KS
- State GDP YoY
- ▲ 1.84%
- F500 in state
- 20
Industry mix (Fortune 500 HQ in MO)
| Industry | F500 HQs | Revenue |
|---|---|---|
| Healthcare | 1 | $163B |
|
||
| Insurance | 1 | $21B |
|
||
| Industrial Technology | 1 | $17B |
|
||
| Retail | 1 | $16B |
|
||
| Industrial Distribution | 1 | $10B |
|
||
| Utilities | 1 | $9B |
|
||
Price history
+54.8% since first listed13 events — show timeline
- 2026-05-29 Coming Soon $240,000 Heartland MLS as Distributed by MLS Grid
- 2021-12-28 Sold (Public Records) — Public Records
- 2021-12-23 Sold (MLS) — Heartland MLS as Distributed by MLS Grid
- 2021-11-06 Pending — Heartland MLS as Distributed by MLS Grid
- 2021-11-04 Listed $185,000 Heartland MLS as Distributed by MLS Grid
- 2018-04-17 Sold (Public Records) — Public Records
- 2018-04-16 Sold (MLS) — Heartland MLS as Distributed by MLS Grid
- 2018-04-13 Pending — Heartland MLS as Distributed by MLS Grid
- 2018-03-20 Contingent — Heartland MLS as Distributed by MLS Grid
- 2018-03-08 Listed $155,000 Heartland MLS as Distributed by MLS Grid
- 1997-12-09 Sold (Public Records) — Public Records
- 1997-11-12 Sold (Public Records) — Public Records
- 1991-01-28 Sold (Public Records) — Public Records
Property tax history
+2.0%/yrLatest (2025): $2,643 · -5.1% YoY. Source: county tax records.
Cash-flow waterfall
monthlySold comps — $/sqft
last 12 mo · ≤1 miLoading sold comps…