532A Millpond Dr Unit 532A · San Jose, CA
Flood risk 4/10 · Minor
- FEMA flood zone
- AH
- Chance of flooding over 30 yrs
- 0.24%
- Est. flood insurance / yr
- $1,142 – $2,507
Fire risk 1/10 · Minimal
- Est. fire insurance / yr
- $659 – $1,223
Heat risk 5/10 · Moderate
- Hot days now (above 94°F)
- 7 days/yr
- Hot days in 30 yrs
- 14 days/yr
Wind risk 1/10 · Minimal
- Chance of severe wind over 30 yrs
- —
Air-quality risk 9/10 · Severe
- Unhealthy air days now
- 17 days/yr
- Unhealthy air days in 30 yrs
- 17 days/yr
Risk factors via First Street. Map © Google.
Why this score? — see what drove the B+ grade
The composite is a weighted blend of 9 inputs, each scored 0–100. Each bar is that input's sub-score; the figure is the points it added to the 100-point composite (weight × sub-score).
- Cash flow +29.7/30.0
- ARV discount +15.0/15.0
- DSCR +10.0/10.0
- 1% rule +8.4/10.0
- Schools +5.5/10.0
- Livability +3.9/5.0
- Rent growth +3.5/5.0
- Condition / age +2.5/5.0
- Appreciation +0.0/10.0
$289,888
🖨 Deal sheet (PDF) 📄 Offer letter ✓ Due diligence
Listing remarks MLS
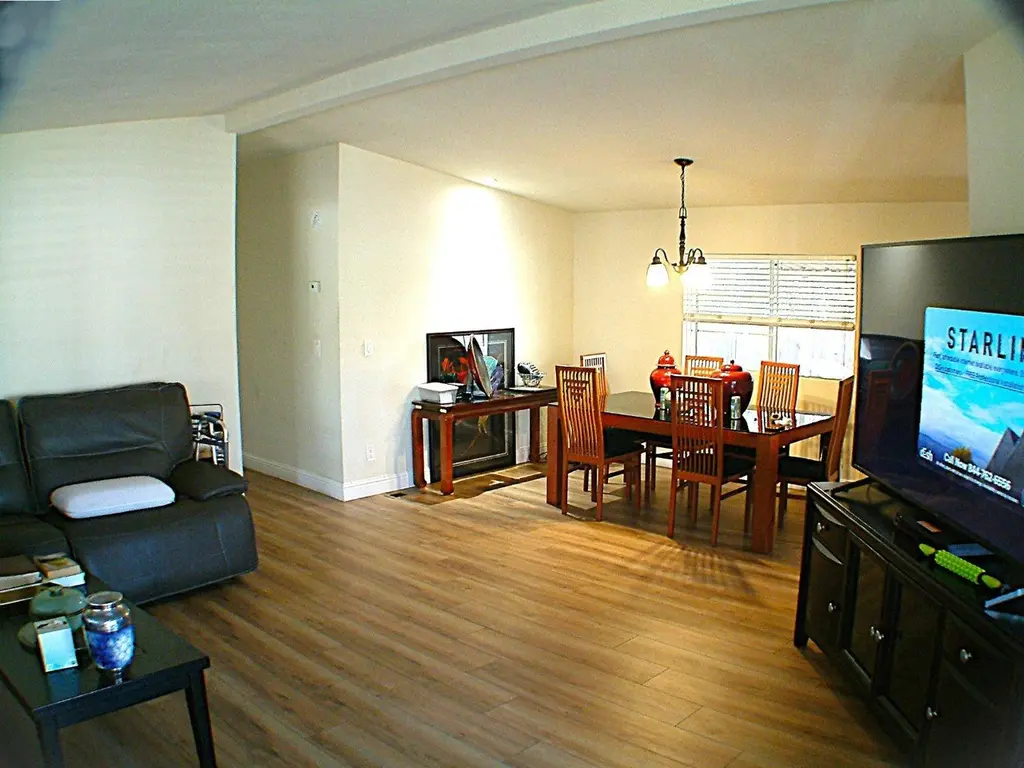
WONDERFULL CORNER LOT WITH FULL LENGTH FRONT DECK, LOCATED IN PREMIEER SAN JOSE PARK ,SHEET ROCK WALLS, LAMINATE FLOORS DUAL PANE WINDOWS, VAULTED CEILING, CUSTOM LEADED GLASS FRONT DOOR. GRANITE COUNTERS S.S APPLIANCES, OVERSIZED LAUNDRY ROOM ,TWO WALK IN CLOSETS, CENTRAL A/C .WALK TO GREAT SHOPPING & BUS BEST DEAL IN FIVE STAR COMMUNITY.
Key facts
- Laminate floors
- Sheet rock walls
- Vaulted ceiling
Tags
Neighborhood map
What this means for you Summary
Snapshot
- This is a 2-bed/2.0-bath manufactured listed at $290k.
Deal economics
- At list price, monthly cash flow is $902 ($11k/yr) — positive.
- The deal already cash-flows at list — no discount required.
- Meets the 1% rule at list price ($4k rent vs $290k).
- Recommended offer: $264k (9.0% below list) — sets the bar for market timing.
- Cap rate 10.7% vs local median 1.6% in San Jose — top-decile yield for the area; either an underpriced asset or a hidden risk that comps aren't pricing in. Stress-test before assuming the spread holds.
Location & tenants
- Location reads 78/100 on livability (#68 in CA, #2,559 nationally) — a middle-class / working-renter tenant base. Strengths: amenities A+, commute A+, employment A+; Watch: crime F, cost of living F.
- East Side Union High (urban): math 53% / reading 70% proficiency, ranked #69 of 517 in CA (top 13%) — acceptable for families but not a draw, mixed tenant base, ~2y average lease.
- Market conditions: Rents rising (+4.0%/yr); 119 active listings in the ZIP; 27 comparable units currently listed for rent nearby; rentals leasing fast (median 4d on market — plan ~1-2 weeks tenant-placement turnaround); high-income renter base; 3,838 units permitted in Santa Clara County in 2024 (1,886 in 5+ unit buildings).
Forward outlook
- Local home prices are declining (-3.0%/yr); year-one equity from $2k of loan paydown is wiped out by about $9k of value loss. Plan a longer hold.
- Santa Clara County population projected at +24% by 2050 — long-run rental-demand tailwind backs the buy-and-hold thesis.
- At projected returns (-3.0% appreciation + 4.0% rent growth), your $81k cash investment doubles in ~8 years — after that, you're playing with house money.
Negotiation context
- It's been on market 112 days — a 9% lower offer ($264k) is reasonable based on typical stale-listing flexibility.
- 7 sale attempts since 16y ago with the ask held roughly flat each time — persistent listings suggest the price (not the market) is what's stuck; bring a comps-based counter.
- Current owner paid $194k; 49% above their basis — modest negotiation headroom, anchor on the comps not their cost.
Risks & watch-outs
- Watch-outs: flood insurance adds $152/mo.
- Climate carrying-cost: in FEMA flood zone AH (mandatory federal flood insurance); extreme-heat days projected 7→14/yr by 2055 (HVAC capex compounding) — expect insurance premiums to compound above CPI over the hold.
Questions for the listing agent
- It's been on market 112 days. Have you received any prior offers? Is the seller open to a 9% concession, seller financing, or rate buy-down credit?
- What's the actual annual flood-insurance premium (NFIP or private), and is the property in a SFHA with mandatory coverage?
- Why hasn't it sold? Are there any deal-killer items the seller is aware of (foundation, flood, title, zoning, code violations)?
- Is there a deadline driving the sale (1031 exchange, divorce, estate, relocation)? That informs how much negotiation room exists.
- Crime grade is F in this area — have there been break-ins, vandalism, or insurance claims at this property in the last 3 years? What carrier currently insures it and at what premium?
- What's the average days-on-market for RENTAL listings here right now (not sales)? A rising rental-DOM trend means longer vacancies and softer asking-rent achievability than the comps imply.
- What's the recent tenant-quality profile in this submarket — average credit score on applications, eviction rate, late-payment / NSF rate, and stable-employment percentage? A property-management company in the area should have these aggregated.
- How much new for-sale + rental construction is in the pipeline within 1–3 miles? Heavy new supply typically softens prices + rents 12–24 months out; constrained supply supports both.
Investment metrics
- 1% rule
- 1.34% ✓
- Cap rate
- 10.66%
- Cash-on-cash
- 15.59%
- DSCR
- 1.69
- GRM
- 6.2
CMA / ARV
- ARV (median comp)
- $361,879
- List price
- $289,888
- Delta
- -19.89%
- Verdict
- UNDERPRICED
- Comps
- 20 within 1.0 mi
Show comp detail 12 sales within ~0.75 mi
| Address | Dist | Beds/Ba | Sqft | Sold | Price | $/sf | Match |
|---|---|---|---|---|---|---|---|
| 485 Millpond Dr #485 | 0.09mi | 2/2.0 | 1,440 (0%) | 2mo | $339,000 | $235 | 94 |
| 499 Millpond Dr #499 | 0.08mi | 3/2.0 (+1) | 1,440 (0%) | 0mo | $380,000 | $264 | 91 |
| 337 Mill Pond Dr #337 | 0.21mi | 2/2.0 | 1,440 (0%) | 1mo | $220,000 | $153 | 89 |
| 375 S Millpond Dr #375 | 0.07mi | 2/2.0 | 1,512 (+5%) | 4mo | $280,000 | $185 | 85 |
| 451 Millpond Dr #451 | 0.16mi | 2/2.0 | 1,488 (+3%) | 9mo | $280,000 | $188 | 80 |
| 556 Millpond Dr #556 | 0.21mi | 3/2.0 (+1) | 1,488 (+3%) | 1mo | $279,900 | $188 | 79 |
| 380 Millpond Dr #380 | 0.04mi | 2/2.0 | 1,296 (-10%) | 9mo | $275,000 | $212 | 74 |
| 707 Millstream Dr #707 | 0.27mi | 2/2.0 | 1,536 (+7%) | 3mo | $320,000 | $208 | 73 |
| 486 Millpond Dr #486 | 0.08mi | 3/2.0 (+1) | 1,559 (+8%) | 6mo | $350,000 | $225 | 72 |
| 401 Chateau La Salle #401 | 0.74mi | 2/2.0 | 1,440 (0%) | 1mo | $370,000 | $257 | 65 |
| 464 Mill Pond Dr #464 | 0.08mi | 3/3.0 (+1) | 1,632 (+13%) | 8mo | $272,000 | $167 | 58 |
| 393 Chateau La Salle Dr #393 | 0.71mi | 3/3.0 (+1) | 1,488 (+3%) | 2mo | $492,000 | $331 | 51 |
Match score weights: distance 35% · size 25% · config 20% · recency 20%. Top-matched comps best support the ARV.
Projected returns pro-forma
-3.0% appreciation · 3.97% rent growth · sell at horizon
- IRR
- 4.5%
- Equity multiple
- 1.18×
- Total profit
- $14,461
- Equity at exit
- $43,223
- IRR
- 15.0%
- Equity multiple
- 2.27×
- Total profit
- $103,173
- Equity at exit
- $25,064
Cash invested: $81,169 (down + closing). Projections, not guarantees.
Landlord ↔ Tenant lean methodology
- Overall (CITY)
- 0 Strongly Tenant-Friendly
- State California
- 18 Strongly Tenant-Friendly · D+13
- County
- — inherits STATE
- City San Jose
- 0 Strongly Tenant-Friendly · D+24
ZIP-level market 95125
- Rents YoY
- 4.0%
- Active inventory
- 119
- Price-to-rent
- 6.2×
Monthly cashflow live
- Estimated rent
- $3,871 high interval (Pro) →
- Mortgage (P&I)
- −$1,520
- Tax est. 1.5%
- −$362 /mo · $4,348/yr
- Insurance
- −$121
- Flood insurance flood zone
- −$152 /mo · $1,824/yr
- HOA
- −$0
- Vacancy / Maint / Mgmt
- −$813
- Net cashflow
- $902
Break-even live
Sensitivity live
| Price | -10% $1,103 | -5% $1,002 | +0% $902 | +5% $802 | +10% $702 |
|---|---|---|---|---|---|
| Rent | -10% $597 | -5% $749 | +0% $902 | +5% $1,055 | +10% $1,208 |
| Rate | -1.0pp $1,048 | -0.5pp $976 | base $902 | +0.5pp $827 | +1.0pp $751 |
UW: 25.0% down · 7.5% · 30yr · 1.5% tax · 5.0% vac · 8.0% maint · 8.0% mgmt
Financing live
Cash to close
- Down payment
- $72,472
- Closing costs
- $8,697
- Reserves months
- —
- Total cash needed
- —
Loan-product check · same deal, 3 products live
Conventional
25% down · 7.5% · 30yr
- Down + closing
- —
- Monthly P&I
- —
- Monthly cashflow
- —
- DSCR
- —
- Eligible?
- —
Personal DTI + credit; lowest rate.
DSCR
20% down · 8.5% · 30yr
- Down + closing
- —
- Monthly P&I
- —
- Monthly cashflow
- —
- DSCR
- —
- Eligible?
- —
No personal income docs; deal must DSCR.
Hard money
10% down · 12.0% · 12mo
- Down + closing
- —
- Monthly P&I
- —
- Monthly cashflow
- —
- DSCR
- —
- Eligible?
- —
Short-term bridge; refi at stabilization.
Rent comps 27 comps
| Address | Beds | Baths | Sqft | Rent | $/sqft | DOM | Units | Dist |
|---|---|---|---|---|---|---|---|---|
| 334 Olive Hill Dr San Jose, CA | 2.0 | 3.0 | 1368 | $4,150 | $3.03 | 2d | 1 | 0.28mi |
| 262 Azevedo Cir #1603 San Jose, CA | 3.0 | 3.0 | 1620 | $3,720 | $2.30 | 2d | 1 | 0.35mi |
| 1277 Babb Ct San Jose, CA | 2.0 | 2.0 | 1123 | $3,550 | $3.16 | 5d | 3 | 0.39mi |
| 2212 Almaden Rd Unit B San Jose, CA | 2.0 | 2.0 | 1200 | $3,195 | $2.66 | 5d | 1 | 0.52mi |
| 2070 Mary Helen Ln San Jose, CA | 3.0 | 4.0 | 1781 | $4,600 | $2.58 | 2d | 1 | 0.55mi |
| 590 Almaden Walk Loop San Jose, CA | 3.0 | 3.0 | 1425 | $3,995 | $2.80 | 44d | 1 | 0.65mi |
| 2988 Grassina St #309 San Jose, CA | 2.0 | 2.0 | 1048 | $3,600 | $3.44 | 2d | 1 | 0.66mi |
| 1036 Cumberland Pl San Jose, CA | 2.0 | 2.0 | 1264 | $5,375 | $4.25 | 44d | 1 | 0.89mi |
| 45 Esfahan Dr San Jose, CA | 3.0 | 2.5 | 1794 | $4,395 | $2.45 | 2d | 1 | 0.95mi |
| 559 Manor Dr Unit NA San Jose, CA | 2.0 | 1.5 | 1200 | $3,300 | $2.75 | 44d | 1 | 0.97mi |
| 2986 Lina St #7 San Jose, CA | 3.0 | 3.0 | 1813 | $5,500 | $3.03 | 17d | 1 | 0.97mi |
| 3200 Rubino Dr San Jose, CA | 1.0–2.0 | 1.0–2.0 | 928 | $3,740 | $4.03 | 3d | 1 | 0.98mi |
| 3024 Goodacre Pl San Jose, CA | 3.0 | 2.5 | 1431 | $2,200 | $1.54 | 44d | 1 | 0.98mi |
| 3157 Regency Ave #612 San Jose, CA | 2.0 | 2.5 | 1282 | $4,195 | $3.27 | 3d | 1 | 1.03mi |
| 2905 Old Almaden Rd San Jose, CA | 1.0 | 1.0 | 850 | $2,322 | $2.73 | 4d | 3 | 1.05mi |
| 1109 Lincoln Ct San Jose, CA | 2.0 | 2.0 | 1118 | $3,600 | $3.22 | 3d | 1 | 1.09mi |
| 1866 Glen Una Ave San Jose, CA | 3.0 | 2.0 | 1359 | $4,500 | $3.31 | 4d | 1 | 1.10mi |
| 818 Foxworthy Ave San Jose, CA | 3.0 | 2.5 | 1589 | $4,700 | $2.96 | 21d | 1 | 1.10mi |
| 818 Foxworthy Ave San Jose, CA | 3.0 | 2.5 | 1589 | $4,700 | $2.96 | 18d | 1 | 1.10mi |
| 3115 Tuscolana Way #1595 San Jose, CA | 3.0 | 2.5 | 1580 | $4,430 | $2.80 | 17d | 1 | 1.11mi |
| 318 Araglin Ct San Jose, CA | 2.0 | 2.0 | 1168 | $3,300 | $2.83 | 4d | 1 | 1.26mi |
| 3089 Valley of Hearts Delight Pl #5 San Jose, CA | 2.0 | 2.0 | 1668 | $5,195 | $3.11 | 2d | 1 | 1.28mi |
| 1232 Malone Rd San Jose, CA | 3.0 | 3.0 | 1711 | $6,995 | $4.09 | 17d | 1 | 1.33mi |
| 200 Lewis Rd San Jose, CA | 1.0–3.0 | 1.0–2.0 | 867 | $2,551 | $2.94 | 2d | 1 | 1.40mi |
| 3601 Copperfield Dr San Jose, CA | 1.0–3.0 | 1.0–3.0 | 1088 | $3,774 | $3.47 | 2d | 27 | 1.41mi |
| 1619 Lincoln Ave San Jose, CA | 2.0 | 1.0 | 1236 | $3,900 | $3.16 | 5d | 1 | 1.42mi |
| 1395 Vine St San Jose, CA | 3.0 | 1.0 | 1500 | $3,525 | $2.35 | 24d | 1 | 1.47mi |
Listing history 31 events
-
2026-06-21days on market $289,888 Active 112 DOM
-
2026-06-18days on market $289,888 Active 109 DOM
-
2026-06-17days on market $289,888 Active 108 DOM
-
2026-06-16days on market $289,888 Active 107 DOM
-
2026-06-15days on market $289,888 Active 106 DOM
-
2026-06-13days on market $289,888 Active 104 DOM
-
2026-06-13days on market $289,888 Active 103 DOM
-
2026-06-09days on market $289,888 Active 100 DOM
-
2026-06-08days on market $289,888 Active 99 DOM
-
2026-06-07days on market $289,888 Active 98 DOM
-
2026-06-05days on market $289,888 Active 95 DOM
-
2026-06-03days on market $289,888 Active 94 DOM
-
2026-06-02days on market $289,888 Active 93 DOM
-
2026-06-01days on market $289,888 Active 92 DOM
-
2026-05-31days on market $289,888 Active 91 DOM
-
2026-05-01status Active 345-char remark
Show marketing remark (345 chars)
WONDERFULL CORNER LOT WITH FULL LENGTH FRONT DECK, LOCATED IN PREMIEER SAN JOSE PARK ,SHEET ROCK WALLS, LAMINATE FLOORS DUAL PANE WINDOWS, VAULTED CEILING, CUSTOM LEADED GLASS FRONT DOOR. GRANITE COUNTERS S.S APPLIANCES, OVERSIZED LAUNDRY ROOM ,TWO WALK IN CLOSETS, CENTRAL A/C .WALK TO GREAT SHOPPING & BUS BEST DEAL IN FIVE STAR COMMUNITY.
-
2026-04-15status Pending 345-char remark
Show marketing remark (345 chars)
WONDERFULL CORNER LOT WITH FULL LENGTH FRONT DECK, LOCATED IN PREMIEER SAN JOSE PARK ,SHEET ROCK WALLS, LAMINATE FLOORS DUAL PANE WINDOWS, VAULTED CEILING, CUSTOM LEADED GLASS FRONT DOOR. GRANITE COUNTERS S.S APPLIANCES, OVERSIZED LAUNDRY ROOM ,TWO WALK IN CLOSETS, CENTRAL A/C .WALK TO GREAT SHOPPING & BUS BEST DEAL IN FIVE STAR COMMUNITY.
-
2026-04-15status Pending (Do Not Show) 345-char remark
Show marketing remark (345 chars)
WONDERFULL CORNER LOT WITH FULL LENGTH FRONT DECK, LOCATED IN PREMIEER SAN JOSE PARK ,SHEET ROCK WALLS, LAMINATE FLOORS DUAL PANE WINDOWS, VAULTED CEILING, CUSTOM LEADED GLASS FRONT DOOR. GRANITE COUNTERS S.S APPLIANCES, OVERSIZED LAUNDRY ROOM ,TWO WALK IN CLOSETS, CENTRAL A/C .WALK TO GREAT SHOPPING & BUS BEST DEAL IN FIVE STAR COMMUNITY.
-
2026-02-13$289,888 Active 345-char remark
Show marketing remark (345 chars)
WONDERFULL CORNER LOT WITH FULL LENGTH FRONT DECK, LOCATED IN PREMIEER SAN JOSE PARK ,SHEET ROCK WALLS, LAMINATE FLOORS DUAL PANE WINDOWS, VAULTED CEILING, CUSTOM LEADED GLASS FRONT DOOR. GRANITE COUNTERS S.S APPLIANCES, OVERSIZED LAUNDRY ROOM ,TWO WALK IN CLOSETS, CENTRAL A/C .WALK TO GREAT SHOPPING & BUS BEST DEAL IN FIVE STAR COMMUNITY.
-
2017-11-01soldstatus $194,500 Sold
-
2017-10-18historical Contingent
-
2017-09-15status Active
-
2017-08-08historical
-
2017-07-14$197,900 Active
-
2011-03-28soldstatus $65,000 Sold
-
2011-03-17status Pending (Do Not Show)
-
2011-03-17historical
-
2010-11-11price $76,000
-
2010-09-22$82,500 Active
ⓘ Source: listings_history table (triggers on properties + properties_extension) + one-shot
backfill from property_details.listing_events for pre-trigger history.
Climate risk First Street
- Flood 4/10 Moderate FEMA zone AH · 24% chance over 30 yrs
- Wildfire 1/10 Low
- Heat 5/10 Major 7 d/yr ≥94°F today · 14 d/yr by 30 yrs out
- Wind 1/10 Low
- Air quality 9/10 Extreme 17 unhealthy d/yr today · 17 by 30 yrs out
Nearby sold comps map
Loading sold comps map…
Walkable amenities ~0.75 mi
Loading nearby amenities…
Taxation est. · year 1
- Rental income
- $46,446
- − Mortgage interest
- −$16,238
- − Property taxes
- −$4,348
- − Insurance
- −$3,274
- − Repairs & maintenance
- −$3,716
- − Management
- −$3,716
- − Depreciation
- −$8,433
- Taxable income
- $6,721
- Est. tax owed @ 24.0%
- −$1,613
- After-tax cash flow
- $9,215/yr
For passive investors: Depreciation is non-cash, so a rental often shows a tax loss while cash-flowing — sheltering income. Rental losses are passive: they offset passive income freely, and up to $25,000/yr can offset ordinary (W-2) income if you actively participate and your MAGI is under $100k (phasing out to $0 by $150k); unused losses carry forward. On sale, claimed depreciation is recaptured at up to 25%, and gains may owe capital-gains tax (a 1031 exchange can defer both). Figures are a year-1 estimate at your 24.0% rate — not tax advice; consult a CPA.
Schools (NCES district)
- District
- East Side Union High
- NCES district ID
- 0611820
- Math proficiency
- 53% ▲ 12.00%
- Reading proficiency
- 70% ▲ 8.00%
- Median HH income
- $80,293
- Composite
- 55.15/100
- National rank
- #1278
- State rank
- #69 of 517 in CA
Livability — San Jose
- Score
- 78/100
- State rank
- #68
- US rank
- #2559
Category grades
Schools grade is shown separately in the Schools card above.
Census & demographics
- Census place
- San Jose, CA
- County
- Santa Clara County · 1,806,974 people
- City population
- 954,479
- Metro
- San Jose-Sunnyvale-Santa Clara, CA
- Population (ZIP)
- 54,419
- Household income
- $160,738
- Rent vs Own
- Severe rent burden
- 1772.0
Population outlook (Santa Clara County) Hauer SSP2
- Today (2025)
- 2,179,074 people
- By 2030
- 2,301,297 · +5.6%
- By 2040
- 2,528,195 · +16.0%
- By 2050
- 2,712,135 · +24.5%
- By 2075
- 2,998,701 · +37.6%
- By 2100
- 2,931,429 · +34.5%
Race, ethnicity, and origin ACS 2023
- Neighborhood character
- Diverse neighborhood (Simpson 0.67)
- Race & ethnicity
- White 47% Hispanic / Latino 29% Asian 17% Two or more races 17% Black 2%
- Hispanic origin (detail)
- Mexican 22%
- Common ancestry
- Italian 3% Lithuanian 2% Romanian 2%
- Foreign-born
- 24% · Canada, China, Vietnam
- Languages at home
- 65% English-only · Spanish 18% Other Indo-European 4% Chinese 3%
Political lean MEDSL · Santa Clara
- 2024 margin
- Solid D (+40.0) · D 68.1% · R 28.1% · Other 3.8%
- 2008→2024 swing
- -0.9pp no change · 2008: 40.9pp · 2024: 40.0pp
- All cycles
- 2024: D+40.0 2020: D+47.4 2016: D+52.5 2012: D+42.1 2008: D+40.9
Not yet ingested
- Civics
- —
Market trends
- HPI YoY
- ▼ -1489.34%
- Current HPI
- 364.2721
- Rent YoY
- ▲ 3.97%
- Metro
- San Jose-Sunnyvale-Santa Clara, CA
- State GDP YoY
- ▲ 3.21%
- F500 in state
- 116
Industry mix (Fortune 500 HQ in CA)
| Industry | F500 HQs | Revenue |
|---|---|---|
| Technology | 27 | $1,492B |
|
||
| Financial Services | 3 | $174B |
|
||
| Retail | 3 | $44B |
|
||
| Insurance | 3 | $26B |
|
||
| Media / Entertainment | 2 | $115B |
|
||
| Pharmaceuticals / Biotech | 2 | $62B |
|
||
Price history
+251.4% since first listed16 events — show timeline
- 2026-05-01 Relisted — bridgeMLS, Bay East AOR, or Contra Costa AOR
- 2026-05-01 Relisted — MLSListings
- 2026-04-15 Pending — bridgeMLS, Bay East AOR, or Contra Costa AOR
- 2026-04-15 Pending — MLSListings
- 2026-02-13 Listed $289,888 MLSListings
- 2026-02-13 Listed $289,888 bridgeMLS, Bay East AOR, or Contra Costa AOR
- 2017-11-01 Sold (MLS) $194,500 MLSListings
- 2017-10-18 Contingent — MLSListings
- 2017-09-15 Relisted — MLSListings
- 2017-08-08 Listing Removed — MLSListings
- 2017-07-14 Listed $197,900 MLSListings
- 2011-03-28 Sold (MLS) $65,000 MLSListings
- 2011-03-17 Pending — MLSListings
- 2011-03-17 Listing Removed — MLSListings
- 2010-11-11 Price Changed $76,000 MLSListings
- 2010-09-22 Listed $82,500 MLSListings
Cash-flow waterfall
monthlySold comps — $/sqft
last 12 mo · ≤1 miLoading sold comps…